Advanced YOLO26 Experiment Tracking with DVCLive
Experiment tracking in machine learning is critical to model development and evaluation. It involves recording and analyzing various parameters, metrics, and outcomes from numerous training runs. This process is essential for understanding model performance and making data-driven decisions to refine and optimize models.
Integrating DVCLive with Ultralytics YOLO26 transforms the way experiments are tracked and managed. This integration offers a seamless solution for automatically logging key experiment details, comparing results across different runs, and visualizing data for in-depth analysis. In this guide, we'll understand how DVCLive can be used to streamline the process.
DVCLive
DVCLive, developed by DVC, is an innovative open-source tool for experiment tracking in machine learning. Integrating seamlessly with Git and DVC, it automates the logging of crucial experiment data like model parameters and training metrics. Designed for simplicity, DVCLive enables effortless comparison and analysis of multiple runs, enhancing the efficiency of machine learning projects with intuitive data visualization and analysis tools.
YOLO26 Training with DVCLive
YOLO26 training sessions can be effectively monitored with DVCLive. Additionally, DVC provides integral features for visualizing these experiments, including the generation of a report that enables the comparison of metric plots across all tracked experiments, offering a comprehensive view of the training process.
Installation
To install the required packages, run:
Installation
# Install the required packages for YOLO26 and DVCLive
pip install ultralytics dvclive
For detailed instructions and best practices related to the installation process, be sure to check our YOLO26 Installation guide. While installing the required packages for YOLO26, if you encounter any difficulties, consult our Common Issues guide for solutions and tips.
Configuring DVCLive
Once you have installed the necessary packages, the next step is to set up and configure your environment with the required credentials. This setup ensures a smooth integration of DVCLive into your existing workflow.
Begin by initializing a Git repository, as Git plays a crucial role in version control for both your code and DVCLive configurations.
Initial Environment Setup
# Initialize a Git repository
git init -q

# Configure Git with your details
git config --local user.email "you@example.com"
git config --local user.name "Your Name"

# Initialize DVCLive in your project
dvc init -q

# Commit the DVCLive setup to your Git repository
git commit -m "DVC init"
In these commands, ensure you replace "you@example.com" with the email address associated with your Git account, and "Your Name" with your Git account username.
Usage
Before diving into the usage instructions, be sure to check out the range of YOLO26 models offered by Ultralytics. This will help you choose the most appropriate model for your project requirements.
Training YOLO26 Models with DVCLive
Start by running your YOLO26 training sessions. You can use different model configurations and training parameters to suit your project needs. For instance:
# Example training commands for YOLO26 with varying configurations
yolo train model=yolo26n.pt data=coco8.yaml epochs=5 imgsz=512
yolo train model=yolo26n.pt data=coco8.yaml epochs=5 imgsz=640
Adjust the model, data, epochs, and imgsz parameters according to your specific requirements. For a detailed understanding of the model training process and best practices, refer to our YOLO26 Model Training guide.
Monitoring Experiments with DVCLive
DVCLive enhances the training process by enabling the tracking and visualization of key metrics. When installed, Ultralytics YOLO26 automatically integrates with DVCLive for experiment tracking, which you can later analyze for performance insights. For a comprehensive understanding of the specific performance metrics used during training, be sure to explore our detailed guide on performance metrics.
Analyzing Results
After your YOLO26 training sessions are complete, you can leverage DVCLive's powerful visualization tools for in-depth analysis of the results. DVCLive's integration ensures that all training metrics are systematically logged, facilitating a comprehensive evaluation of your model's performance.
To start the analysis, you can extract the experiment data using DVC's API and process it with Pandas for easier handling and visualization:
import dvc.api
import pandas as pd

# Define the columns of interest
columns = ["Experiment", "epochs", "imgsz", "model", "metrics.mAP50-95(B)"]

# Retrieve experiment data
df = pd.DataFrame(dvc.api.exp_show(), columns=columns)

# Clean the data
df.dropna(inplace=True)
df.reset_index(drop=True, inplace=True)

# Display the DataFrame
print(df)
The output of the code snippet above provides a clear tabular view of the different experiments conducted with YOLO26 models. Each row represents a different training run, detailing the experiment's name, the number of epochs, image size (imgsz), the specific model used, and the mAP50-95(B) metric. This metric is crucial for evaluating the model's accuracy, with higher values indicating better performance.
Visualizing Results with Plotly
For a more interactive and visual analysis of your experiment results, you can use Plotly's parallel coordinates plot. This type of plot is particularly useful for understanding the relationships and trade-offs between different parameters and metrics.
from plotly.express import parallel_coordinates

# Create a parallel coordinates plot
fig = parallel_coordinates(df, columns, color="metrics.mAP50-95(B)")

# Display the plot
fig.show()
The output of the code snippet above generates a plot that will visually represent the relationships between epochs, image size, model type, and their corresponding mAP50-95(B) scores, enabling you to spot trends and patterns in your experiment data.
Generating Comparative Visualizations with DVC
DVC provides a useful command to generate comparative plots for your experiments. This can be especially helpful to compare the performance of different models over various training runs.
# Generate DVC comparative plots
dvc plots diff $(dvc exp list --names-only)
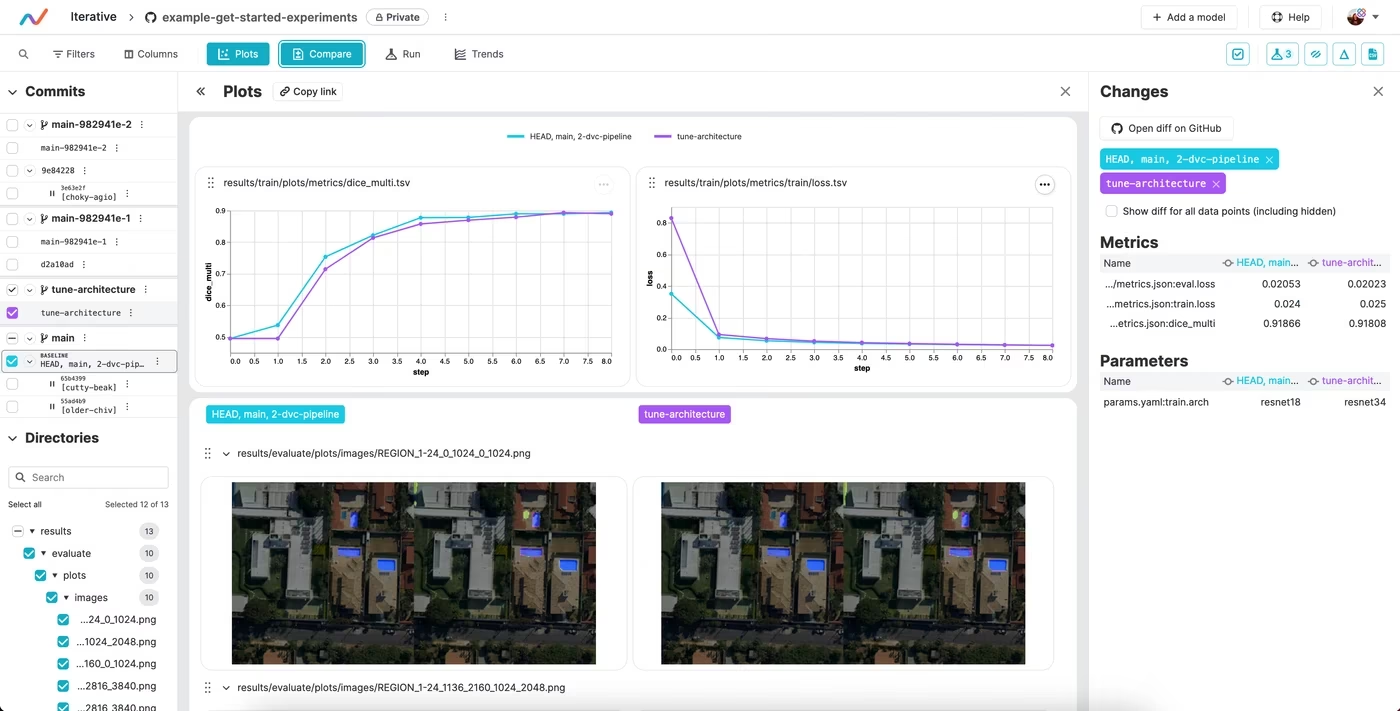
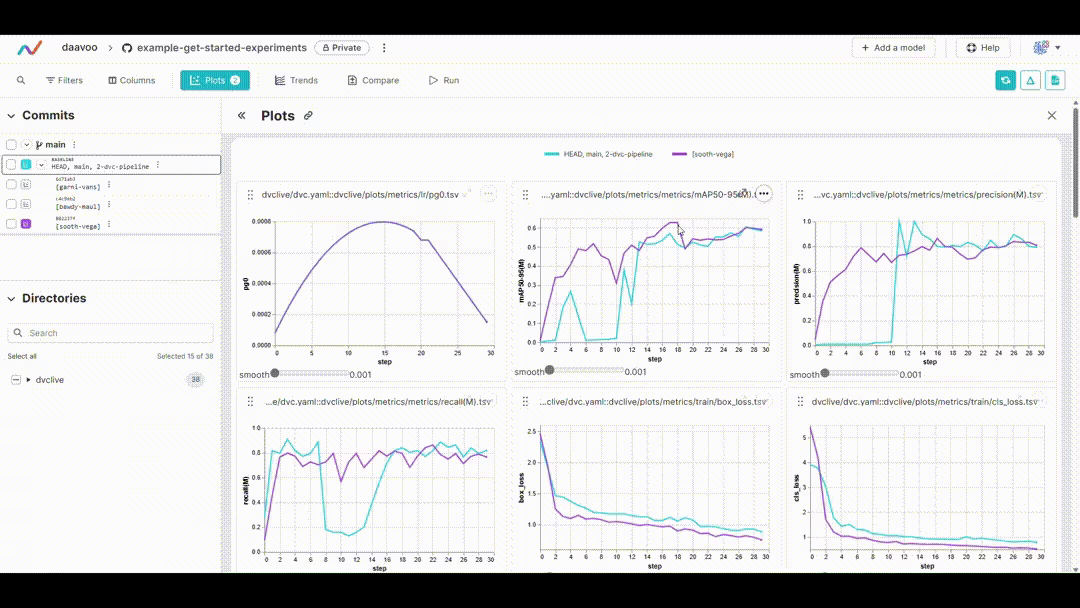
After executing this command, DVC generates plots comparing the metrics across different experiments, which are saved as HTML files. Below is an example image illustrating typical plots generated by this process. The image showcases various graphs, including those representing mAP, recall, precision, loss values, and more, providing a visual overview of key performance metrics:
Displaying DVC Plots
If you are using a Jupyter Notebook and you want to display the generated DVC plots, you can use the IPython display functionality.
from IPython.display import HTML

# Display the DVC plots as HTML
HTML(filename="./dvc_plots/index.html")
This code will render the HTML file containing the DVC plots directly in your Jupyter Notebook, providing an easy and convenient way to analyze the visualized experiment data.
Making Data-Driven Decisions
Use the insights gained from these visualizations to make informed decisions about model optimizations, hyperparameter tuning, and other modifications to enhance your model's performance.
Iterating on Experiments
Based on your analysis, iterate on your experiments. Adjust model configurations, training parameters, or even the data inputs, and repeat the training and analysis process. This iterative approach is key to refining your model for the best possible performance.
Summary
This guide has led you through the process of integrating DVCLive with Ultralytics' YOLO26. You have learned how to harness the power of DVCLive for detailed experiment monitoring, effective visualization, and insightful analysis in your machine learning endeavors.
For further details on usage, visit DVCLive's official documentation.
Additionally, explore more integrations and capabilities of Ultralytics by visiting the Ultralytics integration guide page, which is a collection of great resources and insights.
FAQ
How do I integrate DVCLive with Ultralytics YOLO26 for experiment tracking?
Integrating DVCLive with Ultralytics YOLO26 is straightforward. Start by installing the necessary packages:
Installation
pip install ultralytics dvclive
Next, initialize a Git repository and configure DVCLive in your project:
Initial Environment Setup
git init -q
git config --local user.email "you@example.com"
git config --local user.name "Your Name"
dvc init -q
git commit -m "DVC init"
Follow our YOLO26 Installation guide for detailed setup instructions.
Why should I use DVCLive for tracking YOLO26 experiments?
Using DVCLive with YOLO26 provides several advantages, such as:
- Automated Logging: DVCLive automatically records key experiment details like model parameters and metrics.
- Easy Comparison: Facilitates comparison of results across different runs.
- Visualization Tools: Leverages DVCLive's robust data visualization capabilities for in-depth analysis.
For further details, refer to our guide on YOLO26 Model Training and YOLO Performance Metrics to maximize your experiment tracking efficiency.
How can DVCLive improve my results analysis for YOLO26 training sessions?
After completing your YOLO26 training sessions, DVCLive helps in visualizing and analyzing the results effectively. Example code for loading and displaying experiment data:
import dvc.api
import pandas as pd

# Define columns of interest
columns = ["Experiment", "epochs", "imgsz", "model", "metrics.mAP50-95(B)"]

# Retrieve experiment data
df = pd.DataFrame(dvc.api.exp_show(), columns=columns)

# Clean data
df.dropna(inplace=True)
df.reset_index(drop=True, inplace=True)

# Display DataFrame
print(df)
To visualize results interactively, use Plotly's parallel coordinates plot:
from plotly.express import parallel_coordinates

fig = parallel_coordinates(df, columns, color="metrics.mAP50-95(B)")
fig.show()
Refer to our guide on YOLO26 Training with DVCLive for more examples and best practices.
What are the steps to configure my environment for DVCLive and YOLO26 integration?
To configure your environment for a smooth integration of DVCLive and YOLO26, follow these steps:
- Install Required Packages: Use
pip install ultralytics dvclive. - Initialize Git Repository: Run
git init -q. - Setup DVCLive: Execute
dvc init -q. - Commit to Git: Use
git commit -m "DVC init".
These steps ensure proper version control and setup for experiment tracking. For in-depth configuration details, visit our Configuration guide.
How do I visualize YOLO26 experiment results using DVCLive?
DVCLive offers powerful tools to visualize the results of YOLO26 experiments. Here's how you can generate comparative plots:
Generate Comparative Plots
dvc plots diff $(dvc exp list --names-only)
To display these plots in a Jupyter Notebook, use:
from IPython.display import HTML

# Display plots as HTML
HTML(filename="./dvc_plots/index.html")
These visualizations help identify trends and optimize model performance. Check our detailed guides on YOLO26 Experiment Analysis for comprehensive steps and examples.


