Тепловые карты отслеживания объектов с Ultralytics YOLO26

Решение Heatmap в Ultralytics YOLO26 отслеживает объекты между видеокадрами и накладывает на каждый кадр карту накопленной интенсивности их движения: оживлённые зоны выделяются тёплыми цветами, а спокойные остаются холодными. Решение построено на отслеживании объектов YOLO26 и превращает любое видео в карту пространственной активности, показывающую транспортные потоки, движение толпы и зоны длительного пребывания. Для этого достаточно одного вызова Python или команды CLI.
Смотри: Как создавать тепловые карты с Ultralytics YOLO26 | Визуализация активности объектов | VisionAI в розничной торговле 🚀
Зачем использовать тепловые карты для анализа видео?#
- Наглядное выявление закономерностей активности: интенсивность накапливается в местах, где находятся отслеживаемые объекты, поэтому оживлённые проходы, популярные полки и места скопления людей легко заметить без ручного просмотра каждого кадра.
- Отслеживание уже встроено: решение самостоятельно выполняет обнаружение и отслеживание объектов с помощью YOLO26, поэтому не нужно настраивать отдельный конвейер отслеживания.
- Подсчёт в том же проходе: передай
region, чтобы подсчитывать входящие в зону и выходящие из неё объекты одновременно с построением тепловой карты и объединить две аналитические задачи в одном запуске.
Применение в реальном мире#
| Транспорт | Розничная торговля |
|---|---|
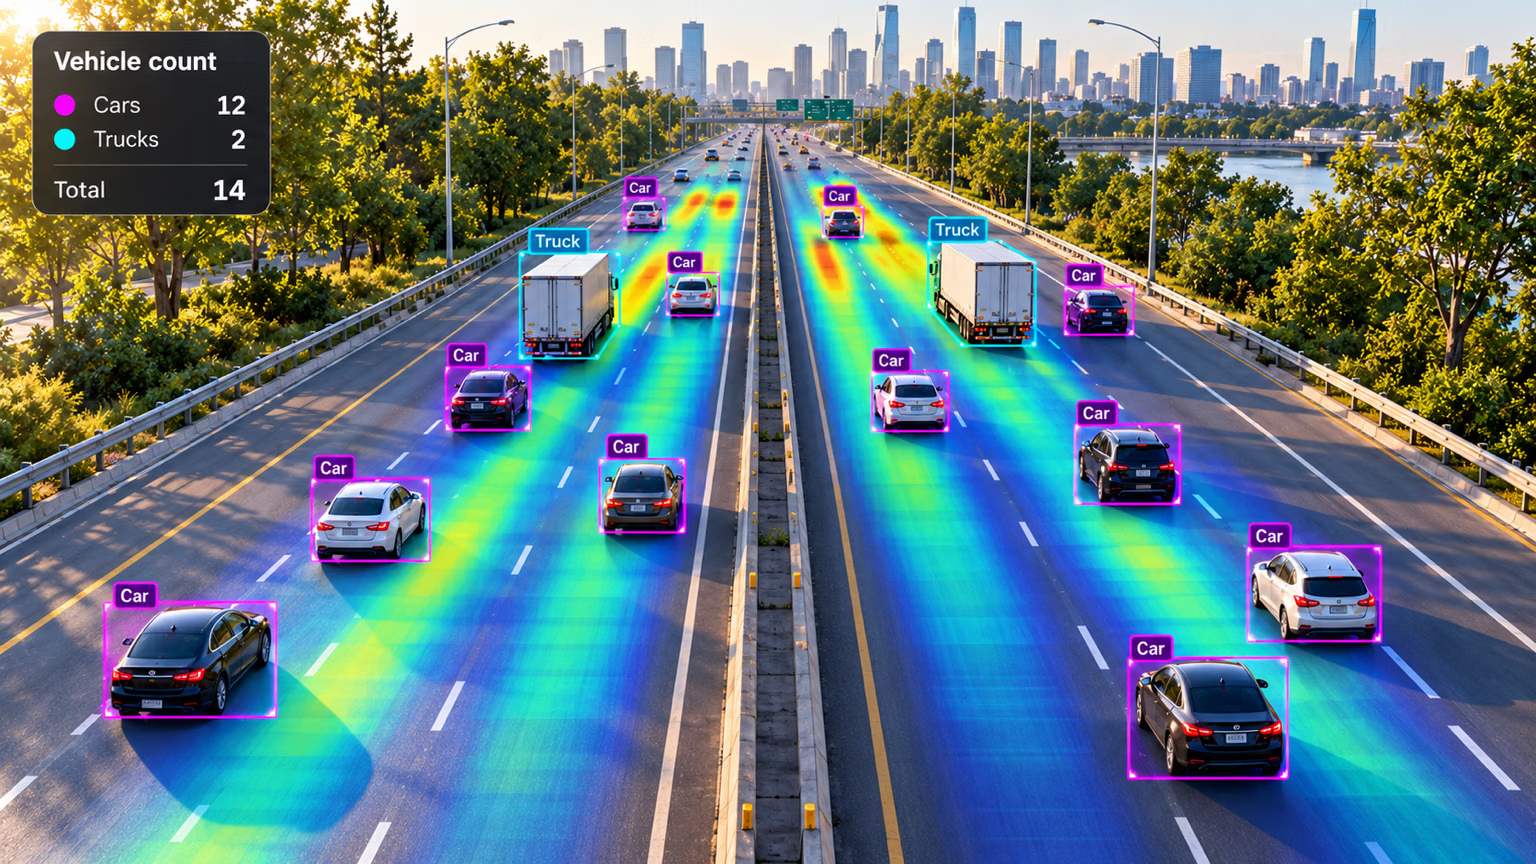 | 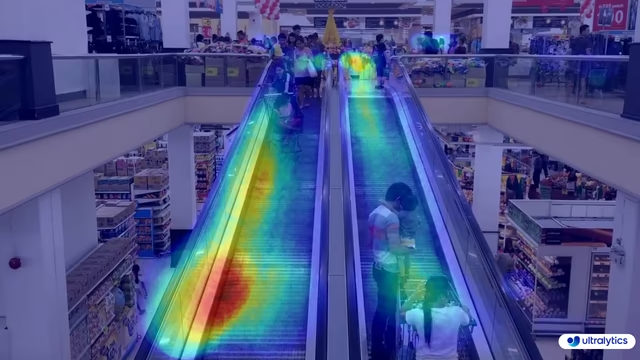 |
| Тепловая карта транспорта Ultralytics YOLO | Тепловая карта розничной торговли Ultralytics YOLO |
Как создавать тепловые карты с помощью Ultralytics YOLO#
Запусти решение Heatmap для видеоисточника из CLI или Python. Пример на Python записывает обработанные кадры в выходной видеофайл:
# Run a heatmap example
yolo solutions heatmap show=True

# Pass a source video
yolo solutions heatmap source="path/to/video.mp4"

# Pass a custom colormap
yolo solutions heatmap colormap=cv2.COLORMAP_INFERNO

# Heatmaps + object counting
yolo solutions heatmap region="[(20, 400), (1080, 400), (1080, 360), (20, 360)]"
Аргументы Heatmap()#
Вот таблица с аргументами Heatmap:
| Аргумент | Тип | По умолчанию | Описание |
|---|---|---|---|
model | str | None | Путь к файлу модели Ultralytics YOLO. |
colormap | int | cv2.COLORMAP_DEEPGREEN | Цветовая карта для тепловой карты. |
show_in | bool | True | Флаг, управляющий отображением счётчиков входа в видеопотоке. |
show_out | bool | True | Флаг, управляющий отображением счётчиков выхода в видеопотоке. |
region | list или dict | None | Точки, задающие интересующую область: список кортежей (x, y) или словарь, сопоставляющий названия областей со списками точек для нескольких областей (только RegionCounter). Если None, решения, которым требуется область, используют заданную по умолчанию область. |
line_width | int | 2 | Толщина линий рамок, ключевых точек и счётчиков, которые рисует решение. |
verbose | bool | True | Включает журнал решения для каждого кадра с указанием формы входных данных, количества объектов по классам и скорости обработки. Сам вызов отслеживания всегда выполняется без вывода сообщений. |
В решении Heatmap также можно использовать различные аргументы track.
| Аргумент | Тип | По умолчанию | Описание |
|---|---|---|---|
tracker | str | 'tracktrack.yaml' | Задаёт алгоритм отслеживания. Встроенные варианты: botsort.yaml, bytetrack.yaml, ocsort.yaml, deepocsort.yaml, fasttrack.yaml, tracktrack.yaml. |
conf | float | 0.25 | Задаёт порог уверенности для обнаружений: при более низких значениях можно отслеживать больше объектов, но возрастает вероятность ложноположительных срабатываний. |
iou | float | 0.5 | Задаёт порог пересечения над объединением (IoU) для фильтрации перекрывающихся обнаружений. |
classes | list | None | Фильтрует результаты по индексу класса. Например, classes=[0, 2, 3] отслеживает только указанные классы. |
device | str | None | Задаёт устройство для инференса (например, cpu, cuda:0 или 0). Позволяет выбрать CPU, определённый GPU или другое вычислительное устройство для выполнения модели. |
imgsz | int or tuple | 640 | Целевой размер изображения для инференса: целое число для квадратного изображения или пара (height, width). Размеры корректируются с учётом шага модели. |
max_det | int | 300 | Максимальное количество обнаружений, сохраняемых в каждом кадре перед отслеживанием; ограничивает число объектов, обрабатываемых решением в насыщенных сценах. |
quantize | int or str | None | Точность инференса: 16 (FP16) или 32/unset (FP32) для моделей PyTorch и TorchScript не на CPU; для других форматов точность определяется артефактом модели и средой выполнения. Заменяет устаревший аргумент half. |
Кроме того, ниже перечислены поддерживаемые аргументы визуализации:
| Аргумент | Тип | По умолчанию | Описание |
|---|---|---|---|
show | bool | False | Если True, показывает аннотированные изображения или видео в окне. Полезно для мгновенной визуальной проверки во время разработки или тестирования. |
show_conf | bool | True | Показывает оценку уверенности каждой детекции рядом с меткой. Позволяет оценить уверенность модели в каждой детекции. |
show_labels | bool | True | Показывает метки каждой детекции на визуализации. Помогает сразу понять, какие объекты обнаружены. |
Цветовые карты тепловой карты#
Аргумент colormap принимает любую цветовую карту OpenCV. Передай константу из модуля cv2, например colormap=cv2.COLORMAP_INFERNO:
| Название цветовой карты | Описание |
|---|---|
cv2.COLORMAP_AUTUMN | Цветовая карта «Осень» |
cv2.COLORMAP_BONE | Цветовая карта «Кость» |
cv2.COLORMAP_JET | Цветовая карта Jet |
cv2.COLORMAP_WINTER | Цветовая карта Winter |
cv2.COLORMAP_RAINBOW | Цветовая карта Rainbow |
cv2.COLORMAP_OCEAN | Цветовая карта Ocean |
cv2.COLORMAP_SUMMER | Цветовая карта Summer |
cv2.COLORMAP_SPRING | Цветовая карта Spring |
cv2.COLORMAP_COOL | Цветовая карта Cool |
cv2.COLORMAP_HSV | Цветовая карта HSV (оттенок, насыщенность, значение) |
cv2.COLORMAP_PINK | Цветовая карта Pink |
cv2.COLORMAP_HOT | Цветовая карта Hot |
cv2.COLORMAP_PARULA | Цветовая карта Parula |
cv2.COLORMAP_MAGMA | Цветовая карта Magma |
cv2.COLORMAP_INFERNO | Цветовая карта Inferno |
cv2.COLORMAP_PLASMA | Цветовая карта Plasma |
cv2.COLORMAP_VIRIDIS | Цветовая карта Viridis |
cv2.COLORMAP_CIVIDIS | Цветовая карта Cividis |
cv2.COLORMAP_TWILIGHT | Цветовая карта Twilight |
cv2.COLORMAP_TWILIGHT_SHIFTED | Смещённая цветовая карта Twilight |
cv2.COLORMAP_TURBO | Цветовая карта Turbo |
cv2.COLORMAP_DEEPGREEN | Цветовая карта Deep Green |
Как работают тепловые карты#
Решение Heatmap расширяет класс ObjectCounter. При обработке первого кадра оно создаёт пустой слой интенсивности, соответствующий размеру кадра. Каждый кадр обрабатывается в два этапа:
- YOLO26 отслеживает объекты и обнаруживает каждый из них в кадре
- Для каждого отслеживаемого объекта интенсивность тепловой карты увеличивается в круглой области с центром в его ограничивающей рамке
Один раз за кадр накопленный слой интенсивности нормализуется, раскрашивается с помощью выбранной цветовой карты и накладывается на исходный кадр. Наложение появляется, когда отслежен хотя бы один объект; до этого кадры отображаются без тепловой карты.
В результате получается динамическая визуализация, которая формируется со временем и показывает схемы движения транспорта и толпы, а также другие пространственные закономерности в видеоданных. Если задан region, решение также подсчитывает объекты, входящие в эту область и покидающие её, пока формируется тепловая карта.
Заключение#
Решение Ultralytics YOLO26 Heatmap преобразует результаты отслеживания объектов в наглядное наложение активности — для этого достаточно нескольких строк кода. Чтобы расширить возможности, объедини его с подсчётом объектов, изучи другие решения Ultralytics или прочитай об используемом режиме отслеживания.
Часто задаваемые вопросы#
Ultralytics YOLO26 строит тепловые карты, отслеживая объекты в последовательности видеокадров и накапливая значения интенсивности в местах нахождения каждого отслеживаемого объекта, а затем раскрашивает результат и накладывает его на исходный кадр. В областях, где объекты часто появляются или задерживаются, интенсивность накапливается и отображается более тёплыми цветами. Варианты настройки см. в разделе
Heatmap()«Аргументы».Используй
cv2.VideoWriterиз OpenCV и записывайresults.plot_imдля каждого обработанного кадра, как показано в основном примере. Атрибутplot_imсодержит кадр, на который уже наложена тепловая карта.Да. Передай аргумент
regionвHeatmap(), указав точки линии, прямоугольника или многоугольника. Решение будет подсчитывать объекты, входящие в эту область и покидающие её, пока формируется тепловая карта. Возвращаемые результаты включаютin_count,out_countи количество объектов каждого класса. Подробнее о настройке областей см. в руководстве по подсчёту объектов.Передай аргумент
classesвHeatmap(), указав индексы классов, которые нужно оставить. Например,classes=[0, 2]строит тепловую карту только по людям и автомобилям (индексы классов COCO 0 и 2):import cv2 from ultralytics import solutions cap = cv2.VideoCapture("path/to/video.mp4") heatmap = solutions.Heatmap(show=True, model="yolo26n.pt", classes=[0, 2]) while cap.isOpened(): success, im0 = cap.read() if not success: break results = heatmap(im0) cap.release() cv2.destroyAllWindows()Тепловые карты Ultralytics YOLO26 объединяют обнаружение объектов, трекинг, накопление интенсивности и наложение изображения в одном вызове. Для универсальных инструментов, таких как OpenCV или Matplotlib, этот конвейер нужно создавать самостоятельно. Решение обрабатывает видеопотоки в реальном времени и из коробки поддерживает постоянный трекинг и настраиваемые цветовые карты.


Комментарии65
Задай вопрос, поделись результатами или помоги кому-нибудь.
RizwanMunawar
🎉 Big News Alert! 🚀 Ultralytics Solutions CLI is here from ultralytics>=8.3.28! Now, you can easily harness the power of advanced YOLO solutions straight from the command line. Simplify your workflow, and streamline object detection, tracking, counting, and more—all with just a few commands! Get ready to experience a whole new level of efficiency! 💥
CLI Usage Overview
yolo SOLUTIONS SOLUTION_NAME ARGS- SOLUTIONS is a mandatory keyword.
- SOLUTION_NAME (optional): Choose from ['count', 'heatmap', 'queue', 'speed', 'workout', 'analytics'].
- ARGS (optional): Use custom
arg=valuepairs, likeshow_in=True, to customize settings.
Examples
yolo solutions heatmap show=True  # For object counting

yolo solutions heatmap source="path/to/video/file.mp4"  # Specify a video file path
Start exploring now and let Ultralytics Solutions CLI power up your projects!
4Arjunpixel28
Has any one applied heatmap on instance segmentation ?
2 Glenn JocherUltralytics(изменено)
Yes, applying heatmaps to instance segmentation is feasible and offers a vivid way to visualize the density and distribution of detected objects across video frames 🌈. The
Heatmapsolution runs tracking itself with whatever model you give it, including a segmentation model, and accumulates intensity around each tracked object's bounding box (the masks themselves are not used). Here's a simplified example:import cv2 from ultralytics import solutions cap = cv2.VideoCapture("path/to/video.mp4") assert cap.isOpened(), "Failed to open video file or stream!" w, h, fps = (int(cap.get(x)) for x in (cv2.CAP_PROP_FRAME_WIDTH, cv2.CAP_PROP_FRAME_HEIGHT, cv2.CAP_PROP_FPS)) video_writer = cv2.VideoWriter("heatmap_output.avi", cv2.VideoWriter_fourcc(*"mp4v"), fps, (w, h)) # Initialize your heatmap object with a segmentation model heatmap = solutions.Heatmap(show=True, model="yolo26n-seg.pt", colormap=cv2.COLORMAP_PARULA) # Process video frames while cap.isOpened(): success, frame = cap.read() if not success: break # Exit loop if no more frames results = heatmap(frame) video_writer.write(results.plot_im) cap.release() video_writer.release() cv2.destroyAllWindows()This snippet performs tracking with an instance segmentation model on video frames and overlays the accumulated heatmap. Remember, the success of applying heatmaps heavily relies on the quality of your model, so ensure it has been adequately trained or fine-tuned for your instance segmentation task. Happy visualizing! 🚀
 Paula DerrengerUltralytics(изменено)
Yes, applying heatmaps to instance segmentation is feasible and offers a vivid way to visualize the density and distribution of detected objects across video frames 🌈. The
Heatmapsolution tracks objects with the model you provide, including a segmentation model, and overlays the accumulated activity on each frame. It builds the heatmap from the tracked objects' bounding boxes rather than the masks.Here's a simplified example:
import cv2

from ultralytics import solutions

# Initialize video capture
cap = cv2.VideoCapture("path/to/your/video.mp4")
assert cap.isOpened(), "Error reading video file"

# Video writer setup
w, h, fps = (int(cap.get(x)) for x in (cv2.CAP_PROP_FRAME_WIDTH, cv2.CAP_PROP_FRAME_HEIGHT, cv2.CAP_PROP_FPS))
video_writer = cv2.VideoWriter("segmentation_heatmap.avi", cv2.VideoWriter_fourcc(*"mp4v"), fps, (w, h))

# Initialize heatmap with a segmentation model
heatmap = solutions.Heatmap(show=True, model="yolo26n-seg.pt", colormap=cv2.COLORMAP_JET)

while cap.isOpened():
    success, im0 = cap.read()
    if not success:
        break

    # Track objects and generate the heatmap overlay
    results = heatmap(im0)

    # Write heatmap output
    video_writer.write(results.plot_im)

# Cleanup
cap.release()
video_writer.release()
cv2.destroyAllWindows()
Feel free to experiment with different configurations, such as
colormap, to meet your specific visualization needs. Happy coding! 🚀Hi ,
heatmap_obj = heatmap.Heatmap(view_img=False, imw=w, imh=h, heatmap_alpha=0.5, colormap=cv2.COLORMAP_JET)
TypeError: Heatmap.__init__() got an unexpected keyword argument 'view_img'
when i tried to run this i got this error !
- Paula DerrengerUltralytics(изменено)
Hey there! 👋 It looks like you encountered an unexpected
view_imgargument error. I'm here to help!This happens because the
view_imgargument no longer exists in theHeatmapsolution; it was replaced byshow. Update your Ultralytics library and use the current arguments:heatmap = solutions.Heatmap(show=True, model="yolo26n-seg.pt", colormap=cv2.COLORMAP_JET)To update the library, run:
pip install ultralytics --upgradeThat should do the trick! Keep us posted if you run into any more issues or need further assistance. Happy coding! 🚀
I Tried upgrading the ultralytics also its giving same attribute error heatmap_obj = heatmap.Heatmap(imw=w, imh=h, heatmap_alpha=0.5, colormap=cv2.COLORMAP_JET) TypeError: Heatmap.init() got an unexpected keyword argument 'imw'
- Paula DerrengerUltralytics(изменено)
@Arjunpixel28 hi there! 👋 It seems there's a mix-up with the initialization arguments for the
Heatmapclass. You don't need to specifyimwandimh, because the frame size is taken from the frames you process. In current versions, initialize it like this:heatmap = solutions.Heatmap(model="yolo26n.pt", colormap=cv2.COLORMAP_JET, show=True) results = heatmap(frame) # annotated image is in results.plot_imSee the Heatmaps guide for the full list of arguments. This setup should work without errors. Should you face any more issues or have further questions, feel free to reach out! 🚀
Hi Paula Derrenger,
in the earlier response you had only given the parameters of imw and imh and now your saying it should not be used and even now its not working still have issue with that.
heatmap_obj = heatmap.Heatmap(colormap=cv2.COLORMAP_JET, heatmap_alpha=0.5) TypeError: Heatmap.init() got an unexpected keyword argument 'colormap'
I just asked a simple thing to apply heat map on instance segmentation since so many days you guys have not sloved that
- Paula DerrengerUltralytics(изменено)
@Arjunpixel28 hey there! I understand your concern and appreciate your patience. The
Heatmapsettings are now passed when you create the object (there is no separateset_args()), and the object is called directly on each frame, running tracking itself:import cv2 from ultralytics import solutions cap = cv2.VideoCapture("path/to/video.mp4") assert cap.isOpened(), "Error reading video file" # Settings such as colormap are set at initialization heatmap = solutions.Heatmap(model="yolo26n.pt", colormap=cv2.COLORMAP_PARULA) while cap.isOpened(): success, frame = cap.read() if not success: break results = heatmap(frame) cv2.imshow("Heatmap", results.plot_im) if cv2.waitKey(1) & 0xFF == ord("q"): break cap.release() cv2.destroyAllWindows()See the Heatmaps guide for all available arguments. If you encounter other issues, please let us know! 🚀
frame_with_heatmap = heatmap_obj.generate_heatmap(frame, tracks) File "/usr/local/lib/python3.10/dist-packages/ultralytics/solutions/heatmap.py", line 163, in generate_heatmap self.heatmap *= self.decay_factor # decay factor TypeError: unsupported operand type(s) for *=: 'NoneType' and 'float' and again i got this error Type error
- Paula DerrengerUltralytics(изменено)
@Arjunpixel28 hey there! 👋 It looks like you're encountering a TypeError related to the initialization of the
Heatmapobject. Sorry for the confusion caused by previous responses. TheHeatmapclass lives inultralytics.solutions(it is not importable fromultralyticsdirectly), and arguments such ascolormapandshoware passed when you create it. The object is then called on each frame:import cv2 from ultralytics import solutions cap = cv2.VideoCapture("path/to/your/video.mp4") assert cap.isOpened(), "Failed to open video." heatmap = solutions.Heatmap(model="yolo26n.pt", colormap=cv2.COLORMAP_JET) while True: ret, frame = cap.read() if not ret: break # Exit loop if no more frames results = heatmap(frame) # tracking and heatmap overlay in one call cv2.imshow("Heatmap Visual", results.plot_im) if cv2.waitKey(10) == ord("q"): break cap.release() cv2.destroyAllWindows()If you're still facing issues, check your Ultralytics version with
pip show ultralyticsand upgrade withpip install -U ultralytics. Thanks for your patience, and we're here to help get you through this! from ultralytics import YOLO, Heatmap ImportError: cannot import name 'Heatmap' from 'ultralytics' (/home/safepro/.local/lib/python3.10/site-packages/ultralytics/init.py)
- Paula DerrengerUltralytics(изменено)
Hey there! 🌟 It looks like you've encountered an import error when trying to use
Heatmapfrom theultralyticspackage.The heatmap functionality is part of the
ultralytics.solutionsmodule. The current import is:from ultralytics import solutions heatmap = solutions.Heatmap(model="yolo26n.pt", show=True)If
solutionsis not recognized, your installed version is likely too old. Update to the latest version using pip:pip install ultralytics --upgradeSee the Heatmaps guide for a full example. Thanks for your understanding, and feel free to reach out with any more questions! 🚀
hariouat
Hello everyone,
Please, how to generate heatmaps for classification model with yolov11?
Thanks in advance for your reply.
1@hariouat Hi, thanks for reaching out! At the moment, we don’t support heatmaps for the classification model. However, you can explore our heatmap implementation and adapt it to fit your specific requirements: https://github.com/ultralytics/ultralytics/blob/main/ultralytics/solutions/heatmap.py
Thank you!
- Glenn JocherUltralytics
Thank you for your question! Currently, heatmap generation in Ultralytics YOLO11 is supported for object detection tasks and not directly for classification models. If you're specifically looking to visualize classification results, you might need to adapt custom visualization techniques using libraries like Matplotlib or OpenCV. For more details on heatmap usage, visit the documentation.
hnyll
tips pls on how to generate heatmaps for single images with yolo11 model?
1also is it possible to choose what "class" or thing i want to create a heatmap of?
- Glenn JocherUltralytics(изменено)
@hnyll to generate a heatmap for a single image with a YOLO model, create the
Heatmapsolution with your model and call it on the image, then use the annotated result:import cv2 from ultralytics import solutions heatmap = solutions.Heatmap(model="yolo26n.pt", show=False) results = heatmap(cv2.imread("path/to/image.jpg")) cv2.imwrite("heatmap_result.jpg", results.plot_im)Heatmaps build up intensity over time, so a single image gives only a snapshot of the detected objects. To restrict it to specific classes, pass
classes=[...]when creatingHeatmap. For more details, please refer to the Ultralytics heatmap guide. thanks for the reply. i found out how to do heatmap on single images. i just wasnt looking carefully enough. do you happen to know where i can find more information about what the classes represent? im not sure that i could find it on the Ultralytics heatmap guide. for example what classes 12 and 18 when i do
heatmap = solutions.Heatmap( show=True, model="yolo11n.pt", colormap=cv2.COLORMAP_PARULA, classes=[12,18] )also is there any way that i can add a class by training a model or something? i wanted to create heatmaps on something that probably isnt in the list of classes in the pretrained yolo model.
- Glenn JocherUltralytics
For class information, you can refer to the dataset's YAML file used during training, which lists all class names. To add a new class, you'll need to retrain the model with a dataset that includes the new class.
Jaykhokhara
Have you ever tried tracking short video segments (for example, 10-minute chunks) from the same camera based on timestamps, and then combining the heatmaps using those timestamps — such as merging 6 chunks (10 minutes each) to create a 1-hour heatmap? I tried saving the heatmap data in JSON, but the file becomes very large and slow to load. Storing the data in .npy works, but using it at scale or in a larger platform isn’t very practical. Do we have any recommended approach or solution for this in Ultralytics?
- Glenn JocherUltralytics
Yes—rather than JSON, the scalable approach is to persist the underlying accumulated raster (
heatmap.heatmap, a NumPy array) and merge by summing arrays (same camera/resolution), then normalize/visualize once at the end; you can either keep a singlesolutions.Heatmapinstance alive across your 10‑minute chunks, or save/load the array between runs (see the Heatmaps guide and the Heatmap solution reference).import numpy as np import cv2 from ultralytics import solutions heatmap = solutions.Heatmap(model="yolo26n.pt", show=False, colormap=cv2.COLORMAP_PARULA) # ...process a 10-min chunk... # results = heatmap(im0) # call per-frame # save compactly (much smaller than JSON) np.savez_compressed("cam1_2026-01-18T1200Z.npz", heatmap=heatmap.heatmap.astype(np.float32)) # later: merge multiple chunks (1-hour heatmap) merged = None for f in ["cam1_2026-01-18T1200Z.npz", "cam1_2026-01-18T1210Z.npz", "cam1_2026-01-18T1220Z.npz"]: h = np.load(f)["heatmap"] merged = h if merged is None else (merged + h)If you share what “at scale” means for your platform (e.g., cloud object storage, DB constraints, expected camera count), reply here in this discussion with a bit more detail and we can suggest the best storage format (e.g., chunked
zarr/HDF5 vs compressednpz).
wisrovi
tendrias el video de ejemplo que has usado?
- Glenn JocherUltralytics
Los videos de ejemplo específicos mostrados en la documentación no están disponibles para descarga directa. Sin embargo, puedes usar cualquier video para probar la funcionalidad de heatmaps con YOLO11:
# Usar tu propio video
yolo solutions heatmap source="path/to/tu_video.mp4" show=True

# O usar videos de ejemplo disponibles públicamente
# Prueba con videos de tráfico, multitudes, o cualquier escena con movimiento
También puedes encontrar videos de prueba gratuitos en sitios como Pixabay o usar tu cámara web con
source=0para testing en tiempo real.
haiyuou
Is there a heatmap module compatible with YOLO v11 for image detection?
I am a beginner from China. If you are willing to answer my questions, please contact me via email. Thank you very much. 1636705028@qq.com
- Glenn JocherUltralytics
@haiyuou thanks for your interest in YOLO11! The current heatmap implementation is designed for video tracking applications, but you can adapt it for single image detection by using the same Heatmap solution with static images. Please continue the discussion here on GitHub rather than via email so the entire community can benefit from the solutions.
reigngers15
how to generate the heatmap visualization just for a specific image?
- Glenn JocherUltralytics(изменено)
@reigngers15 To generate a heatmap visualization for a specific image, you can adapt the solutions approach with a few modifications:
import cv2

from ultralytics import solutions

# Load your image
image = cv2.imread("path/to/your/image.jpg")

# Initialize heatmap object
heatmap = solutions.Heatmap(
    show=True,
    model="yolo26n.pt",
    colormap=cv2.COLORMAP_PARULA,
    # classes=[0, 2],  # Optional: specify classes for heatmap
)

# Process the image with the heatmap (runs the model internally)
results = heatmap(image)

# Display or save the result
cv2.imshow("Heatmap", results.plot_im)
cv2.waitKey(0)
cv2.imwrite("heatmap_result.jpg", results.plot_im)
Since heatmaps typically build up intensity over time across video frames, for a single image you'll get a snapshot visualization of detected objects. If you need more visualization control, you can find additional information in our heatmaps documentation.
how about in this code, can i add or change the size of heatmap?
Initialize heatmap object
heatmap = solutions.Heatmap( show=True, model=model, # Pass the model directly colormap=cv2.COLORMAP_PARULA, # classes=[0, 2], # Optional: specify classes for heatmap size=15 (if px) )
or is it possible to change it square instead of circle?
- Glenn JocherUltralytics
@reigngers15 Currently, the
Heatmapclass in YOLO11 doesn't have direct parameters for changing the size or shape of the heatmap points from circles to squares. The heatmap implementation uses a radius-based approach to create circular effects around detected objects.If you need to customize the size or shape of the heatmap, you would likely need to modify the
heatmap_effectmethod in the source code. This method is responsible for calculating the area of effect for each detection.Here's what you could potentially do:
-
For changing the size: You might need to fork the repository and modify the calculation in the
heatmap_effectmethod to adjust the radius used. -
For changing to a square shape: You would need to replace the circular distance calculation with a square boundary check.
For advanced customizations like these, I recommend checking out the source code in the ultralytics/solutions/heatmap.py file and making your own modified version.
If you need further guidance on specific implementation details, feel free to ask!
1 -
fangyuZ1025
That just track task , if i want do some detect, classify,segement task? how can i modify the code?
- Glenn JocherUltralytics(изменено)
@fangyuZ1025 the
Heatmapsolution accumulates the locations of tracked objects, so it needs a model that outputs bounding boxes: a detection model (for exampleyolo26n.pt) or a segmentation model (for exampleyolo26n-seg.pt), which you pass asmodel=when you createsolutions.Heatmap(...). Classification models (-cls) produce no object locations, so a heatmap can't be built from them. Refer to the Heatmaps guide for detailed examples and configurations. Let me know if you need further clarification! Sorry, I think I didn't express what I meant. I am working on the heat map of yolov8 to explain the interpretability of the model. This code is doing the heat map of the video tracking task, and I want to implement my image heat map feature detection based on it. I wonder if there is any relevant code. Thanks again for your reply
- Glenn JocherUltralytics(изменено)
Thank you for clarifying! To produce a heatmap for static images, you can use the same
Heatmapsolution and call it on an image:results = heatmap(image)returns a results object with the overlay inresults.plot_im. Note thatgenerate_heatmapno longer exists. For further guidance, refer to theheatmap.pyimplementation. Let us know if you need further assistance!
Halibo01
Hello, I'm trying to apply a heatmap using a classification model in YOLOv8, but I'm encountering an issue. The error message I receive is: 'AttributeError: 'NoneType' object has no attribute 'cpu'. Is there a known solution to this?
- Glenn JocherUltralytics
@Halibo01 it seems like the error might be due to an issue with the tracking results. Please ensure you are using the latest version of the Ultralytics package. If the issue persists, double-check that the model and input data are correctly loaded and processed. For more detailed guidance, refer to the Heatmaps Guide.
- Glenn JocherUltralytics
@Halibo01 it looks like you're encountering an issue with the classification model in YOLOv8. The error 'AttributeError: 'NoneType' object has no attribute 'cpu'' typically indicates that a variable expected to hold a tensor is actually
None. Please ensure that your model's output is correctly assigned and notNonebefore calling.cpu(). Additionally, verify that you are using the latest version of the Ultralytics package. For further details on heatmaps, you can refer to the Ultralytics Heatmaps Guide.