Ultralytics YOLO26을 사용한 객체 추적 히트맵

Ultralytics YOLO26의 히트맵 솔루션은 비디오 프레임 전반에서 객체를 추적하고 누적된 이동 강도를 각 프레임에 오버레이하므로, 이동이 많은 영역은 따뜻한 색상으로 밝게 표시되고 한산한 영역은 차가운 색상으로 유지됩니다. YOLO26 객체 추적을 기반으로 하는 이 솔루션은 단 한 번의 Python 호출 또는 CLI 명령으로 모든 비디오를 교통 흐름, 군중 이동 및 체류 구역을 보여주는 공간 활동 맵으로 변환합니다.
시청: Ultralytics YOLO26으로 히트맵을 만드는 방법 | 객체 활동 시각화 | 소매 분야 VisionAI 🚀
비디오 분석에 히트맵을 사용하는 이유#
- 활동 패턴을 한눈에 파악: 추적된 객체가 머무는 곳마다 강도가 누적되므로, 프레임을 일일이 검토하지 않아도 교통량이 많은 차선, 인기 상품 진열대 또는 군중이 몰리는 병목 구간을 파악할 수 있습니다.
- 추적 기능 내장: 솔루션이 내부적으로 YOLO26 감지 및 추적을 실행하므로 별도의 추적 파이프라인을 구성할 필요가 없습니다.
- 한 번의 실행으로 계수:
region을 전달하면 히트맵을 생성하는 동안 구역에 들어오고 나가는 객체를 계수하여 두 가지 분석 작업을 한 번에 수행할 수 있습니다.
실제 적용 사례#
| 교통 | 소매 |
|---|---|
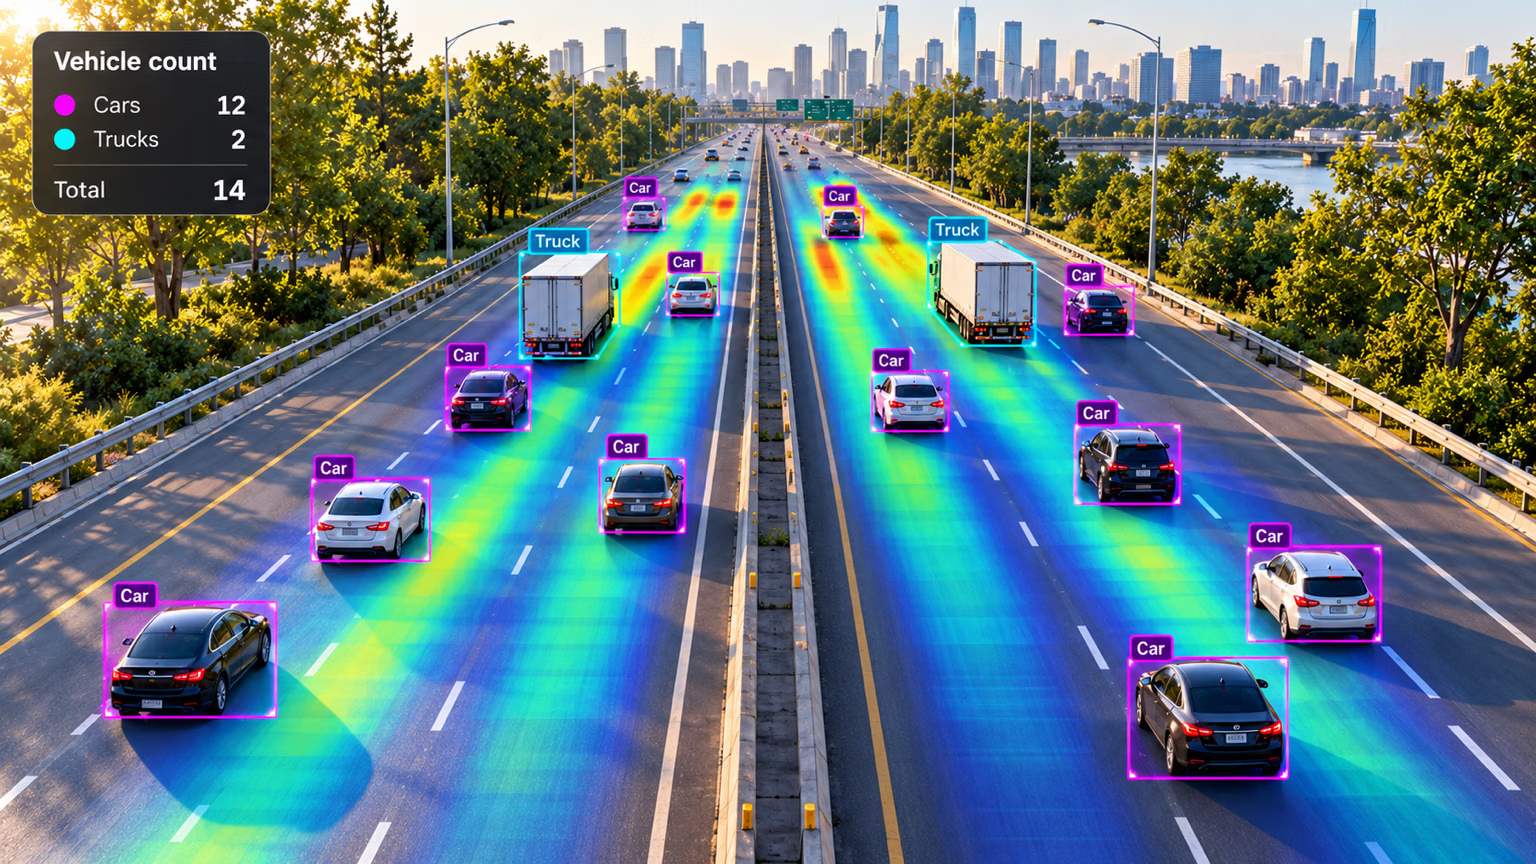 | 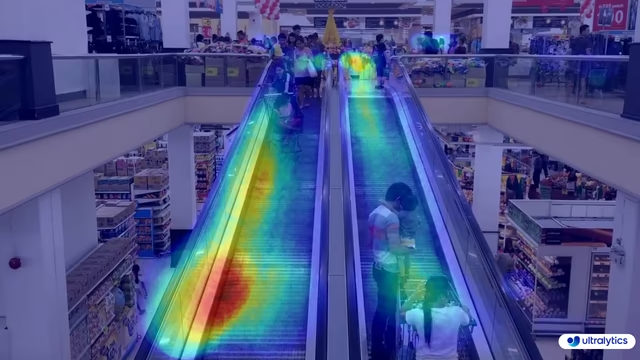 |
| Ultralytics YOLO 교통 히트맵 | Ultralytics YOLO 리테일 히트맵 |
Ultralytics YOLO로 히트맵 생성하기#
CLI 또는 Python에서 비디오 소스를 사용해 히트맵 솔루션을 실행합니다. Python 예제는 처리된 프레임을 출력 비디오 파일에 저장합니다:
# Run a heatmap example
yolo solutions heatmap show=True

# Pass a source video
yolo solutions heatmap source="path/to/video.mp4"

# Pass a custom colormap
yolo solutions heatmap colormap=cv2.COLORMAP_INFERNO

# Heatmaps + object counting
yolo solutions heatmap region="[(20, 400), (1080, 400), (1080, 360), (20, 360)]"
Heatmap() 인수#
다음은 Heatmap 인수 표입니다:
| 인수 | 유형 | 기본값 | 설명 |
|---|---|---|---|
model | str | None | Ultralytics YOLO 모델 파일의 경로입니다. |
colormap | int | cv2.COLORMAP_DEEPGREEN | 히트맵에 사용할 컬러맵입니다. |
show_in | bool | True | 비디오 스트림에 진입 수를 표시할지 제어하는 플래그입니다. |
show_out | bool | True | 비디오 스트림에 이탈 수를 표시할지 제어하는 플래그입니다. |
region | list 또는 dict | None | 관심 영역을 정의하는 점입니다. (x, y) 튜플 목록 또는 여러 영역에 대해 영역 이름을 점 목록에 매핑하는 사전(RegionCounter만 해당)으로 지정할 수 있습니다. None이면 영역이 필요한 Solutions는 사전 정의된 기본값을 사용합니다. |
line_width | int | 2 | Solution에서 그리는 상자, 키포인트 및 개수 표시의 선 두께입니다. |
verbose | bool | True | 프레임별 입력 형태, 클래스 개수 및 처리 속도 로그를 활성화합니다. 추적 호출 자체는 항상 로그를 출력하지 않습니다. |
Heatmap 솔루션에서 다양한 track 인수를 적용할 수도 있습니다.
| 인수 | 유형 | 기본값 | 설명 |
|---|---|---|---|
tracker | str | 'tracktrack.yaml' | 사용할 추적 알고리즘을 지정합니다. 기본 제공 옵션: botsort.yaml, bytetrack.yaml, ocsort.yaml, deepocsort.yaml, fasttrack.yaml, tracktrack.yaml. |
conf | float | 0.25 | 탐지에 대한 신뢰도 임계값을 설정합니다. 값을 낮추면 추적할 수 있는 객체가 늘어나지만 오탐이 포함될 수 있습니다. |
iou | float | 0.5 | 중복 탐지를 필터링하기 위한 교집합 대비 합집합 (IoU) 임계값을 설정합니다. |
classes | list | None | 클래스 인덱스로 결과를 필터링합니다. 예를 들어 classes=[0, 2, 3]은 지정된 클래스만 추적합니다. |
device | str | None | 추론에 사용할 장치를 지정합니다(예: cpu, cuda:0 또는 0). 사용자는 모델 실행에 사용할 CPU, 특정 GPU 또는 기타 연산 장치를 선택할 수 있습니다. |
imgsz | int or tuple | 640 | 추론 대상 이미지 크기입니다. 정사각형을 나타내는 정수 또는 (height, width) 쌍을 지정합니다. 모델 stride에 맞춰 형태가 조정됩니다. |
max_det | int | 300 | 추적 전에 프레임별로 유지할 최대 탐지 수를 지정하여 밀집된 장면에서 솔루션이 처리하는 객체 수를 제한합니다. |
quantize | int or str | None | 추론 정밀도: CPU 이외의 환경에서 PyTorch 및 TorchScript 모델은 16(FP16) 또는 32/unset(FP32)을 사용하며, 다른 형식은 아티팩트와 런타임이 선택하는 정밀도를 사용합니다. 더 이상 사용되지 않는 half 인수를 대체합니다. |
또한 지원되는 시각화 인수는 다음과 같습니다:
| 인수 | 유형 | 기본값 | 설명 |
|---|---|---|---|
show | bool | False | True이면 주석이 추가된 이미지나 비디오를 창에 표시합니다. 개발 또는 테스트 중 즉각적인 시각적 피드백을 얻는 데 유용합니다. |
show_conf | bool | True | 각 감지 결과의 레이블 옆에 신뢰도 점수를 표시합니다. 각 감지 결과에 대한 모델의 확신도를 파악할 수 있습니다. |
show_labels | bool | True | 시각화 출력에 각 감지 결과의 레이블을 표시합니다. 감지된 객체를 즉시 파악할 수 있습니다. |
히트맵 컬러맵#
colormap 인수는 모든 OpenCV 컬러맵을 사용할 수 있습니다. 예를 들어 cv2 모듈의 상수인 colormap=cv2.COLORMAP_INFERNO을 전달합니다:
| 컬러맵 이름 | 설명 |
|---|---|
cv2.COLORMAP_AUTUMN | 가을 컬러맵 |
cv2.COLORMAP_BONE | 본 컬러맵 |
cv2.COLORMAP_JET | Jet 컬러맵 |
cv2.COLORMAP_WINTER | Winter 컬러맵 |
cv2.COLORMAP_RAINBOW | Rainbow 컬러맵 |
cv2.COLORMAP_OCEAN | Ocean 컬러맵 |
cv2.COLORMAP_SUMMER | Summer 컬러맵 |
cv2.COLORMAP_SPRING | Spring 컬러맵 |
cv2.COLORMAP_COOL | Cool 컬러맵 |
cv2.COLORMAP_HSV | HSV (색조, 채도, 명도) 컬러맵 |
cv2.COLORMAP_PINK | Pink 컬러맵 |
cv2.COLORMAP_HOT | Hot 컬러맵 |
cv2.COLORMAP_PARULA | Parula 컬러맵 |
cv2.COLORMAP_MAGMA | Magma 컬러맵 |
cv2.COLORMAP_INFERNO | Inferno 컬러맵 |
cv2.COLORMAP_PLASMA | Plasma 컬러맵 |
cv2.COLORMAP_VIRIDIS | Viridis 컬러맵 |
cv2.COLORMAP_CIVIDIS | Cividis 컬러맵 |
cv2.COLORMAP_TWILIGHT | Twilight 컬러맵 |
cv2.COLORMAP_TWILIGHT_SHIFTED | Shifted Twilight 컬러맵 |
cv2.COLORMAP_TURBO | Turbo 컬러맵 |
cv2.COLORMAP_DEEPGREEN | Deep Green 컬러맵 |
히트맵 작동 방식#
히트맵 솔루션은 ObjectCounter 클래스를 확장합니다. 처음 처리되는 프레임에서 프레임 크기에 맞는 빈 강도 레이어를 생성합니다. 그런 다음 각 프레임을 두 단계로 처리합니다.
- YOLO26 추적은 프레임에 있는 모든 객체를 감지하고 추적합니다.
- 추적되는 각 객체의 경계 상자 중앙을 중심으로 한 원형 영역 내에서 히트맵 강도가 증가합니다.
프레임마다 누적된 강도 레이어를 정규화하고, 선택한 컬러맵을 적용한 다음, 원본 프레임과 블렌딩합니다. 객체를 하나 이상 추적하면 오버레이가 표시되며, 그전까지는 히트맵 오버레이 없이 프레임이 표시됩니다.
그 결과 시간이 지날수록 구축되는 동적 시각화가 생성되어 비디오 데이터의 교통 패턴, 군중 이동 또는 기타 공간적 행동을 보여줍니다. region을 설정하면 히트맵을 구축하는 동안 해당 영역에 들어오고 나가는 객체도 계수합니다.
결론#
Ultralytics YOLO26 Heatmap 솔루션은 몇 줄의 코드만으로 객체 추적 결과를 직관적인 활동 오버레이로 변환합니다. 더 확장하려면 객체 계수와 결합하거나, 다른 Ultralytics 솔루션을 살펴보거나, 기반이 되는 추적 모드에 대해 알아보세요.
자주 묻는 질문#
Ultralytics YOLO26은 비디오 프레임 전체에서 객체를 추적하고 추적된 각 객체의 위치에 강도 값을 누적한 다음, 결과에 컬러를 적용해 원본 프레임과 블렌딩하여 히트맵을 생성합니다. 객체가 자주 나타나거나 오래 머무는 영역은 강도가 높아지고 더 따뜻한 색상으로 렌더링됩니다. 구성 옵션은
Heatmap()인수 섹션을 참조하세요.기본 예제에 나온 것처럼 OpenCV의
cv2.VideoWriter을 사용하고 처리된 각 프레임에results.plot_im을 기록하세요.plot_im속성에는 히트맵 오버레이가 이미 적용된 프레임이 저장됩니다.네. 선, 직사각형 또는 다각형 점을 지정한
region인수를Heatmap()에 전달하면, 히트맵을 구축하는 동안 솔루션이 해당 영역에 들어오고 나가는 객체를 계수합니다. 반환되는 결과에는in_count,out_count및 클래스별 계수가 포함됩니다. 영역 구성에 관한 자세한 내용은 객체 계수 가이드를 참조하세요.유지할 클래스 인덱스를 지정하여
classes인수를Heatmap()에 전달하세요. 예를 들어classes=[0, 2]는 사람과 자동차(COCO 클래스 인덱스 0 및 2)만 사용해 히트맵을 구축합니다.import cv2 from ultralytics import solutions cap = cv2.VideoCapture("path/to/video.mp4") heatmap = solutions.Heatmap(show=True, model="yolo26n.pt", classes=[0, 2]) while cap.isOpened(): success, im0 = cap.read() if not success: break results = heatmap(im0) cap.release() cv2.destroyAllWindows()


댓글65
질문을 하거나 결과를 공유하거나 다른 사람을 도와주세요.
RizwanMunawar
🎉 Big News Alert! 🚀 Ultralytics Solutions CLI is here from ultralytics>=8.3.28! Now, you can easily harness the power of advanced YOLO solutions straight from the command line. Simplify your workflow, and streamline object detection, tracking, counting, and more—all with just a few commands! Get ready to experience a whole new level of efficiency! 💥
CLI Usage Overview
yolo SOLUTIONS SOLUTION_NAME ARGS- SOLUTIONS is a mandatory keyword.
- SOLUTION_NAME (optional): Choose from ['count', 'heatmap', 'queue', 'speed', 'workout', 'analytics'].
- ARGS (optional): Use custom
arg=valuepairs, likeshow_in=True, to customize settings.
Examples
yolo solutions heatmap show=True  # For object counting

yolo solutions heatmap source="path/to/video/file.mp4"  # Specify a video file path
Start exploring now and let Ultralytics Solutions CLI power up your projects!
4Arjunpixel28
Has any one applied heatmap on instance segmentation ?
2 Glenn JocherUltralytics(수정됨)
Yes, applying heatmaps to instance segmentation is feasible and offers a vivid way to visualize the density and distribution of detected objects across video frames 🌈. The
Heatmapsolution runs tracking itself with whatever model you give it, including a segmentation model, and accumulates intensity around each tracked object's bounding box (the masks themselves are not used). Here's a simplified example:import cv2 from ultralytics import solutions cap = cv2.VideoCapture("path/to/video.mp4") assert cap.isOpened(), "Failed to open video file or stream!" w, h, fps = (int(cap.get(x)) for x in (cv2.CAP_PROP_FRAME_WIDTH, cv2.CAP_PROP_FRAME_HEIGHT, cv2.CAP_PROP_FPS)) video_writer = cv2.VideoWriter("heatmap_output.avi", cv2.VideoWriter_fourcc(*"mp4v"), fps, (w, h)) # Initialize your heatmap object with a segmentation model heatmap = solutions.Heatmap(show=True, model="yolo26n-seg.pt", colormap=cv2.COLORMAP_PARULA) # Process video frames while cap.isOpened(): success, frame = cap.read() if not success: break # Exit loop if no more frames results = heatmap(frame) video_writer.write(results.plot_im) cap.release() video_writer.release() cv2.destroyAllWindows()This snippet performs tracking with an instance segmentation model on video frames and overlays the accumulated heatmap. Remember, the success of applying heatmaps heavily relies on the quality of your model, so ensure it has been adequately trained or fine-tuned for your instance segmentation task. Happy visualizing! 🚀
 Paula DerrengerUltralytics(수정됨)
Yes, applying heatmaps to instance segmentation is feasible and offers a vivid way to visualize the density and distribution of detected objects across video frames 🌈. The
Heatmapsolution tracks objects with the model you provide, including a segmentation model, and overlays the accumulated activity on each frame. It builds the heatmap from the tracked objects' bounding boxes rather than the masks.Here's a simplified example:
import cv2

from ultralytics import solutions

# Initialize video capture
cap = cv2.VideoCapture("path/to/your/video.mp4")
assert cap.isOpened(), "Error reading video file"

# Video writer setup
w, h, fps = (int(cap.get(x)) for x in (cv2.CAP_PROP_FRAME_WIDTH, cv2.CAP_PROP_FRAME_HEIGHT, cv2.CAP_PROP_FPS))
video_writer = cv2.VideoWriter("segmentation_heatmap.avi", cv2.VideoWriter_fourcc(*"mp4v"), fps, (w, h))

# Initialize heatmap with a segmentation model
heatmap = solutions.Heatmap(show=True, model="yolo26n-seg.pt", colormap=cv2.COLORMAP_JET)

while cap.isOpened():
    success, im0 = cap.read()
    if not success:
        break

    # Track objects and generate the heatmap overlay
    results = heatmap(im0)

    # Write heatmap output
    video_writer.write(results.plot_im)

# Cleanup
cap.release()
video_writer.release()
cv2.destroyAllWindows()
Feel free to experiment with different configurations, such as
colormap, to meet your specific visualization needs. Happy coding! 🚀Hi ,
heatmap_obj = heatmap.Heatmap(view_img=False, imw=w, imh=h, heatmap_alpha=0.5, colormap=cv2.COLORMAP_JET)
TypeError: Heatmap.__init__() got an unexpected keyword argument 'view_img'
when i tried to run this i got this error !
- Paula DerrengerUltralytics(수정됨)
Hey there! 👋 It looks like you encountered an unexpected
view_imgargument error. I'm here to help!This happens because the
view_imgargument no longer exists in theHeatmapsolution; it was replaced byshow. Update your Ultralytics library and use the current arguments:heatmap = solutions.Heatmap(show=True, model="yolo26n-seg.pt", colormap=cv2.COLORMAP_JET)To update the library, run:
pip install ultralytics --upgradeThat should do the trick! Keep us posted if you run into any more issues or need further assistance. Happy coding! 🚀
I Tried upgrading the ultralytics also its giving same attribute error heatmap_obj = heatmap.Heatmap(imw=w, imh=h, heatmap_alpha=0.5, colormap=cv2.COLORMAP_JET) TypeError: Heatmap.init() got an unexpected keyword argument 'imw'
- Paula DerrengerUltralytics(수정됨)
@Arjunpixel28 hi there! 👋 It seems there's a mix-up with the initialization arguments for the
Heatmapclass. You don't need to specifyimwandimh, because the frame size is taken from the frames you process. In current versions, initialize it like this:heatmap = solutions.Heatmap(model="yolo26n.pt", colormap=cv2.COLORMAP_JET, show=True) results = heatmap(frame) # annotated image is in results.plot_imSee the Heatmaps guide for the full list of arguments. This setup should work without errors. Should you face any more issues or have further questions, feel free to reach out! 🚀
Hi Paula Derrenger,
in the earlier response you had only given the parameters of imw and imh and now your saying it should not be used and even now its not working still have issue with that.
heatmap_obj = heatmap.Heatmap(colormap=cv2.COLORMAP_JET, heatmap_alpha=0.5) TypeError: Heatmap.init() got an unexpected keyword argument 'colormap'
I just asked a simple thing to apply heat map on instance segmentation since so many days you guys have not sloved that
- Paula DerrengerUltralytics(수정됨)
@Arjunpixel28 hey there! I understand your concern and appreciate your patience. The
Heatmapsettings are now passed when you create the object (there is no separateset_args()), and the object is called directly on each frame, running tracking itself:import cv2 from ultralytics import solutions cap = cv2.VideoCapture("path/to/video.mp4") assert cap.isOpened(), "Error reading video file" # Settings such as colormap are set at initialization heatmap = solutions.Heatmap(model="yolo26n.pt", colormap=cv2.COLORMAP_PARULA) while cap.isOpened(): success, frame = cap.read() if not success: break results = heatmap(frame) cv2.imshow("Heatmap", results.plot_im) if cv2.waitKey(1) & 0xFF == ord("q"): break cap.release() cv2.destroyAllWindows()See the Heatmaps guide for all available arguments. If you encounter other issues, please let us know! 🚀
frame_with_heatmap = heatmap_obj.generate_heatmap(frame, tracks) File "/usr/local/lib/python3.10/dist-packages/ultralytics/solutions/heatmap.py", line 163, in generate_heatmap self.heatmap *= self.decay_factor # decay factor TypeError: unsupported operand type(s) for *=: 'NoneType' and 'float' and again i got this error Type error
- Paula DerrengerUltralytics(수정됨)
@Arjunpixel28 hey there! 👋 It looks like you're encountering a TypeError related to the initialization of the
Heatmapobject. Sorry for the confusion caused by previous responses. TheHeatmapclass lives inultralytics.solutions(it is not importable fromultralyticsdirectly), and arguments such ascolormapandshoware passed when you create it. The object is then called on each frame:import cv2 from ultralytics import solutions cap = cv2.VideoCapture("path/to/your/video.mp4") assert cap.isOpened(), "Failed to open video." heatmap = solutions.Heatmap(model="yolo26n.pt", colormap=cv2.COLORMAP_JET) while True: ret, frame = cap.read() if not ret: break # Exit loop if no more frames results = heatmap(frame) # tracking and heatmap overlay in one call cv2.imshow("Heatmap Visual", results.plot_im) if cv2.waitKey(10) == ord("q"): break cap.release() cv2.destroyAllWindows()If you're still facing issues, check your Ultralytics version with
pip show ultralyticsand upgrade withpip install -U ultralytics. Thanks for your patience, and we're here to help get you through this! from ultralytics import YOLO, Heatmap ImportError: cannot import name 'Heatmap' from 'ultralytics' (/home/safepro/.local/lib/python3.10/site-packages/ultralytics/init.py)
- Paula DerrengerUltralytics(수정됨)
Hey there! 🌟 It looks like you've encountered an import error when trying to use
Heatmapfrom theultralyticspackage.The heatmap functionality is part of the
ultralytics.solutionsmodule. The current import is:from ultralytics import solutions heatmap = solutions.Heatmap(model="yolo26n.pt", show=True)If
solutionsis not recognized, your installed version is likely too old. Update to the latest version using pip:pip install ultralytics --upgradeSee the Heatmaps guide for a full example. Thanks for your understanding, and feel free to reach out with any more questions! 🚀
hariouat
Hello everyone,
Please, how to generate heatmaps for classification model with yolov11?
Thanks in advance for your reply.
1@hariouat Hi, thanks for reaching out! At the moment, we don’t support heatmaps for the classification model. However, you can explore our heatmap implementation and adapt it to fit your specific requirements: https://github.com/ultralytics/ultralytics/blob/main/ultralytics/solutions/heatmap.py
Thank you!
- Glenn JocherUltralytics
Thank you for your question! Currently, heatmap generation in Ultralytics YOLO11 is supported for object detection tasks and not directly for classification models. If you're specifically looking to visualize classification results, you might need to adapt custom visualization techniques using libraries like Matplotlib or OpenCV. For more details on heatmap usage, visit the documentation.
hnyll
tips pls on how to generate heatmaps for single images with yolo11 model?
1also is it possible to choose what "class" or thing i want to create a heatmap of?
- Glenn JocherUltralytics(수정됨)
@hnyll to generate a heatmap for a single image with a YOLO model, create the
Heatmapsolution with your model and call it on the image, then use the annotated result:import cv2 from ultralytics import solutions heatmap = solutions.Heatmap(model="yolo26n.pt", show=False) results = heatmap(cv2.imread("path/to/image.jpg")) cv2.imwrite("heatmap_result.jpg", results.plot_im)Heatmaps build up intensity over time, so a single image gives only a snapshot of the detected objects. To restrict it to specific classes, pass
classes=[...]when creatingHeatmap. For more details, please refer to the Ultralytics heatmap guide. thanks for the reply. i found out how to do heatmap on single images. i just wasnt looking carefully enough. do you happen to know where i can find more information about what the classes represent? im not sure that i could find it on the Ultralytics heatmap guide. for example what classes 12 and 18 when i do
heatmap = solutions.Heatmap( show=True, model="yolo11n.pt", colormap=cv2.COLORMAP_PARULA, classes=[12,18] )also is there any way that i can add a class by training a model or something? i wanted to create heatmaps on something that probably isnt in the list of classes in the pretrained yolo model.
- Glenn JocherUltralytics
For class information, you can refer to the dataset's YAML file used during training, which lists all class names. To add a new class, you'll need to retrain the model with a dataset that includes the new class.
Jaykhokhara
Have you ever tried tracking short video segments (for example, 10-minute chunks) from the same camera based on timestamps, and then combining the heatmaps using those timestamps — such as merging 6 chunks (10 minutes each) to create a 1-hour heatmap? I tried saving the heatmap data in JSON, but the file becomes very large and slow to load. Storing the data in .npy works, but using it at scale or in a larger platform isn’t very practical. Do we have any recommended approach or solution for this in Ultralytics?
- Glenn JocherUltralytics
Yes—rather than JSON, the scalable approach is to persist the underlying accumulated raster (
heatmap.heatmap, a NumPy array) and merge by summing arrays (same camera/resolution), then normalize/visualize once at the end; you can either keep a singlesolutions.Heatmapinstance alive across your 10‑minute chunks, or save/load the array between runs (see the Heatmaps guide and the Heatmap solution reference).import numpy as np import cv2 from ultralytics import solutions heatmap = solutions.Heatmap(model="yolo26n.pt", show=False, colormap=cv2.COLORMAP_PARULA) # ...process a 10-min chunk... # results = heatmap(im0) # call per-frame # save compactly (much smaller than JSON) np.savez_compressed("cam1_2026-01-18T1200Z.npz", heatmap=heatmap.heatmap.astype(np.float32)) # later: merge multiple chunks (1-hour heatmap) merged = None for f in ["cam1_2026-01-18T1200Z.npz", "cam1_2026-01-18T1210Z.npz", "cam1_2026-01-18T1220Z.npz"]: h = np.load(f)["heatmap"] merged = h if merged is None else (merged + h)If you share what “at scale” means for your platform (e.g., cloud object storage, DB constraints, expected camera count), reply here in this discussion with a bit more detail and we can suggest the best storage format (e.g., chunked
zarr/HDF5 vs compressednpz).
wisrovi
tendrias el video de ejemplo que has usado?
- Glenn JocherUltralytics
Los videos de ejemplo específicos mostrados en la documentación no están disponibles para descarga directa. Sin embargo, puedes usar cualquier video para probar la funcionalidad de heatmaps con YOLO11:
# Usar tu propio video
yolo solutions heatmap source="path/to/tu_video.mp4" show=True

# O usar videos de ejemplo disponibles públicamente
# Prueba con videos de tráfico, multitudes, o cualquier escena con movimiento
También puedes encontrar videos de prueba gratuitos en sitios como Pixabay o usar tu cámara web con
source=0para testing en tiempo real.
haiyuou
Is there a heatmap module compatible with YOLO v11 for image detection?
I am a beginner from China. If you are willing to answer my questions, please contact me via email. Thank you very much. 1636705028@qq.com
- Glenn JocherUltralytics
@haiyuou thanks for your interest in YOLO11! The current heatmap implementation is designed for video tracking applications, but you can adapt it for single image detection by using the same Heatmap solution with static images. Please continue the discussion here on GitHub rather than via email so the entire community can benefit from the solutions.
reigngers15
how to generate the heatmap visualization just for a specific image?
- Glenn JocherUltralytics(수정됨)
@reigngers15 To generate a heatmap visualization for a specific image, you can adapt the solutions approach with a few modifications:
import cv2

from ultralytics import solutions

# Load your image
image = cv2.imread("path/to/your/image.jpg")

# Initialize heatmap object
heatmap = solutions.Heatmap(
    show=True,
    model="yolo26n.pt",
    colormap=cv2.COLORMAP_PARULA,
    # classes=[0, 2],  # Optional: specify classes for heatmap
)

# Process the image with the heatmap (runs the model internally)
results = heatmap(image)

# Display or save the result
cv2.imshow("Heatmap", results.plot_im)
cv2.waitKey(0)
cv2.imwrite("heatmap_result.jpg", results.plot_im)
Since heatmaps typically build up intensity over time across video frames, for a single image you'll get a snapshot visualization of detected objects. If you need more visualization control, you can find additional information in our heatmaps documentation.
how about in this code, can i add or change the size of heatmap?
Initialize heatmap object
heatmap = solutions.Heatmap( show=True, model=model, # Pass the model directly colormap=cv2.COLORMAP_PARULA, # classes=[0, 2], # Optional: specify classes for heatmap size=15 (if px) )
or is it possible to change it square instead of circle?
- Glenn JocherUltralytics
@reigngers15 Currently, the
Heatmapclass in YOLO11 doesn't have direct parameters for changing the size or shape of the heatmap points from circles to squares. The heatmap implementation uses a radius-based approach to create circular effects around detected objects.If you need to customize the size or shape of the heatmap, you would likely need to modify the
heatmap_effectmethod in the source code. This method is responsible for calculating the area of effect for each detection.Here's what you could potentially do:
-
For changing the size: You might need to fork the repository and modify the calculation in the
heatmap_effectmethod to adjust the radius used. -
For changing to a square shape: You would need to replace the circular distance calculation with a square boundary check.
For advanced customizations like these, I recommend checking out the source code in the ultralytics/solutions/heatmap.py file and making your own modified version.
If you need further guidance on specific implementation details, feel free to ask!
1 -
fangyuZ1025
That just track task , if i want do some detect, classify,segement task? how can i modify the code?
- Glenn JocherUltralytics(수정됨)
@fangyuZ1025 the
Heatmapsolution accumulates the locations of tracked objects, so it needs a model that outputs bounding boxes: a detection model (for exampleyolo26n.pt) or a segmentation model (for exampleyolo26n-seg.pt), which you pass asmodel=when you createsolutions.Heatmap(...). Classification models (-cls) produce no object locations, so a heatmap can't be built from them. Refer to the Heatmaps guide for detailed examples and configurations. Let me know if you need further clarification! Sorry, I think I didn't express what I meant. I am working on the heat map of yolov8 to explain the interpretability of the model. This code is doing the heat map of the video tracking task, and I want to implement my image heat map feature detection based on it. I wonder if there is any relevant code. Thanks again for your reply
- Glenn JocherUltralytics(수정됨)
Thank you for clarifying! To produce a heatmap for static images, you can use the same
Heatmapsolution and call it on an image:results = heatmap(image)returns a results object with the overlay inresults.plot_im. Note thatgenerate_heatmapno longer exists. For further guidance, refer to theheatmap.pyimplementation. Let us know if you need further assistance!
Halibo01
Hello, I'm trying to apply a heatmap using a classification model in YOLOv8, but I'm encountering an issue. The error message I receive is: 'AttributeError: 'NoneType' object has no attribute 'cpu'. Is there a known solution to this?
- Glenn JocherUltralytics
@Halibo01 it seems like the error might be due to an issue with the tracking results. Please ensure you are using the latest version of the Ultralytics package. If the issue persists, double-check that the model and input data are correctly loaded and processed. For more detailed guidance, refer to the Heatmaps Guide.
- Glenn JocherUltralytics
@Halibo01 it looks like you're encountering an issue with the classification model in YOLOv8. The error 'AttributeError: 'NoneType' object has no attribute 'cpu'' typically indicates that a variable expected to hold a tensor is actually
None. Please ensure that your model's output is correctly assigned and notNonebefore calling.cpu(). Additionally, verify that you are using the latest version of the Ultralytics package. For further details on heatmaps, you can refer to the Ultralytics Heatmaps Guide.