Deployment#
Ultralytics Platform provides comprehensive model deployment options for putting your YOLO models into production. Test models with browser-based inference, deploy to dedicated endpoints across 42 global regions, and monitor performance in real-time.
Watch: Get Started with Ultralytics Platform - Deploy
Overview#
The Deployment section helps you:
- Test models directly in the browser with the
Predicttab - Deploy to dedicated endpoints in 42 global regions
- Monitor request metrics, logs, health checks, and temporary predictions on every dedicated endpoint
- Choose resources: default endpoints scale to zero; custom sizes keep a warm instance with uptime billing
Deployment Options#
Ultralytics Platform offers multiple deployment paths:
| Option | Description | Best For |
|---|---|---|
| Predict Tab | Image, webcam, examples; IP camera on own endpoints | Development, validation |
| Shared Inference | Multi-tenant service across 3 data regions | Light usage, testing |
| Dedicated Endpoints | Single-tenant services across 42 regions | Production, low latency |
| Export | Download weights in 22 formats for local or edge runtime | Offline, on-device |
Workflow#
| Stage | Description |
|---|---|
| Test | Validate model with the Predict tab |
| Configure | Select a model, region, CPU, and memory; review pricing and the deployment name |
| Deploy | Create a dedicated endpoint from the Deploy tab |
| Monitor | Inspect endpoint metrics and temporary predictions in Monitoring |
Architecture#
Shared Inference#
The shared inference service runs in 3 key regions. Requests to a model are routed to the service in that model's data region, so results stay inside the region where the model is stored:
| Region | Label | Location | Best For |
|---|---|---|---|
| US | Americas | Iowa, USA | Americas users, fastest for Americas |
| EU | Europe, Middle East & Africa | Belgium, Europe | European users, GDPR compliance |
| AP | Asia Pacific | Taiwan, Asia-Pacific | Asia-Pacific users, lowest APAC latency |
Dedicated Endpoints#
Deploy to 42 regions worldwide on Ultralytics Cloud:
- Americas: 14 regions
- Europe: 13 regions
- Asia-Pacific: 12 regions
- Middle East & Africa: 3 regions
Each endpoint is a single-tenant service with:
- Configurable CPU and memory with pricing shown before deployment
- Scale-to-zero for default resources; a warm, uptime-billed instance for custom resources
- Unique endpoint URL with its own interactive API reference at
/docs - Its own API key binding, so only that key can call the endpoint
- Independent monitoring, logs, and health checks
Deployments Tab#
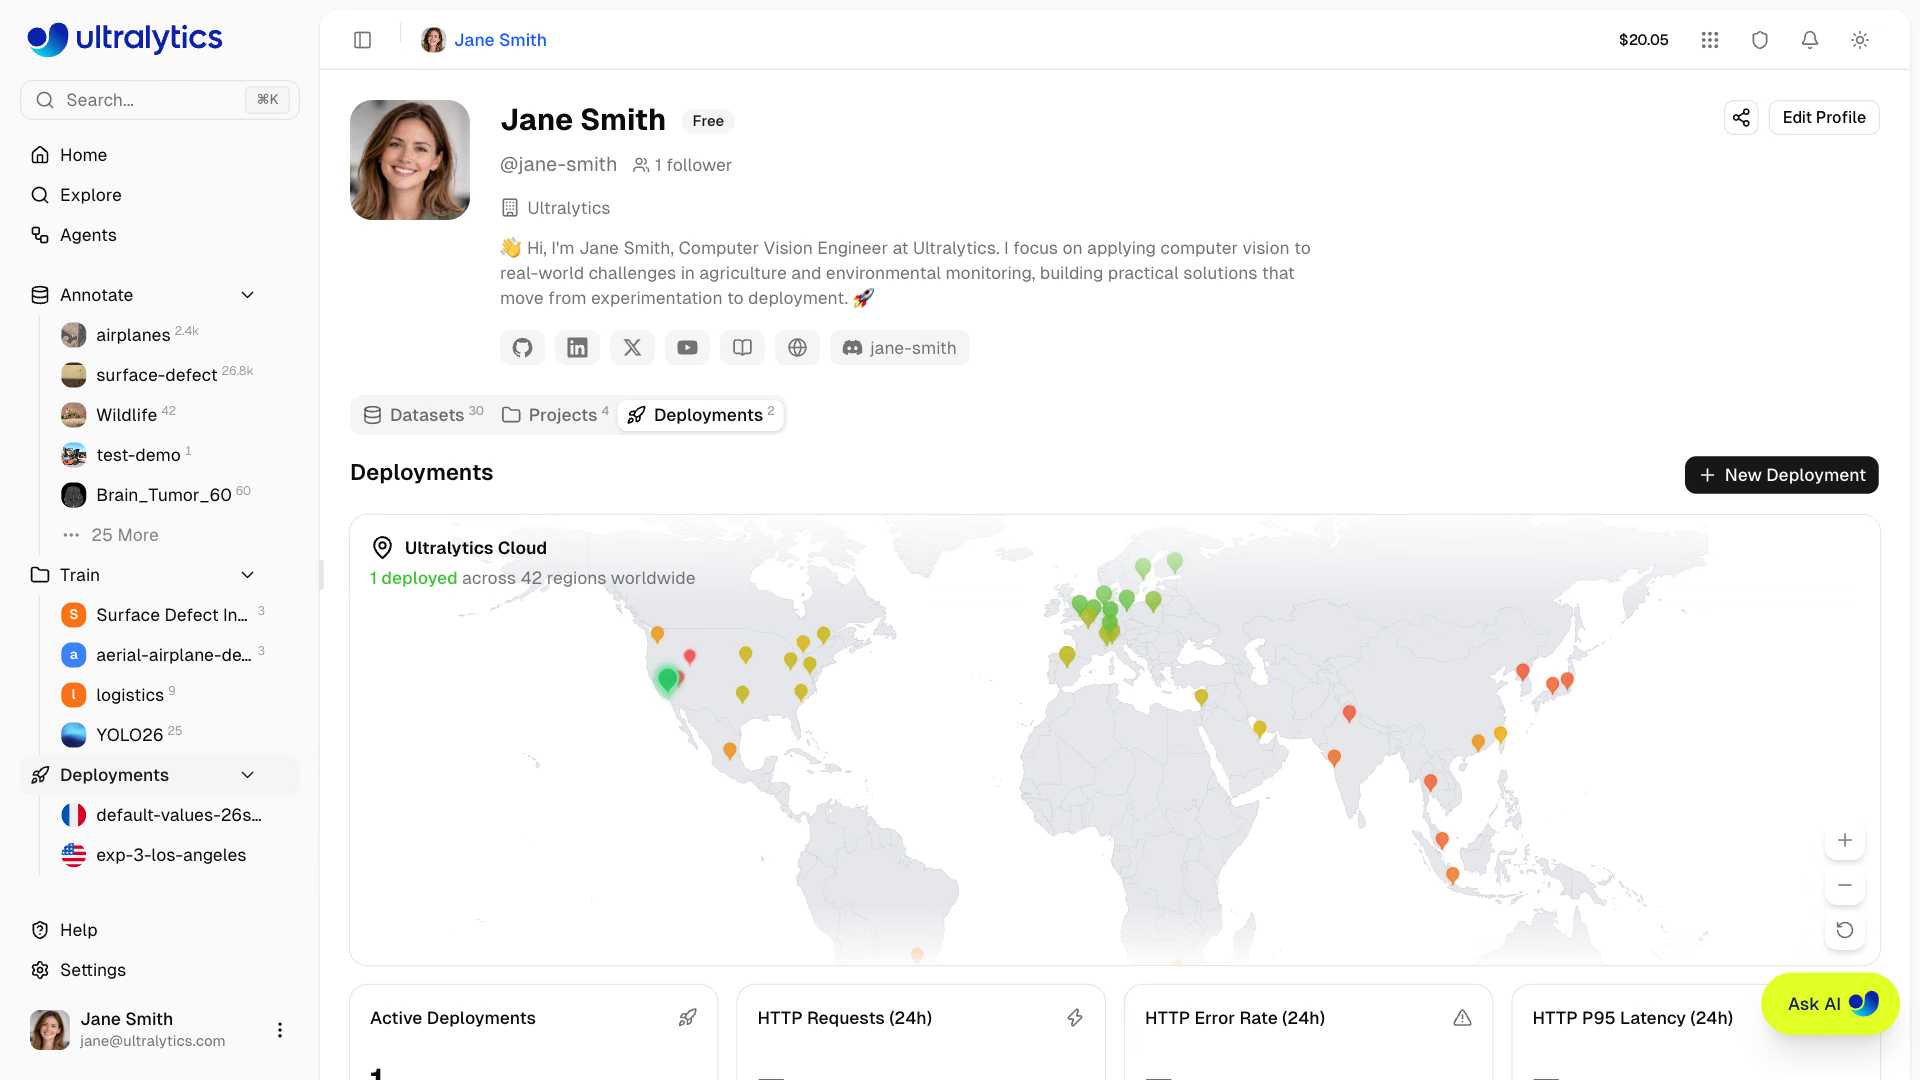
All your deployments are listed on the Deployments tab of your profile (/{username}?tab=deployments), next to
Datasets and Projects. The sidebar's Deployments section lists your deployments, each linking to its deployment
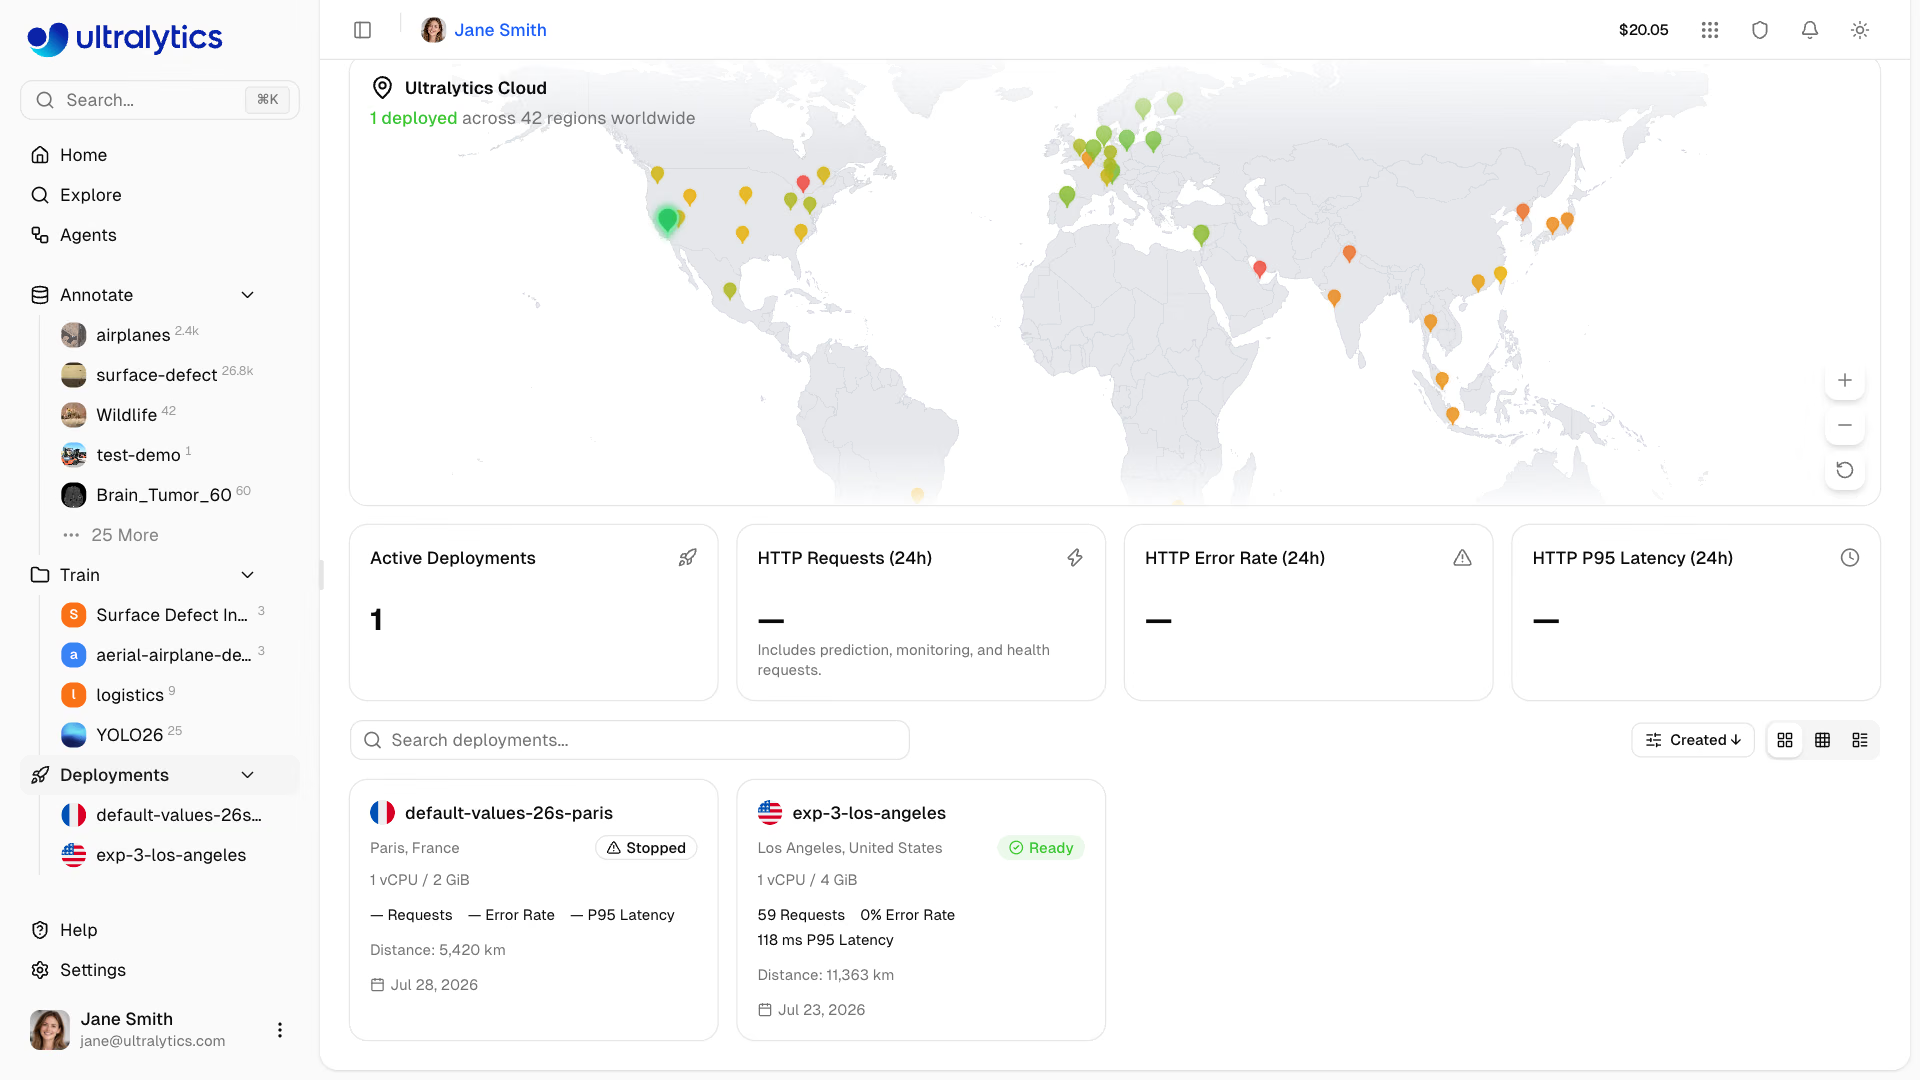
page, with a + button to create one and a link to the full tab. The tab shows:
- World map with deployed region pins; click a region to open the
New Deploymentdialog - Overview cards: Active Deployments, HTTP Requests (24h), HTTP Error Rate (24h), HTTP P95 Latency (24h)
- Deployments list with search, sorting, and three view modes: cards, compact, and table; each deployment links to
its own page with
Overview,Monitoring,Predict, andLogstabs - New Deployment button to create endpoints from any completed model
The tab refreshes automatically, and faster while a deployment is changing state (creating, deploying, or stopping). See Monitoring for details.
Every ready dedicated endpoint provides charts and example images held only in the serving instance's memory. Stopping, restarting, redeploying, resizing, or replacing the model can clear this data. Save examples to a dataset and wait for ingestion to finish to keep them. See Monitoring.
Key Features#
Global Coverage#
Deploy close to your users with 42 regions covering:
- North America, South America
- Europe, Middle East, Africa
- Asia Pacific, Oceania
Scaling Behavior#
Endpoints currently behave as follows:
- Default resources: idle endpoints scale down to zero and cold-start on the next request
- Custom resources: one instance stays warm and accrues uptime charges until stopped
- Single active instance: each endpoint currently serves from one instance on all plans
- Load shedding: requests receive
429responses when the endpoint is temporarily at capacity — see Direct Endpoint Requests - Request timeout: direct endpoint requests have a maximum duration of 1 hour; see Inference for supported inputs
Regional Deployment#
Use the measured region latency to place an endpoint near its callers. Actual inference latency depends on the model, input size, endpoint state, and network path.
Health Checks#
Each running deployment includes an automatic health check with:
- Live status indicator (healthy/unhealthy)
- Response latency display
- Auto-retry when unhealthy, stopping once healthy
- Manual re-ping button
Quick Start#
Create a deployment:
- Train or upload a model to a project
- Go to the model's Deploy tab
- Click Deploy for a region in the latency table
- Review CPU, memory, pricing, and name in the deployment dialog
- Click Create Deployment and wait for the deployment status to become Ready
Model → Deploy tab → Deploy in a region → Review configuration → Create DeploymentThe deployment name is generated from the model name and region city and can be edited before deployment. Once deployed, use the endpoint URL with your API key to send inference requests from any application.
Quick Links#
- Inference: Test models in browser
- Endpoints: Deploy dedicated endpoints
- Monitoring: Track deployment performance
FAQ#
The deployment remains in a creating or deploying state while its service starts. It becomes usable when the status changes to Ready; timing varies by model and region, and typically takes a few minutes.
Yes, each model can have multiple endpoints in different regions. Deployment counts are limited by plan: Free
3, Pro10, Enterpriseunlimited. The quota is charged to the workspace that owns the model, and an endpoint serves exactly one model at a time — use model replacement to swap it without changing the URL.Default-resource endpoints scale to zero when idle:
- Endpoint scales down after inactivity
- First request triggers cold start
- Subsequent requests are fast
First requests after an idle period trigger a cold start. Opening the deployment page runs a health check that warms the endpoint, so a test prediction right after it responds quickly.
Custom-resource endpoints stay warm and are charged for uptime, including idle time. Stop an endpoint to stop its uptime charge.