Dedicated Endpoints#
Ultralytics Platform enables deployment of YOLO models to dedicated endpoints in 42 global regions. Each endpoint is a single-tenant service with a unique endpoint URL and independent monitoring. The default resource size scales to zero when idle; custom sizes keep a warm instance and are billed for uptime.
Create Endpoint#
From the Deploy Tab#
Deploy a model from its Deploy tab:
- Navigate to your model
- Click the Deploy tab
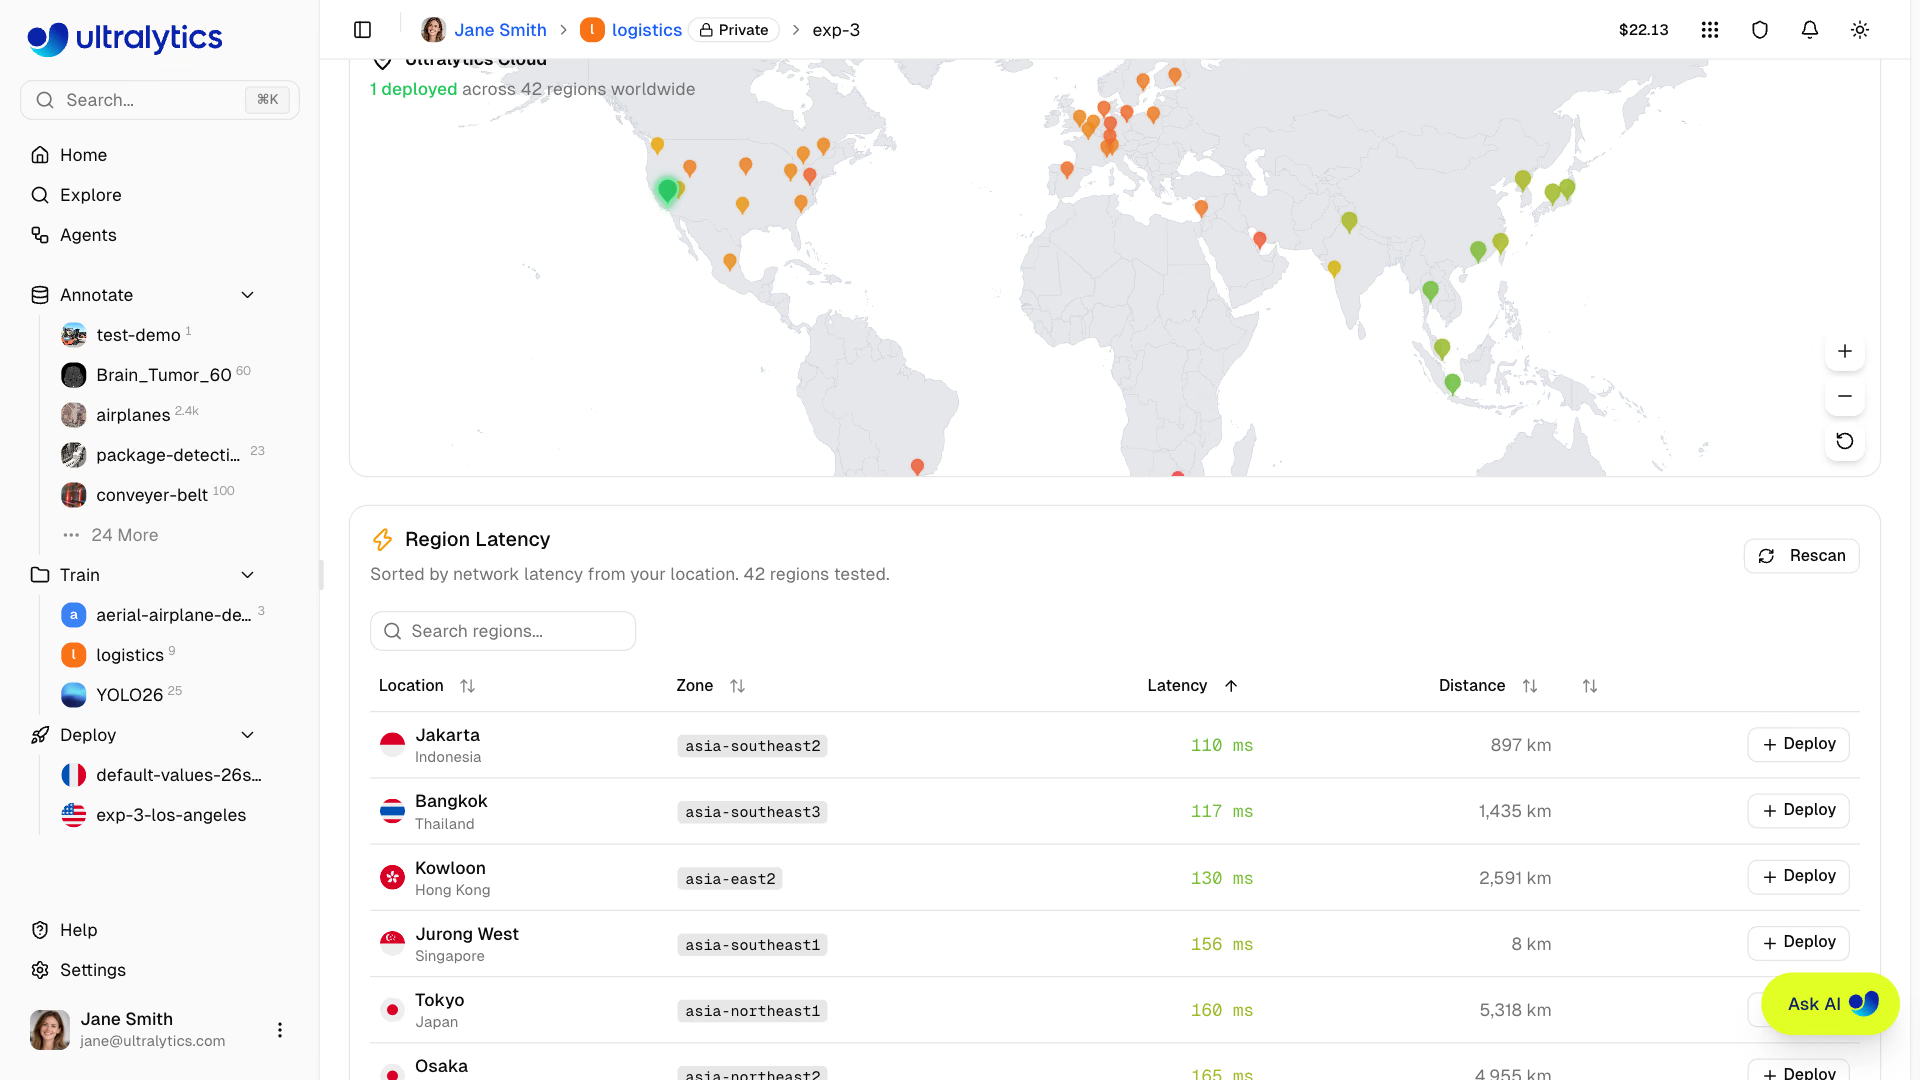
- Review the world map and the region table, which is sorted by measured latency from your location
- Click Deploy in the region row you want to use
- In the dialog, review the CPU, memory, pricing, and deployment name, then click Create Deployment
The suggested name combines the model name and region city (for example yolo26n-iowa) and can be edited before deployment. The model must have weights, or the tab shows an empty state instead of the region table.
From the Deployments Tab#
Create a deployment from the Deployments tab on your profile or from the sidebar:
- Click New Deployment on the Deployments tab, or the
+next to Deployments in the sidebar - Select a model from the model selector, which lists your completed models
- Select a region from the mini map or the latency table
- Choose CPU and memory, review the pricing, and edit the suggested deployment name if needed
- Click Create Deployment
Deployment Lifecycle#
stateDiagram-v2
    [*] --> Creating: Deploy
    Creating --> Deploying: Service starting
    Deploying --> Ready: Service URL published
    Ready --> Stopping: Stop
    Ready --> Deploying: Replace model or resize
    Stopping --> Stopped: Stopped
    Stopped --> Deploying: Start
    Deploying --> Stopped: Start failed
    Ready --> [*]: Delete
    Stopped --> [*]: Delete
    Creating --> Failed: Error
    Deploying --> Failed: Error
    Failed --> [*]: Delete

    classDef proc fill:#2196F3,color:#fff
    classDef out fill:#9C27B0,color:#fff
    classDef error fill:#F44336,color:#fff
    classDef extern fill:#607D8B,color:#fff
    class Creating,Deploying,Stopping proc
    class Ready out
    class Failed error
    class Stopped extern
Connect Slack alerts to receive a message when a deployment becomes ready or fails to start.
Region Selection#
Choose from 42 regions worldwide. The interactive region map and table show:
- Region pins: Color-coded by latency on a green-to-red gradient (faster regions are greener, slower regions are redder)
- Deployed regions: Highlighted with a "Deployed" badge in the table
- Deploying regions: Animated pulse indicator on the pin and the table row
- Bidirectional highlighting: Hover on the map highlights the table row, and vice versa
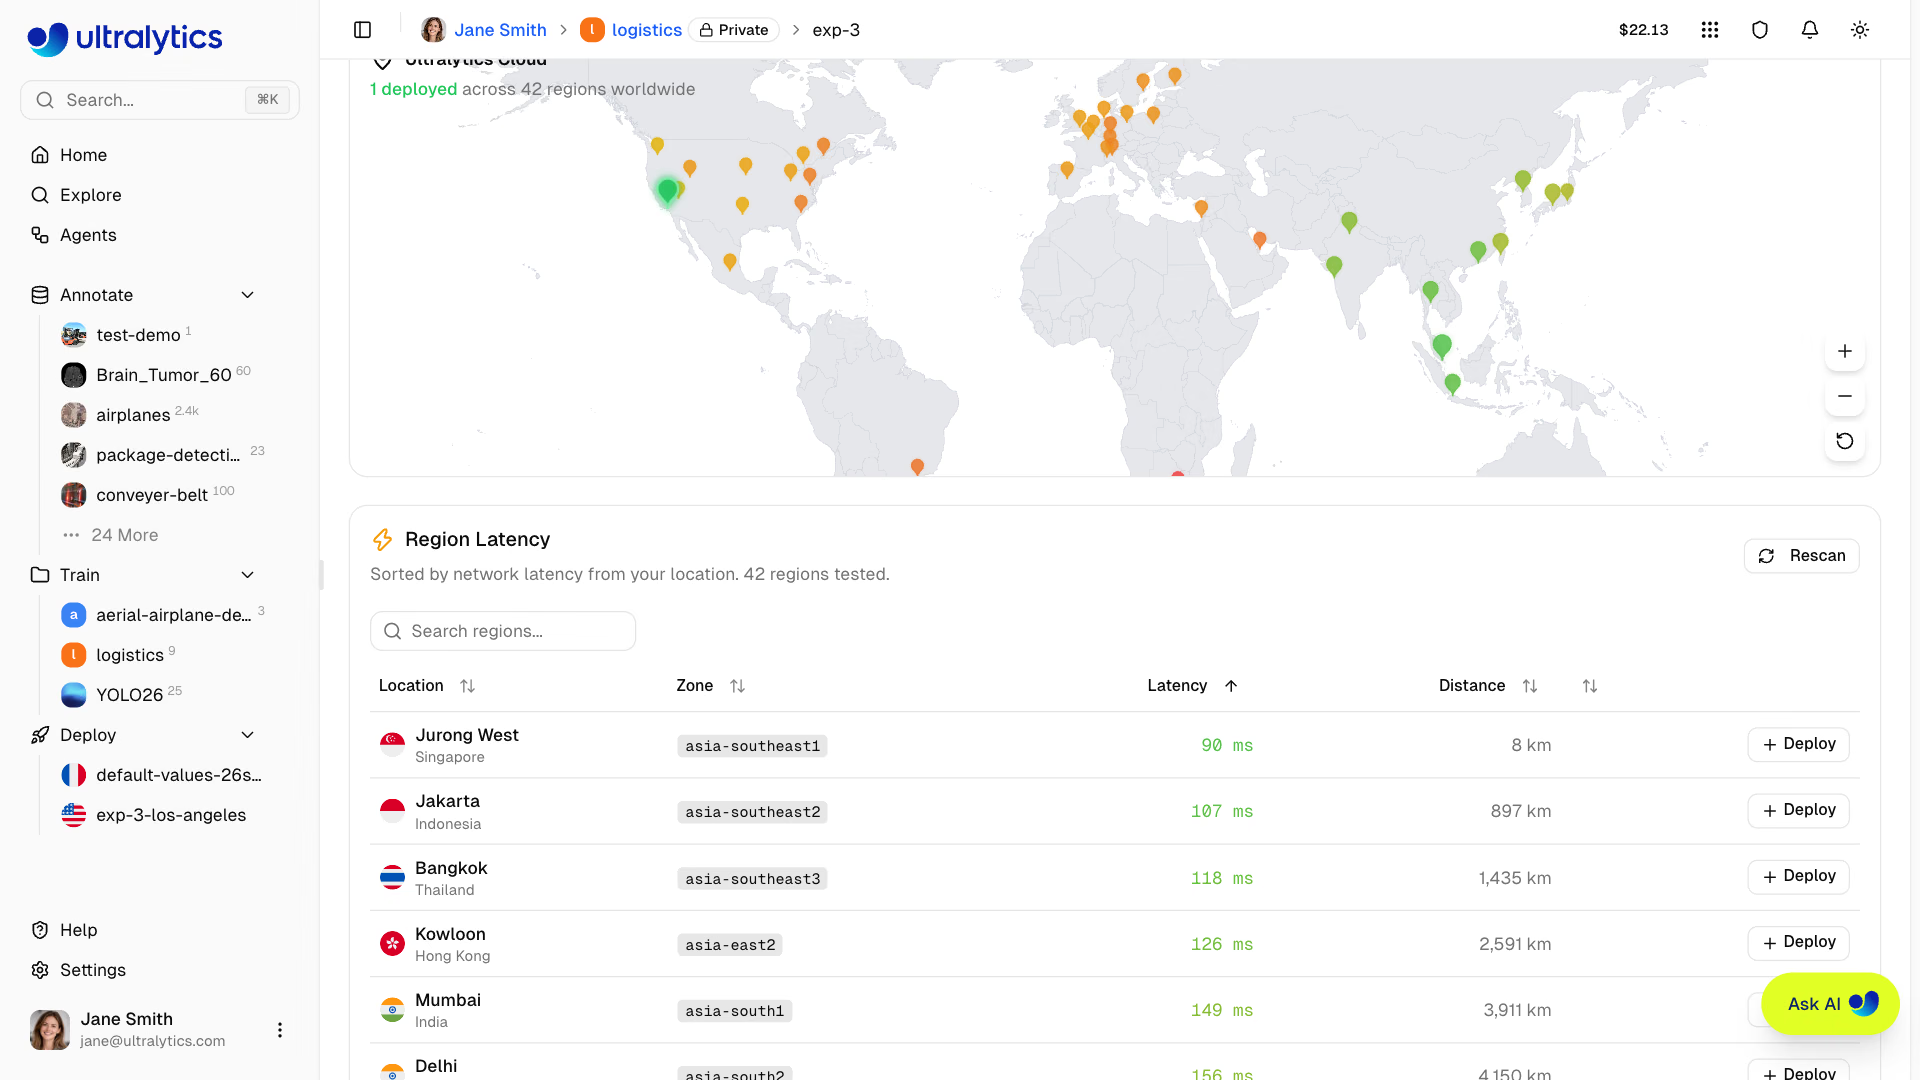
The region table on the model Deploy tab includes:
| Column | Description |
|---|---|
| Location | City and country with flag icon |
| Zone | Region identifier |
| Latency | Measured ping time from your browser |
| Distance | Distance from your approximate location in km |
| Actions | Deploy button or "Deployed" status badge |
The table is searchable by city, country, and zone, and is sorted by latency by default.
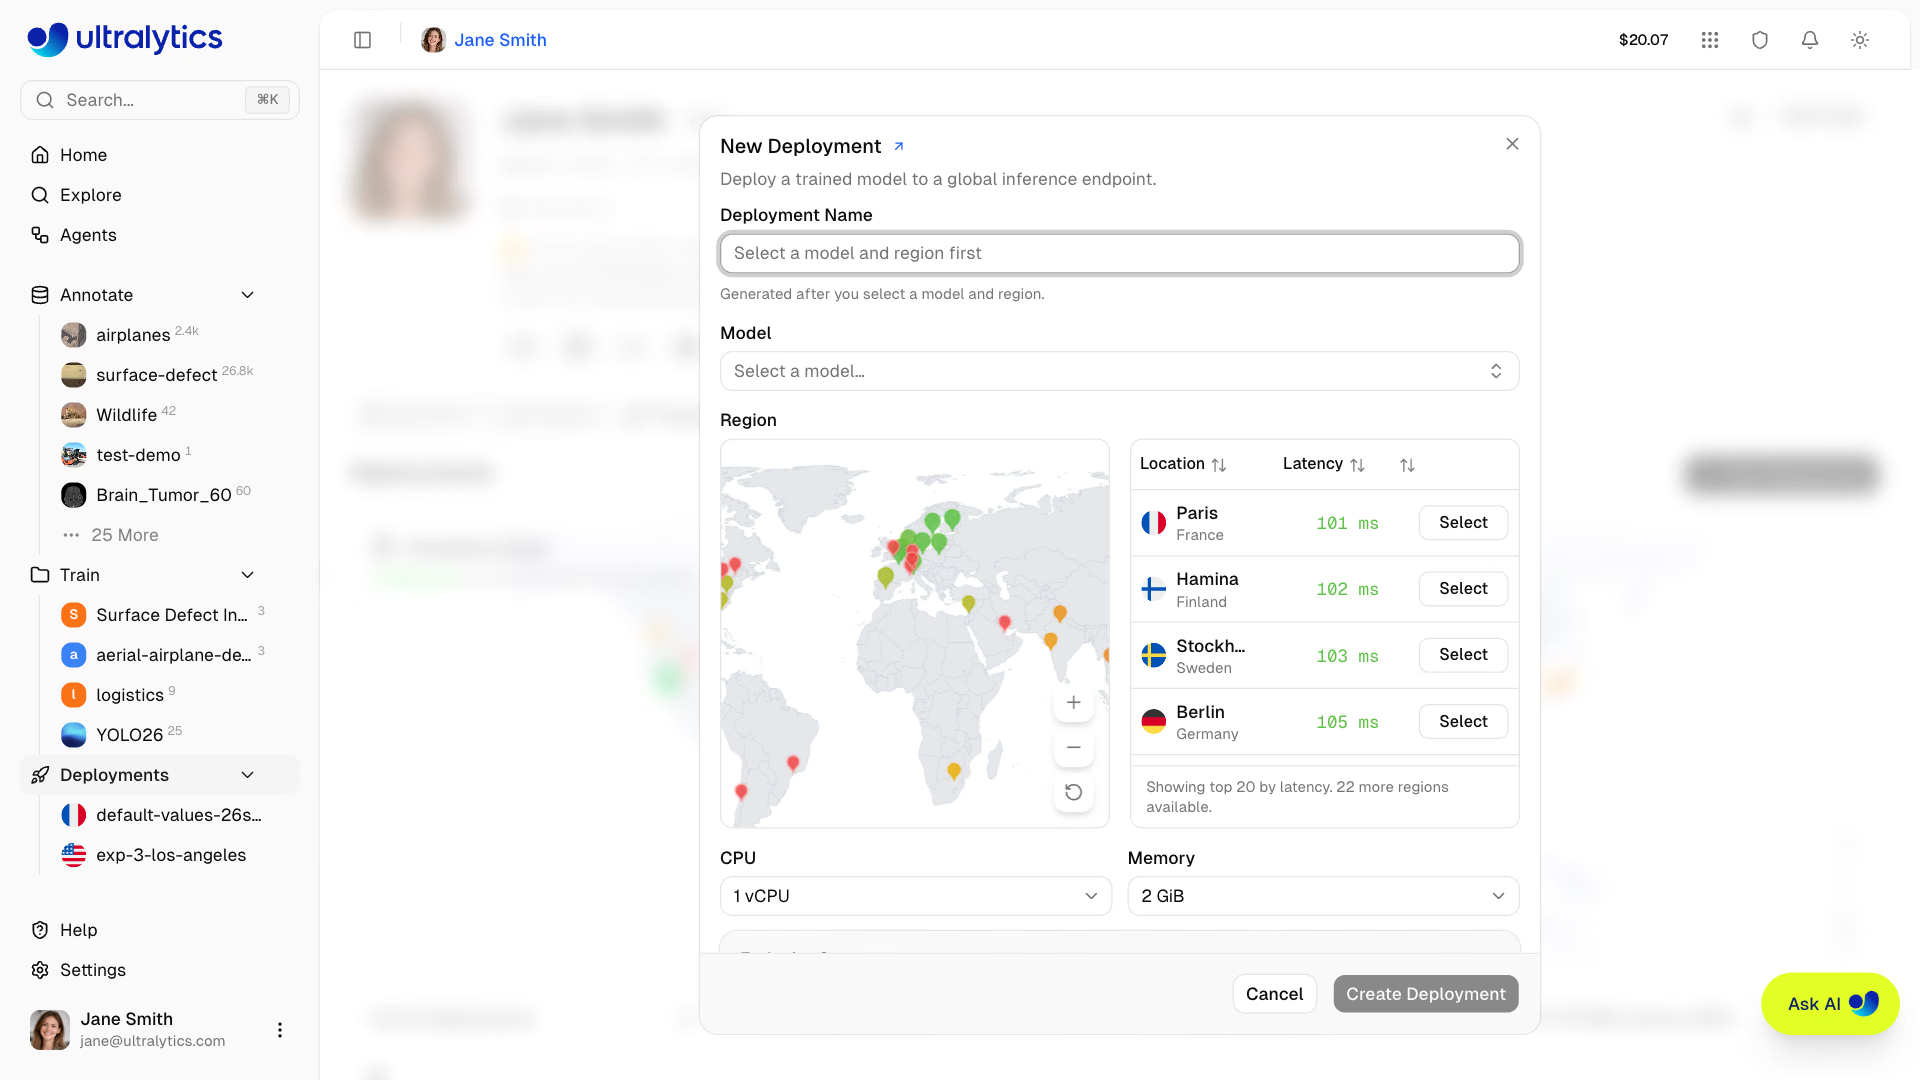
The New Deployment dialog (from the Deployments tab or the sidebar) shows a simpler region table with only Location, Latency, and Select columns, listing the 20 fastest regions with a note about the remaining ones. Use the mini map to pick any other region.
Your browser measures latency to each of the 42 regions, and results are cached for 30 minutes and shared across the Deploy tab and the New Deployment dialog. Use the Rescan button on the model Deploy tab to re-measure from your current network. Distance is computed from the approximate location of your request, so it is a rough guide rather than a precise value.
Available Regions#
| Zone | Location |
|---|---|
| us-central1 | Iowa, USA |
| us-east1 | South Carolina, USA |
| us-east4 | Northern Virginia, USA |
| us-east5 | Columbus, USA |
| us-south1 | Dallas, USA |
| us-west1 | Oregon, USA |
| us-west2 | Los Angeles, USA |
| us-west3 | Salt Lake City, USA |
| us-west4 | Las Vegas, USA |
| northamerica-northeast1 | Montreal, Canada |
| northamerica-northeast2 | Toronto, Canada |
| northamerica-south1 | Queretaro, Mexico |
| southamerica-east1 | Sao Paulo, Brazil |
| southamerica-west1 | Santiago, Chile |
Endpoint Configuration#
New Deployment Dialog#
The New Deployment dialog lets you select a model, region, resources, and deployment name:
| Field | Description |
|---|---|
| Model | Any completed model in the workspace, chosen with the selector |
| Region | Deployment region, chosen on the mini map or in the latency table |
| CPU and Memory | Select the resource size and review its displayed pricing |
| Deployment Name | Auto-generated once model and region are set, and editable |
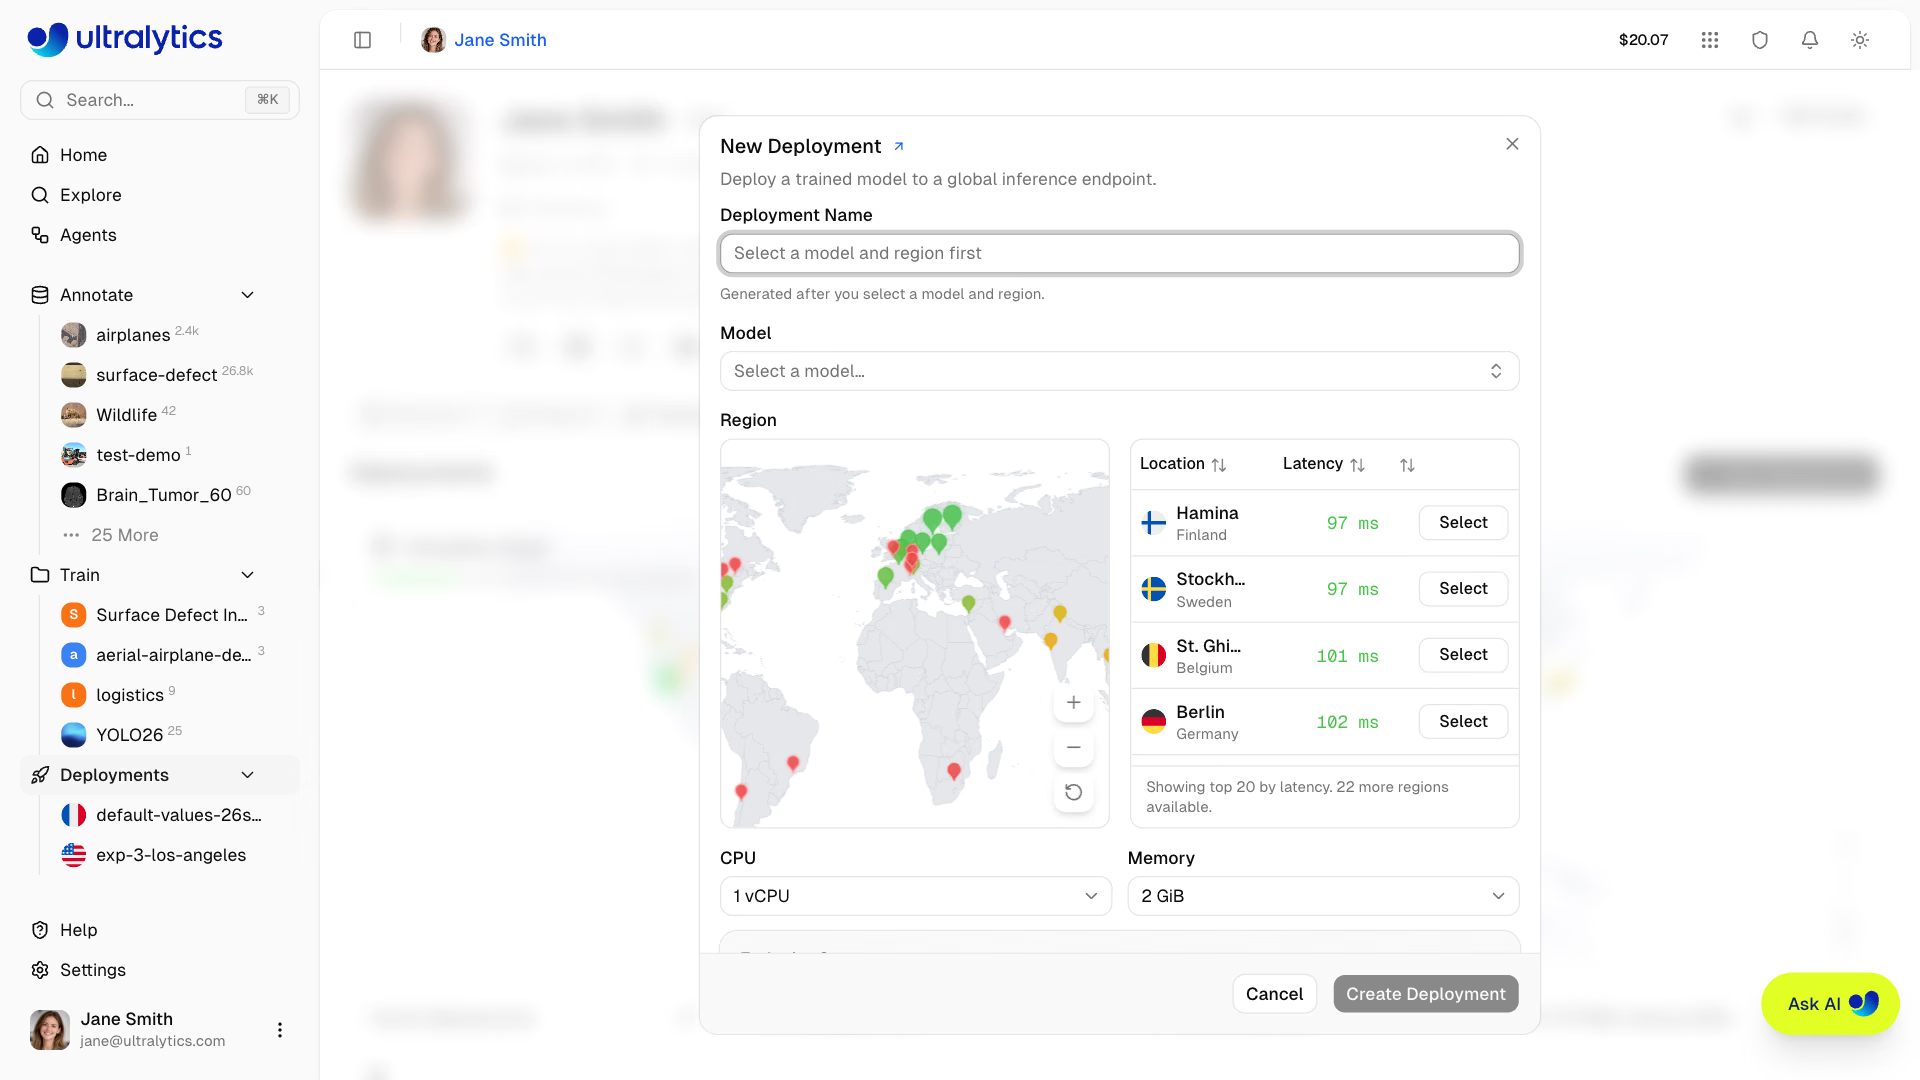
Choose the CPU and memory size in the resources controls and review the displayed pricing before creating the deployment. CPU options are 1, 2, 4, 6, or 8 vCPU and memory options are 2 to 32 GiB; larger memory sizes need more vCPU (for example, 16 GiB requires at least 4 vCPU), and the dialog explains any invalid combination. The default size (1 vCPU, 2 GiB) is free and scales to zero when idle. Custom sizes keep one warm instance and are charged at the displayed regional hourly rate from readiness until you stop the endpoint, including idle time. Creating, starting, or resizing to a custom size requires available credits, and custom-size endpoints are stopped automatically when the workspace runs out of credits. Agents reuses this dialog when you select New deployment….
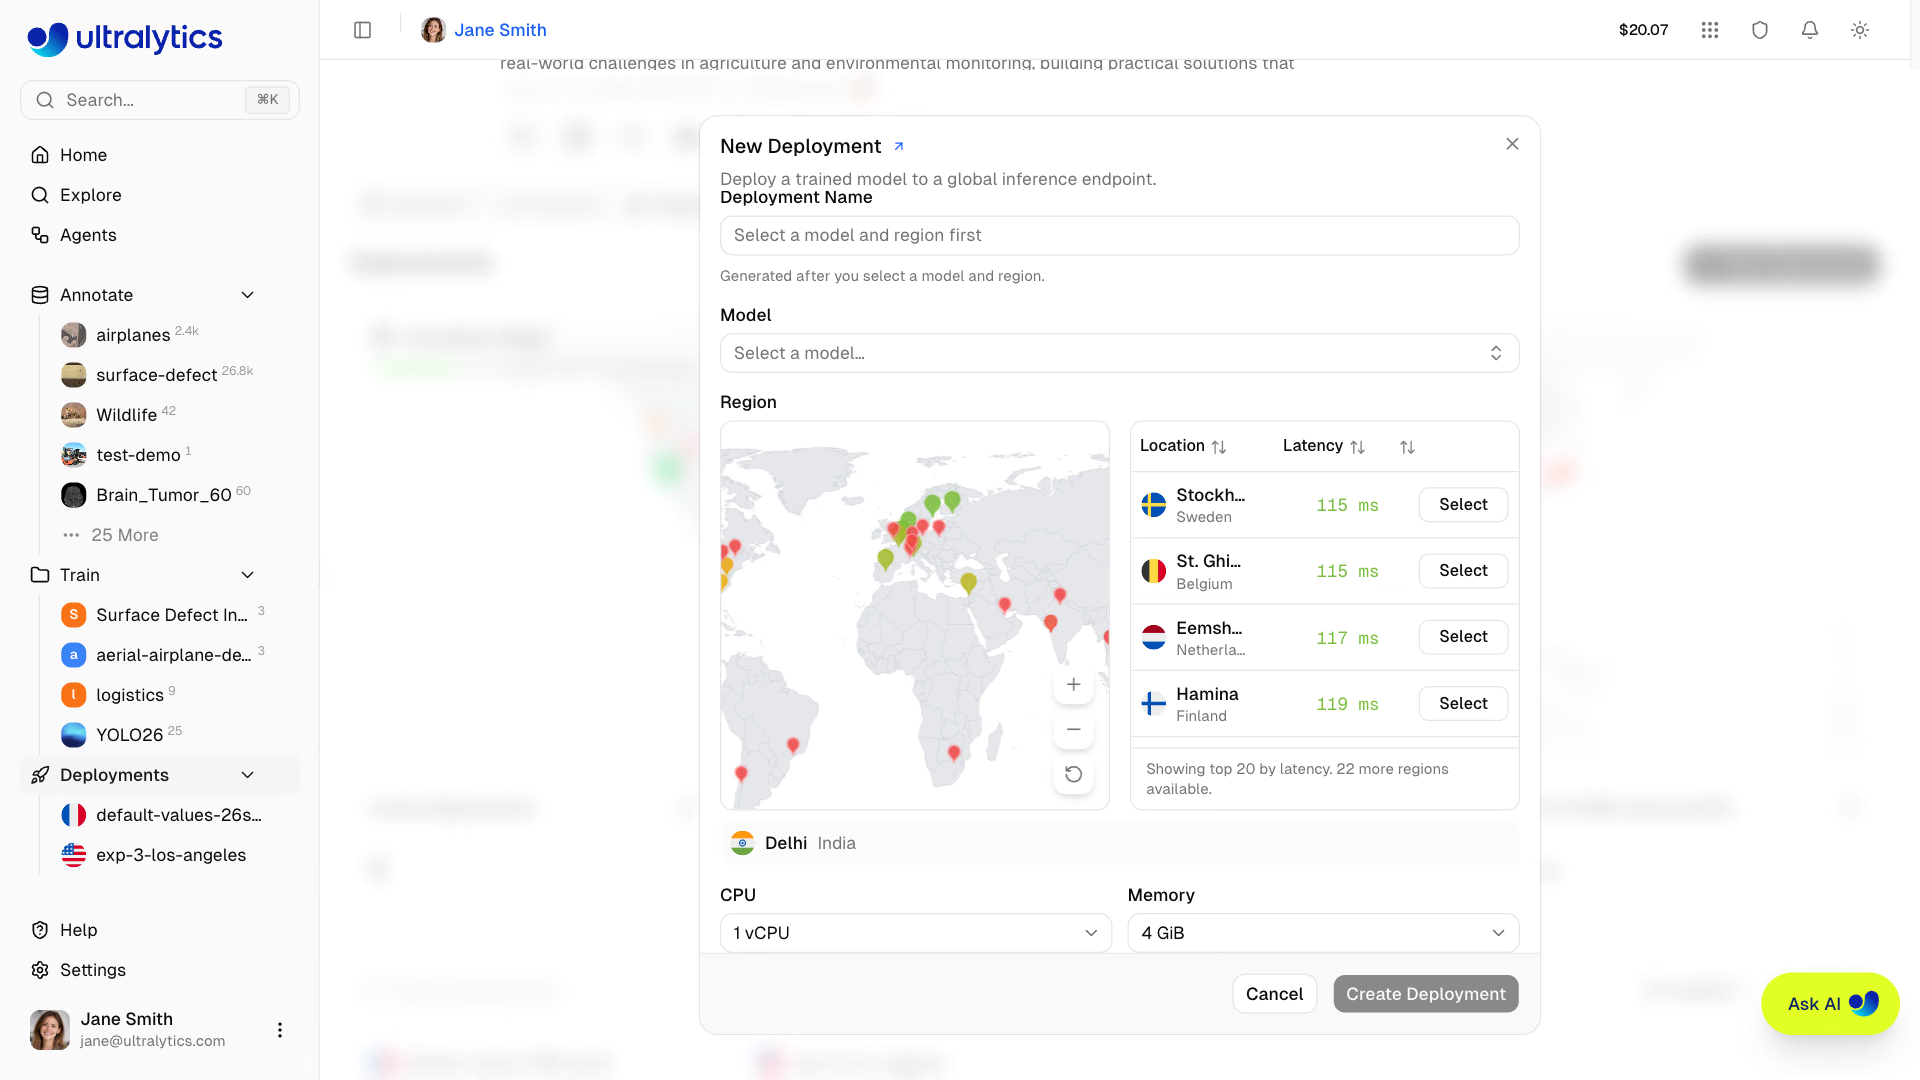
The deployment name combines the model name with the region city, for example yolo26n-iowa. Names must be unique within a workspace: when the name is already taken, the dialog shows an inline error and disables Create Deployment until you choose another name.
Deploy Tab (Quick Deploy)#
Deploying from the model's Deploy tab opens the same dialog with the model and region preselected. Review the resource size, pricing, and auto-generated name before creating the endpoint. The deployment appears in the list of the model's deployments below the region table while it is created.
Manage Endpoints#
View Modes#
The deployments list supports three view modes:
| Mode | Description |
|---|---|
| Cards | Cards with status, size, metrics, distance, and deployed date |
| Compact | Grid of smaller cards with key metrics |
| Table | DataTable with sortable columns |
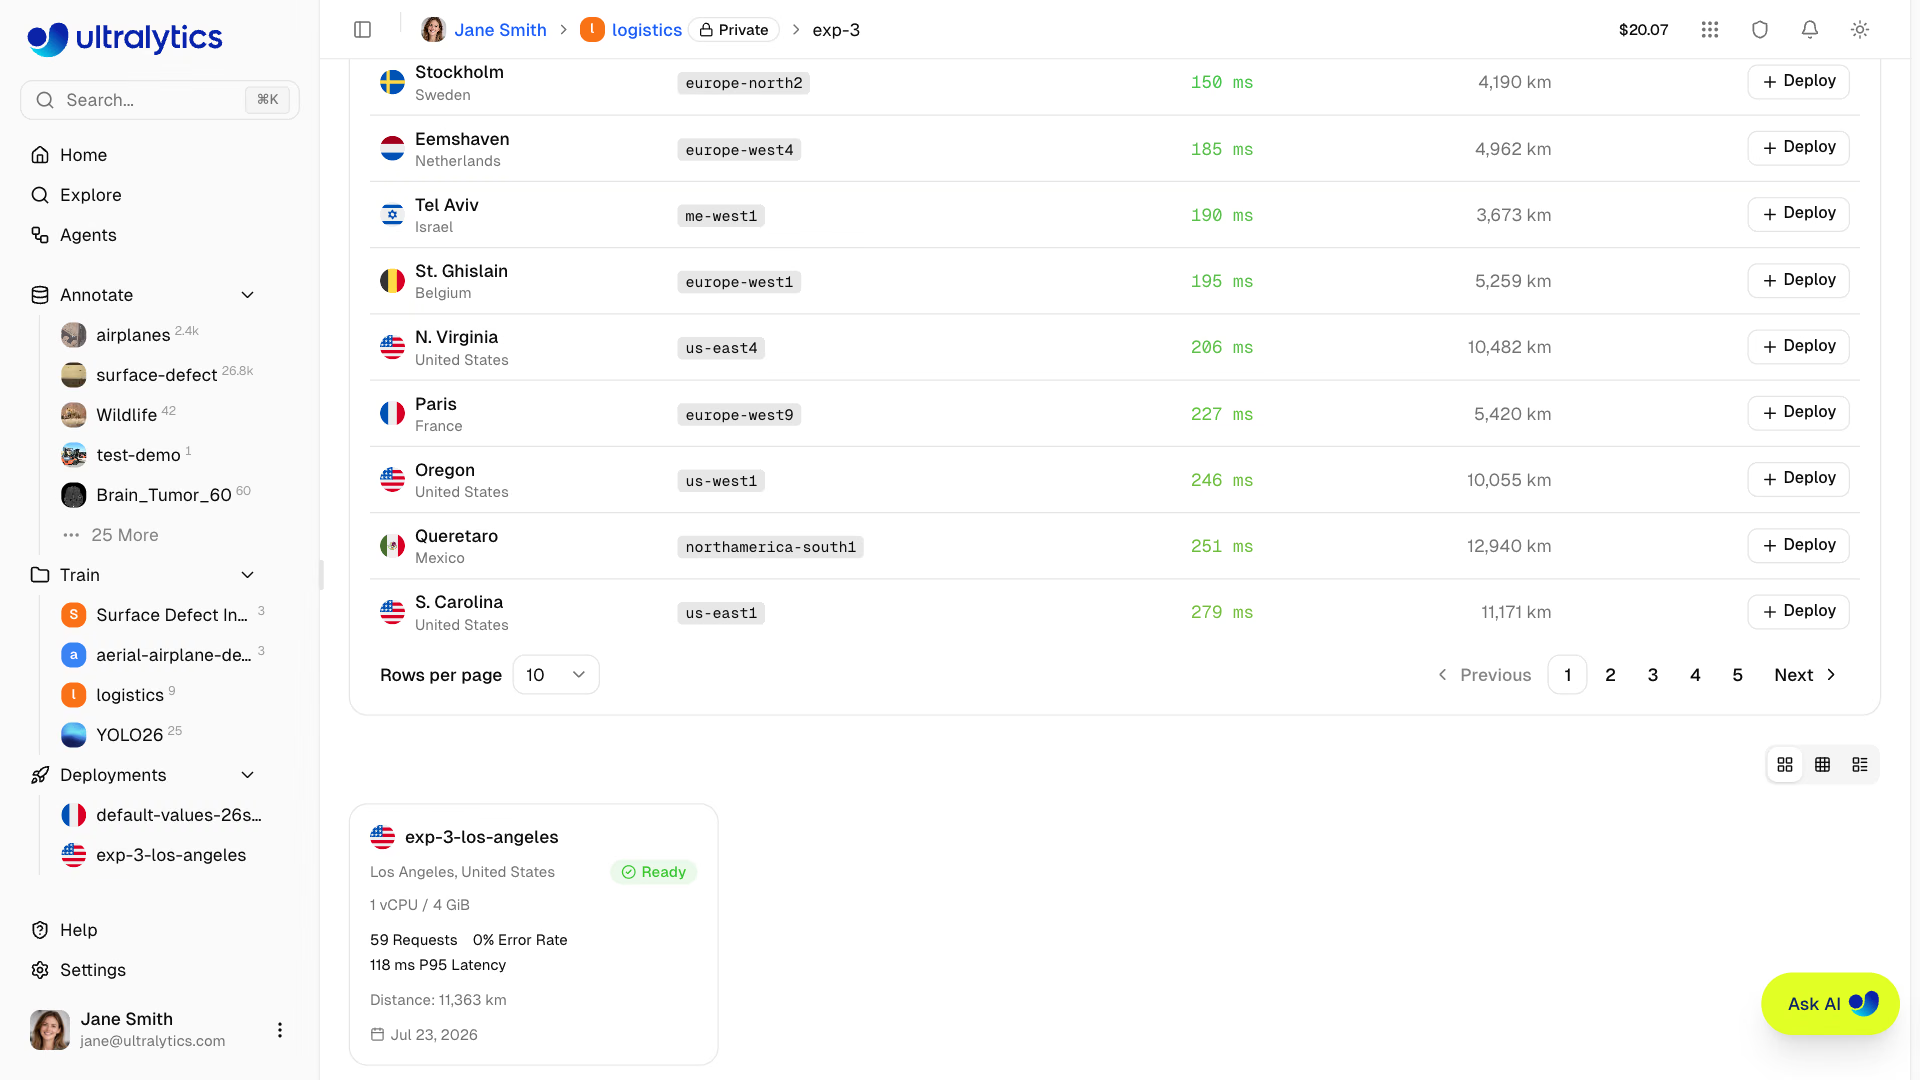
Compact cards show the flag, name, city, status, and the three metrics. The table view is sortable on Name, Region, Status, CPU, Memory, HTTP Requests, HTTP Error Rate, HTTP P95 Latency, Distance, and Deployed. Every card and row links to the deployment page; lifecycle actions live on that page, and the trash icon next to a deployment in the sidebar deletes it.
Deployment Page#
Each deployment has its own page at /{username}/deploy/{deployment}, which shows:
- Header: Region flag, display name (click it to rename; the page URL and API path change to a slug of the new name, the endpoint URL does not), status badge, location, and CPU and memory size
- Actions: Update configuration, Replace model, and Stop deployment when Ready, Start deployment when Stopped, and a More actions (…) menu with Information, Refresh, and Delete Deployment
- Metrics: HTTP Requests, HTTP Error Rate, and HTTP P95 Latency over 24 hours with sparklines, plus a card linking to the deployed model
- Tabs:
Overview,Monitoring,Predict, andLogs - Status message: The failure reason, when a deployment failed
The Overview tab shows the location map, the Endpoint card with the copyable endpoint URL, an API
documentation link, and a health check, and a Deployment Information card with pricing, region, CPU, and memory.
The Logs tab shows recent log entries with severity filtering (All / Errors). The Predict tab provides an inline
predict panel for testing directly on the deployment; its Docs result tab has ready-to-use code examples in Python,
JavaScript, and cURL filled in with the endpoint URL and, for workspace owners, the bound API key (see
Monitoring). The Information dialog lists the deployment's properties and lets you
edit custom metadata.
Update CPU and Memory#
- Open the deployment page of a Ready endpoint.
- Click Update configuration.
- Choose CPU and Memory, and review the displayed hourly cost.
- Click Update Configuration. The current configuration keeps serving until the new one is ready.
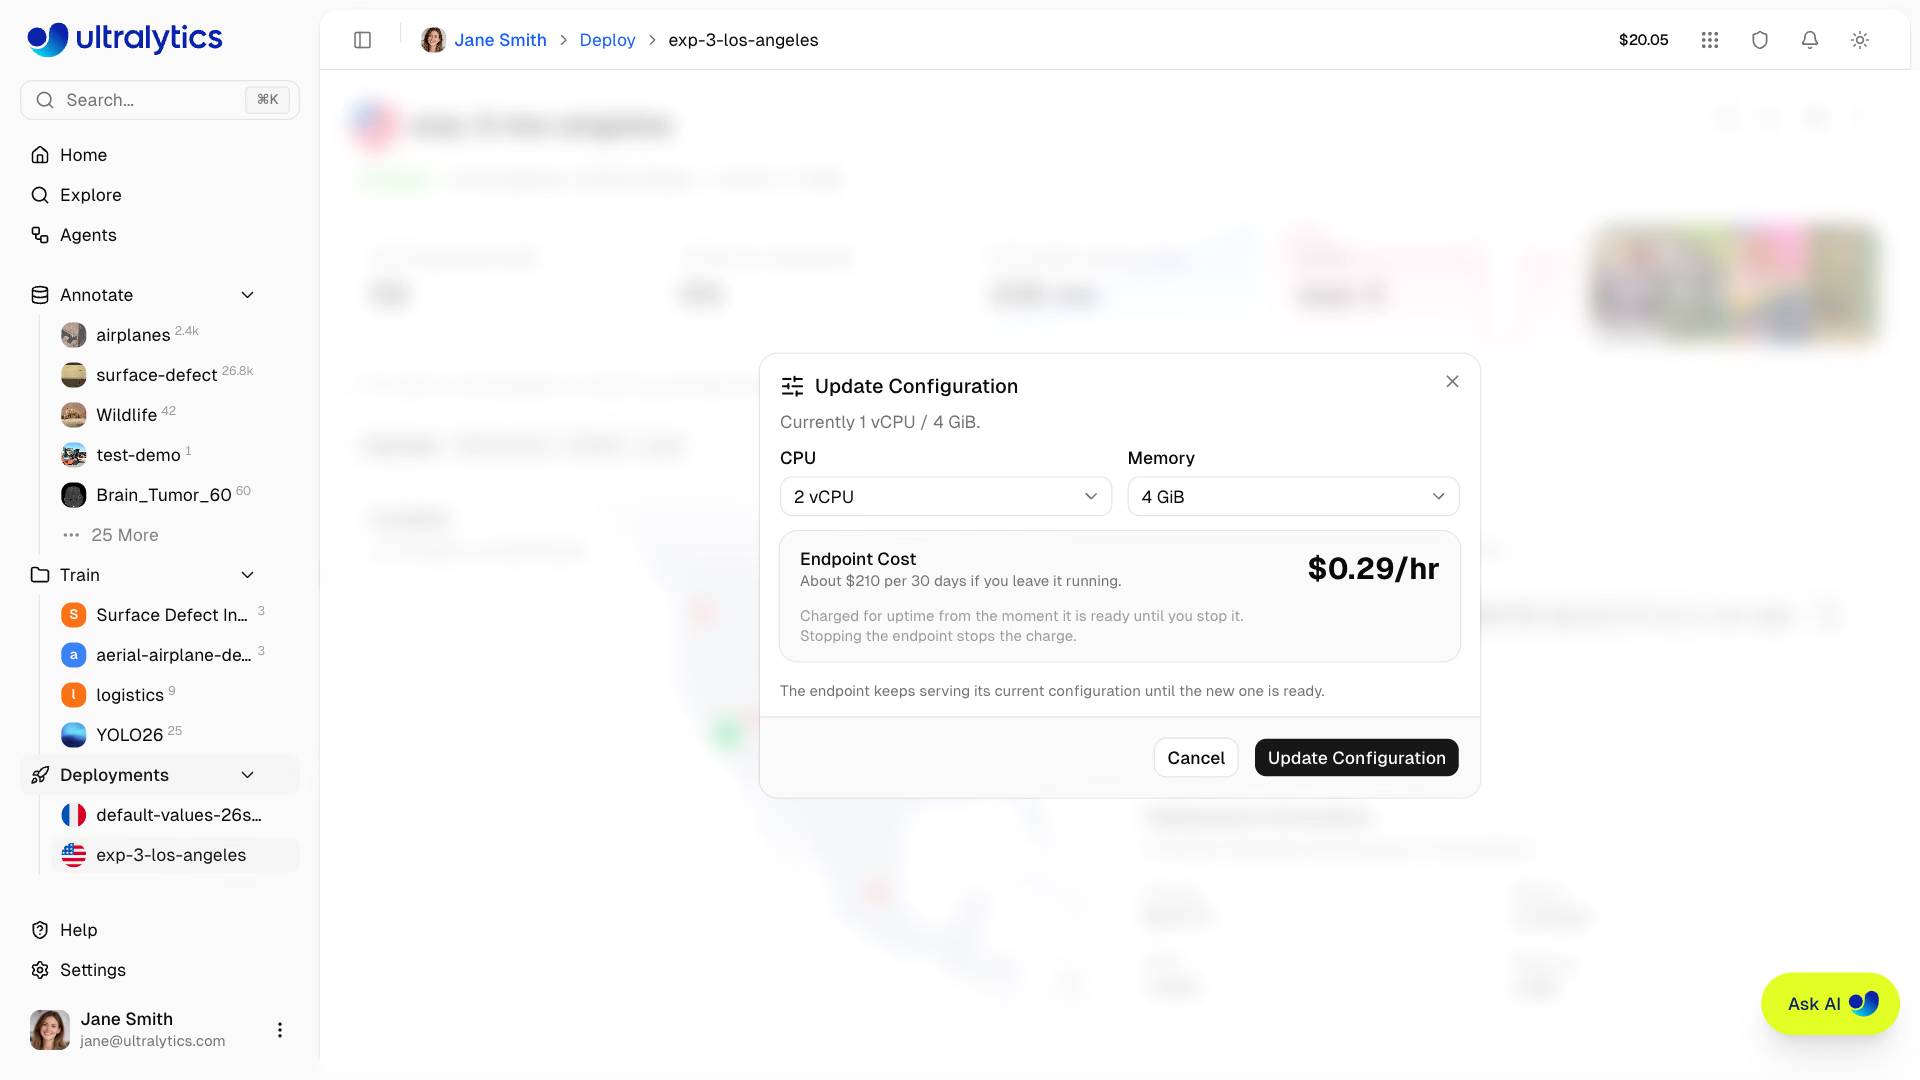
Custom resources use uptime billing and keep an instance warm, which can also keep an IP camera running at no extra charge (see Background Camera). Returning to default resources restores scale-to-zero behavior and removes the background camera.
Monitoring charts and example images are lightweight, in-memory data. Stopping, restarting, redeploying, resizing, or replacing a model can clear them. Starting the endpoint again does not restore the history. Save useful examples to a dataset and wait for ingestion to finish before changing the endpoint. Operational metrics and logs have separate history windows.
Replace a Model#
Replace the model behind a ready endpoint without changing its URL:
- Open the deployment page
- Click Replace model
- Select another completed model from the same workspace
- Optionally edit the deployment name
- Click Replace Model
The current model continues serving while the replacement starts up. Once the replacement is ready, traffic moves to the new model. The deployment ID, URL, region, and API key remain unchanged; its display name changes only when you enter a new one. If replacement fails, the previous model and name remain active.
Replacement requires all of the following, and is rejected otherwise:
- The deployment is Ready and has no other lifecycle operation in flight
- The replacement model has weights and belongs to the same workspace as the deployment
- The replacement model is not the one already deployed
Replacement removes the previous model from the deployment. Each endpoint serves one model; create another deployment when you need both models available at the same time.
Deployment Statuses#
| Status | Description |
|---|---|
| Creating | Deployment is being set up |
| Deploying | Container is starting |
| Ready | Endpoint is live and accepting requests |
| Stopping | Endpoint is shutting down |
| Stopped | Endpoint is paused and unavailable |
| Failed | Deployment failed (see error message) |
On a Ready deployment, the page's badge reads Starting until the endpoint answers its first health check, and Not responding if the check fails.
Endpoint URL#
Each endpoint has a unique URL, for example:
https://predict-<deployment-id>-<hash>-<region>.a.run.app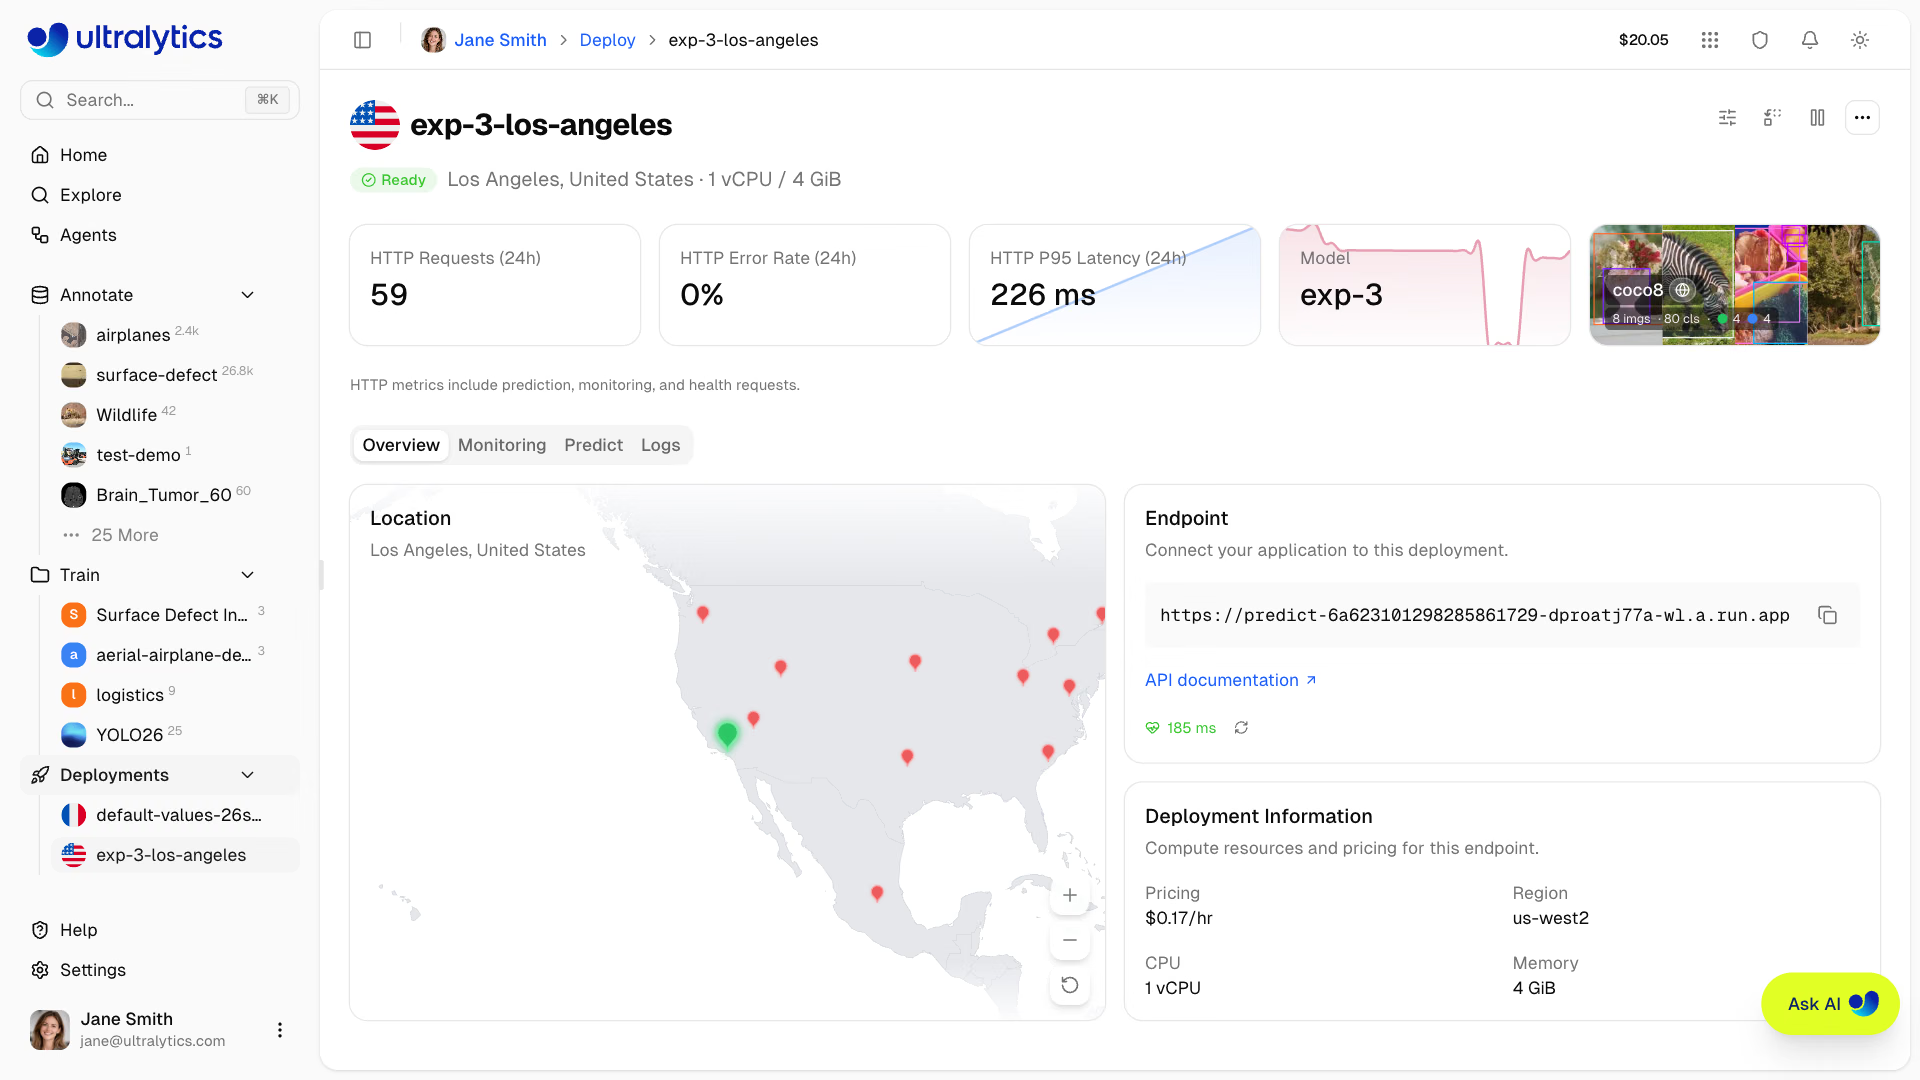
Click the copy button to copy the URL. Click API documentation to open the endpoint's own API reference. The endpoint serves these paths:
| Path | Method | Description |
|---|---|---|
/predict | POST | Run inference; requires the deployment API key |
/health | GET | Liveness check reporting service status and the number of cached models |
/ | GET | Status summary for the deployed service |
/docs | GET | Interactive API reference generated for this deployment, model, and region |
Lifecycle Management#
Control your endpoint state:
graph LR
    R[Ready]:::out -->|Stop| S[Stopped]:::extern
    S -->|Start| R
    R -->|Delete| D[Deleted]:::error
    S -->|Delete| D

    classDef out fill:#9C27B0,color:#fff
    classDef error fill:#F44336,color:#fff
classDef extern fill:#607D8B,color:#fff| Action | Description |
|---|---|
| Start | Resume a stopped endpoint |
| Stop | Pause the endpoint |
| Delete | Permanently remove endpoint |
Stop Endpoint#
Stop an endpoint when you do not want it to accept requests:
- Click Stop deployment on the deployment page
- Endpoint status changes to "Stopping" then "Stopped"
Stopped endpoints:
- Don't accept requests, and report no live metrics or health status
- Stop accruing uptime charges
- Lose temporary monitoring statistics and example images when the serving instance shuts down
- Keep their URL, region, and bound API key, and can be restarted anytime
- Still count against your plan's deployment quota — delete an endpoint to free its slot
Delete Endpoint#
Permanently remove an endpoint:
- Open More actions (…) on the deployment page and click Delete Deployment, or click the trash icon next to the deployment in the sidebar
- Confirm with Delete
Deletion is immediate and permanent — deployments do not go to Trash. Deleting the endpoint removes its service and frees a slot in your deployment quota. You can always create a new endpoint, but it receives a new URL.
Deployments are also removed when their model or project is permanently deleted, or when a trashed model or project reaches the end of its retention window.
Using Endpoints#
Authentication#
Each deployment is bound to a single API key from the workspace that owns the model. Include it in requests:
Authorization: Bearer YOUR_API_KEYThe endpoint accepts only the key bound at creation, so no other key opens it — not even another active key in the same workspace. To control which key gets bound, deploy via the API authenticated with the workspace owner's key: that exact key is bound, and you already hold it. Deployments created any other way (the Platform UI, or an API call authenticated as a team member) bind one of the owning workspace's active keys automatically — ask the workspace owner for its value, since only the owner can view key values (see API Keys). Team members without the bound key can still run inference through the Platform predict proxy in the browser.
Deleting or deactivating the bound API key does not revoke direct access to the endpoint — anyone holding the key string can still call the endpoint URL. What does break is the Platform predict proxy, which checks the key live and reports it as no longer available. To fully revoke access, stop or delete the deployment; after rotating keys, create the endpoint again so it binds the new key.
Direct Endpoint Requests#
Send production requests directly to the URL shown on the deployment page. These requests do not pass through the Platform API rate limiter, so the 20 requests/minute predict limit does not apply. The endpoint still has its own capacity ceiling:
- A single instance serves each endpoint, processing a limited number of requests at once
- Requests that cannot be served promptly return
429with aRetry-Afterheader - A single request may run for up to 1 hour, which allows video inference to complete
- Request bodies are limited to 32 MB; larger uploads are rejected with
413 - Responses larger than 1 KB are gzip-compressed, and cross-origin browser requests are allowed
Request Example#
import requests

# Deployment endpoint
url = "https://YOUR_DEPLOYMENT_URL.run.app/predict"

# Headers with your deployment API key
headers = {"Authorization": "Bearer YOUR_API_KEY"}

# Inference parameters
data = {"conf": 0.25, "iou": 0.7, "imgsz": 640}

# Send image for inference
with open("image.jpg", "rb") as f:
    response = requests.post(url, headers=headers, data=data, files={"file": f})

print(response.json())
Request Parameters#
| Parameter | Type | Default | Range | Description |
|---|---|---|---|---|
file | file | - | - | Image or video file (required unless source set) |
conf | float | 0.25 | 0.01 – 1.0 | Minimum confidence threshold |
iou | float | 0.7 | 0.0 – 0.95 | NMS IoU threshold |
imgsz | int | - | 32 – 1280 | Input image size in pixels; defaults to the model's training size (640 if unavailable) |
normalize | bool | false | - | Return bounding box coordinates as 0 – 1 |
decimals | int | 5 | 0 – 10 | Decimal precision for coordinate values |
vid_stride | int | 1 | ≥ 1 | Predict every Nth video frame; images ignore it |
bits | int | 8 | 8, 12, 16 | Depth map quantization, depth models only |
source | string | - | - | Image URL or base64 string (alternative to file); max 4,096 characters via Platform API |
An endpoint keeps the inference runtime from its last rollout, so newer behavior such as the training-size imgsz
default or vid_stride above reaches it when a new revision rolls out, for example after you
replace its model or change its CPU or memory. Pass imgsz explicitly
for a fixed input size.
See Depth responses for how bits changes the returned depth map and how to
decode it.
Dedicated endpoints accept both images and videos via the file parameter.
- Image formats (up to 32 MB per request): AVIF, BMP, DNG, HEIC, HEIF, JP2, JPEG, JPG, MPO, PNG, TIF, TIFF, WEBP
- Video formats (up to 32 MB per request): ASF, AVI, GIF, M4V, MKV, MOV, MP4, MPEG, MPG, TS, WEBM, WMV
Results are returned per processed video frame; depth models accept images only. You can also pass a public image URL or a base64-encoded image via the source parameter instead of file. Oversized uploads are rejected with 413.
Response Format#
Same as shared inference with task-specific fields.
FAQ#
Endpoint limits depend on plan:
- Free: Up to 3 deployments
- Pro: Up to 10 deployments
- Enterprise: Unlimited deployments
Each model can still be deployed to multiple regions within your plan quota. The quota is counted against the workspace that owns the model, so team members deploying a shared model consume the owner's allowance. Reaching the limit returns an error asking you to delete an existing deployment first.
No, regions are fixed. To change regions:
- Delete the existing endpoint
- Create a new endpoint in the desired region
The new endpoint receives a new URL. To change only the model behind an endpoint, use model replacement, which keeps the URL.
For global coverage:
- Deploy to multiple regions
- Use a load balancer or DNS routing
- Route users to the nearest endpoint
Cold start time depends on the model and whether the endpoint has scaled to zero; starting from idle can take up to about a minute, and Platform allows an idle endpoint extra time to start before reporting it unhealthy. Opening the deployment page or re-running its health check warms an idle endpoint, so do either before a burst of traffic arrives.
No. Each deployment serves traffic on the generated endpoint URL shown on its deployment page, which stays stable for the life of the deployment — including across model replacements.