Link to this sectionMonitoring#
Ultralytics Platform provides monitoring for deployed endpoints. Track request metrics, view logs, and check health status with automatic polling.
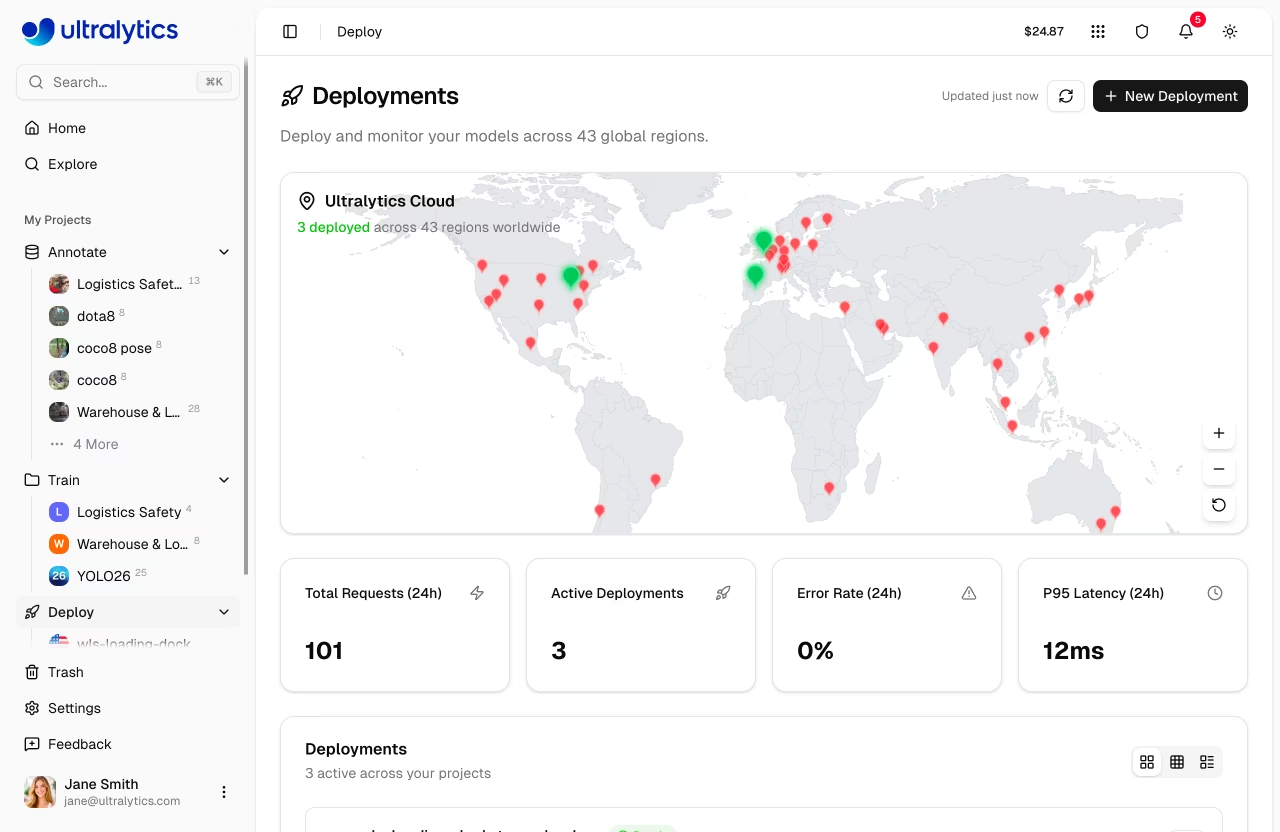
Link to this sectionDeployments Dashboard#
The Deploy page in the sidebar serves as the monitoring dashboard for all your deployments. It combines the world map, overview metrics, and deployment management in one view. See Dedicated Endpoints for creating and managing deployments.
graph TB
    subgraph Dashboard
        Map[World Map]:::proc --- Cards[Overview Cards]:::proc
        Cards --- List[Deployments List]:::decide
    end
    subgraph "Per Deployment"
        Metrics[Metrics Row]:::out
        Health[Health Check]:::out
        Logs[Logs Tab]:::out
        Code[Code Tab]:::out
        Predict[Predict Tab]:::out
    end
    List --> Metrics
    List --> Health
    List --> Logs
    List --> Code
    List --> Predict

    classDef proc fill:#2196F3,color:#fff
    classDef decide fill:#FF9800,color:#fff
    classDef out fill:#9C27B0,color:#fff
Link to this sectionOverview Cards#
Four summary cards at the top of the page show:
| Metric | Description |
|---|---|
| Total Requests (24h) | Requests across all endpoints |
| Active Deployments | Currently running endpoints |
| Error Rate (24h) | Percentage of failed requests |
| P95 Latency (24h) | 95th percentile response time |
The error rate card highlights in red when the rate exceeds 5%. Check the Logs tab on individual deployments to diagnose errors.
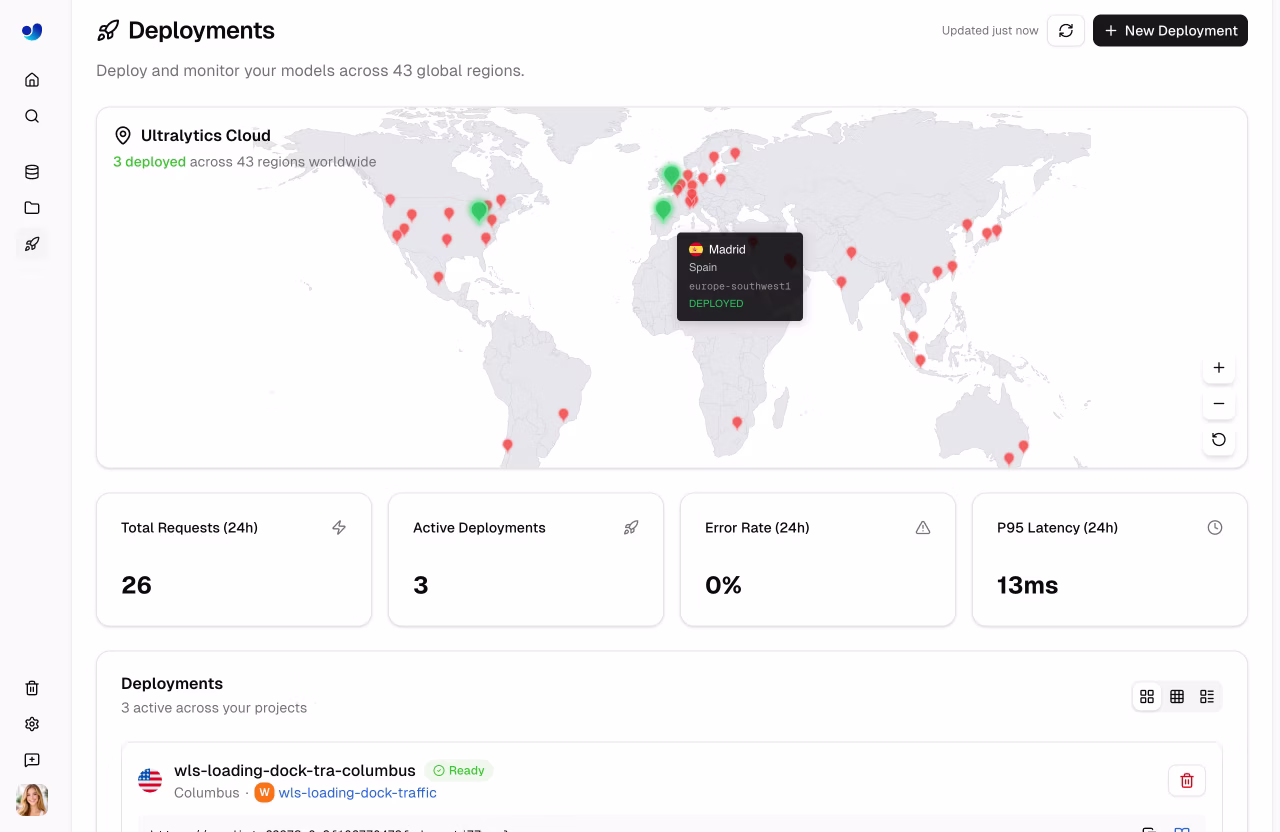
Link to this sectionWorld Map#
The interactive world map shows:
- Region pins for all 42 available regions
- Green pins for deployed regions
- Animated blue pins for regions with active deployments in progress
- Pin size varies based on deployment status and latency
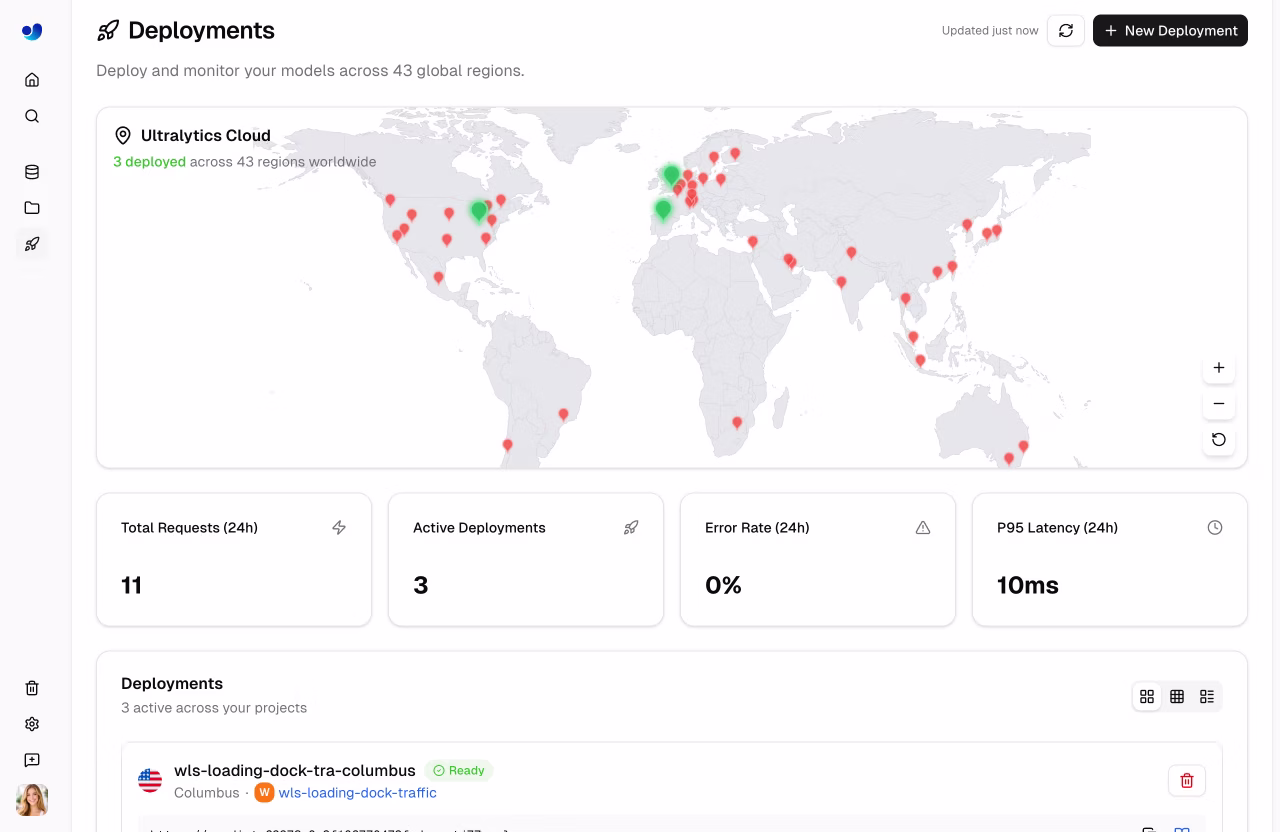
Link to this sectionDeployments List#
Below the overview cards, the deployments list shows all endpoints across your projects. Use the view mode toggle to switch between:
| View | Description |
|---|---|
| Cards | Full detail cards with metrics, logs, code, and predict tabs |
| Compact | Grid of smaller cards (1-4 columns) with key metrics |
| Table | DataTable with sortable columns: Name, Region, Status, Requests, P95, Errors |
The dashboard polls every 15 seconds for deployment status updates. When deployments are in a transitional state (creating, deploying, or stopping), polling increases to every 3 seconds. Metric charts refresh every 60 seconds. Click the refresh button for immediate updates.
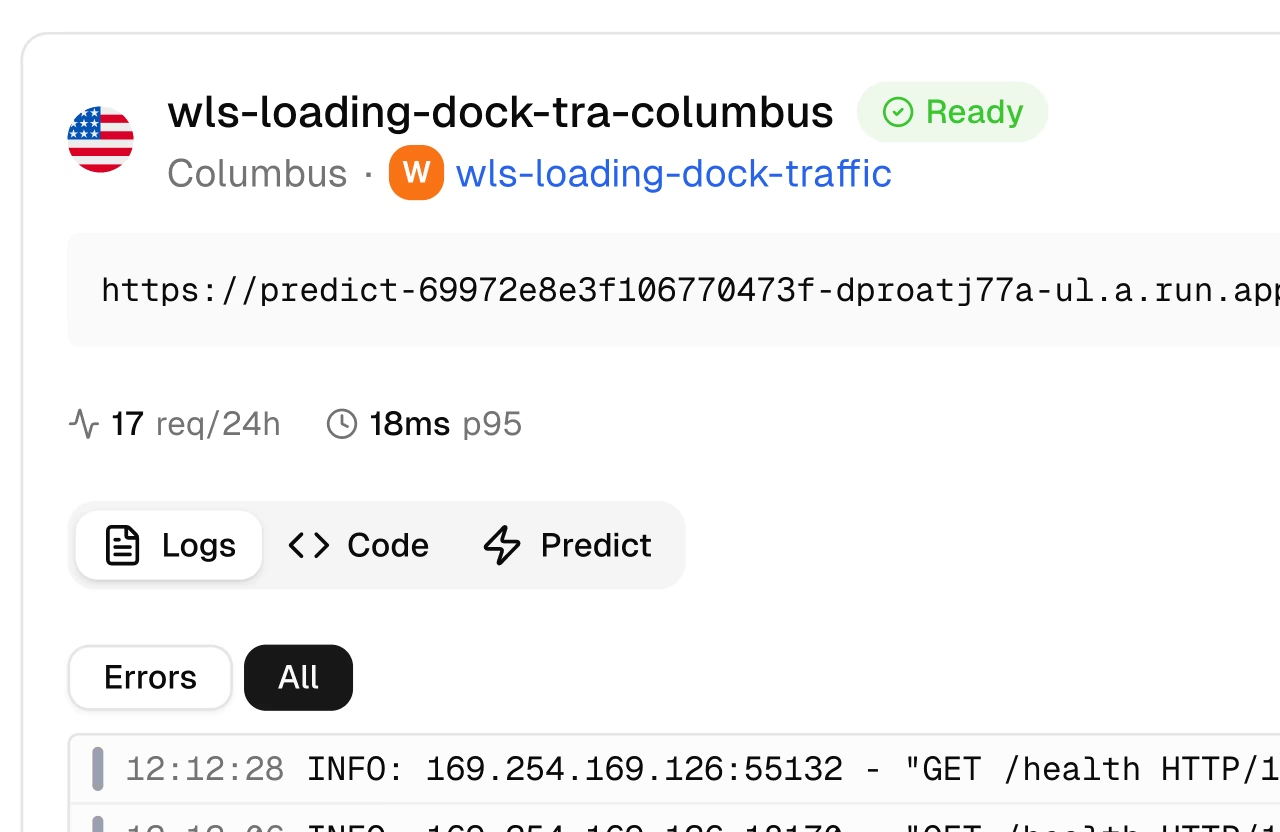
Link to this sectionPer-Deployment Metrics#
Each deployment card (in cards view) shows real-time metrics:
Link to this sectionMetrics Row#
| Metric | Description |
|---|---|
| Requests | Request count (24h) with icon |
| P95 Latency | 95th percentile response time |
| Error Rate | Percentage of failed requests |
Metrics are fetched from the sparkline API endpoint and refresh every 60 seconds.
Link to this sectionHealth Check#
Running deployments show a health check indicator:
| Indicator | Meaning |
|---|---|
| Green heart | Healthy — shows response latency |
| Red heart | Unhealthy — shows error message |
| Spinning icon | Health check in progress |
Health checks auto-retry every 20 seconds when unhealthy. Click the refresh icon to manually trigger a health check. The health check uses a 55-second timeout to accommodate cold starts on scale-to-zero endpoints.
The health check uses a 55-second timeout to account for cold starts on scale-to-zero endpoints (up to ~45 seconds in worst case). Once the endpoint warms up, health checks complete in milliseconds.
Link to this sectionLogs#
Each deployment card includes a Logs tab for viewing recent log entries:

Link to this sectionLog Entries#
Each log entry shows:
| Field | Description |
|---|---|
| Severity | Color-coded bar (see below) |
| Timestamp | Request time (local format) |
| Message | Log content |
| HTTP info | Status code and latency (if applicable) |
Filter logs by severity using the filter buttons:
| Level | Color | Description |
|---|---|---|
| DEBUG | Gray | Debug messages |
| INFO | Blue | Normal requests |
| WARNING | Yellow | Non-critical issues |
| ERROR | Red | Failed requests |
| CRITICAL | Dark Red | Critical failures |
The UI shows the 20 most recent entries. The API defaults to 50 entries per request (max 200).
When investigating errors: first click Errors to filter to ERROR and WARNING entries, then review timestamps and HTTP status codes. Copy logs to clipboard for sharing with your team.
Link to this sectionCode Examples#
Each deployment card includes a Code tab showing ready-to-use API code with your actual endpoint URL and API key:
import requests

# Deployment endpoint
url = "https://predict-abc123.run.app/predict"

# Headers with your deployment API key
headers = {"Authorization": "Bearer YOUR_API_KEY"}

# Inference parameters
data = {"conf": 0.25, "iou": 0.7, "imgsz": 640}

# Send image for inference
with open("image.jpg", "rb") as f:
    response = requests.post(url, headers=headers, data=data, files={"file": f})

print(response.json())When viewing the Code tab in the platform, your actual endpoint URL and API key are automatically filled in. Copy the code and run it directly. See API Keys to generate a key.
Link to this sectionDeployment Predict#
The Predict tab on each deployment card provides an inline predict panel — the same interface as the model's Predict tab, but running inference through the deployment endpoint instead of the shared service. This is useful for testing a deployed endpoint directly from the browser. See Inference for parameter details and response formats.
Link to this sectionAPI Endpoints#
Link to this sectionMonitoring Overview#
GET /api/monitoringReturns aggregated metrics for all deployments owned by the authenticated user. Workspace-aware via optional owner query parameter.
Link to this sectionDeployment Metrics#
GET /api/deployments/{deploymentId}/metrics?sparkline=true&range=24hReturns sparkline data and summary metrics for a specific deployment. Refresh interval: 60 seconds.
| Parameter | Type | Description |
|---|---|---|
sparkline | bool | Include sparkline data |
range | string | Time range: 1h, 6h, 24h, 7d, or 30d |
Link to this sectionDeployment Logs#
GET /api/deployments/{deploymentId}/logs?limit=50&severity=ERROR,WARNINGReturns recent log entries with optional severity filter and pagination.
| Parameter | Type | Description |
|---|---|---|
limit | int | Max entries to return (default: 50, max: 200) |
severity | string | Comma-separated severity filter |
pageToken | string | Pagination token from previous response |
Link to this sectionDeployment Health#
GET /api/deployments/{deploymentId}/healthReturns health check status with response latency.
{
    "healthy": true,
    "status": 200,
    "latencyMs": 142,
    "serverTiming": { "db": 8, "ping": 142, "total": 150 }
}
Link to this sectionPerformance Optimization#
Use monitoring data to optimize your deployments:
If latency is too high:
- Check instance count (may need more)
- Verify model size is appropriate
- Consider a closer region
- Check image sizes being sent
Switch from imgsz=1280 to imgsz=640 for a ~4x speedup with minimal accuracy loss for most use cases. Deploy to a region closer to your users for lower network latency.
Link to this sectionFAQ#
Link to this sectionHow long is data retained?#
| Data Type | Retention |
|---|---|
| Metrics | 30 days |
| Logs | 7 days |
Link to this sectionCan I set up external monitoring?#
Yes, endpoint URLs work with external monitoring tools:
- Uptime monitoring (Pingdom, UptimeRobot)
- APM tools (Datadog, New Relic)
- Custom health checks via the
/healthendpoint
Link to this sectionHow accurate are the latency numbers?#
Latency metrics measure:
- P50: Median response time
- P95: 95th percentile
- P99: 99th percentile
These represent server-side processing time, not including network latency to your users.
Link to this sectionWhy are my metrics delayed?#
Metrics have a ~2 minute delay due to:
- Metrics aggregation pipeline
- Aggregation windows
- Dashboard caching
For real-time debugging, check logs which are near-instant.
Link to this sectionCan I monitor multiple endpoints together?#
Yes, the deployments page shows all endpoints with aggregated overview cards. Use the table view to compare performance across deployments.