Link to this sectionDatasets#
Ultralytics Platform datasets provide a streamlined solution for managing your training data. After upload, the platform processes images, labels, and statistics automatically. A dataset is ready to train once processing has completed and it has at least one image in the train split, at least one image in either the val or test split, at least one labeled image, and a total of at least two images.
Link to this sectionUpload Dataset#
Ultralytics Platform accepts multiple upload formats for flexibility.
If you already have datasets in Ultralytics HUB or Roboflow, use Integrations to import them directly — no manual export or re-upload needed. Data in Google Cloud Storage, Amazon S3, or Azure Blob Storage can be used in place through Cloud storage. Enterprise workspaces can use On Premise to index and train on local data without sending pixels to Platform.
Link to this sectionSupported Formats#
| Format | Extensions | Notes | Max Size |
|---|---|---|---|
| JPEG | .jpg, .jpeg | Most common, recommended | 50 MB |
| PNG | .png | Supports transparency | 50 MB |
| WebP | .webp | Modern, good compression | 50 MB |
| BMP | .bmp | Uncompressed | 50 MB |
| TIFF | .tiff, .tif | High quality | 50 MB |
| HEIC | .heic | iPhone photos | 50 MB |
| AVIF | .avif | Next-gen format | 50 MB |
| JP2 | .jp2 | JPEG 2000 | 50 MB |
| DNG | .dng | Raw camera | 50 MB |
| MPO | .mpo | Multi-picture object | 50 MB |
Link to this sectionBrowser Codec Support#
The file extension alone isn't enough: a video can still fail if its container or codec isn't supported by your browser.
H.264 video in an MP4 container has the broadest support across major browsers and is the safest choice. If a video won't upload, re-encode it with FFmpeg:
ffmpeg -i input.mov \
  -c:v libx264 -pix_fmt yuv420p \
  -c:a aac -movflags +faststart \
  output.mp4
Which video codecs work
These are the codecs Chromium-based browsers typically decode. Safari and Firefox may differ, so don't treat the Yes/No values below as universal browser support:
| Codec | Decodes in Chrome | Notes |
|---|---|---|
| H.264 (AVC) | Yes | Recommended — widest browser support |
| VP8, VP9, AV1 | Yes | Royalty-free; common in WebM and MKV |
| HEVC (H.265) | Hardware only | Only on devices with an HEVC decoder |
| ProRes, MPEG-2, DivX/Xvid, MJPEG, … | No | Re-encode to H.264 |
Link to this sectionPreparing Your Dataset#
The Platform supports Ultralytics YOLO, COCO, Ultralytics NDJSON, and raw (unannotated) uploads:
Use the standard YOLO directory structure with a data.yaml file:
my-dataset/
├── images/
│   ├── train/
│   │   ├── img001.jpg
│   │   └── img002.jpg
│   └── val/
│       ├── img003.jpg
│       └── img004.jpg
├── labels/
│   ├── train/
│   │   ├── img001.txt
│   │   └── img002.txt
│   └── val/
│       ├── img003.txt
│       └── img004.txt
└── data.yaml
The YAML file defines your dataset configuration:
# data.yaml
path: .
train: images/train
val: images/val

names:
    0: person
    1: car
2: dogRaw: Upload unannotated images (no labels). Useful when you plan to annotate directly on the platform using the annotation editor.
You can also upload images without explicit split folders. Platform respects the active split target during upload, and for non-classify datasets it may automatically create a validation split from part of the training set when no split information is provided. You can always reassign images later with bulk move-to-split or split redistribution.
The format is detected automatically: datasets with a data.yaml containing names, train, or val keys are treated as YOLO. Datasets with COCO JSON files (containing images, annotations, and categories arrays) are treated as COCO. .ndjson exports are imported as Ultralytics NDJSON. Datasets with only images and no annotations are treated as raw.
For task-specific format details, see supported tasks and the Datasets Overview.
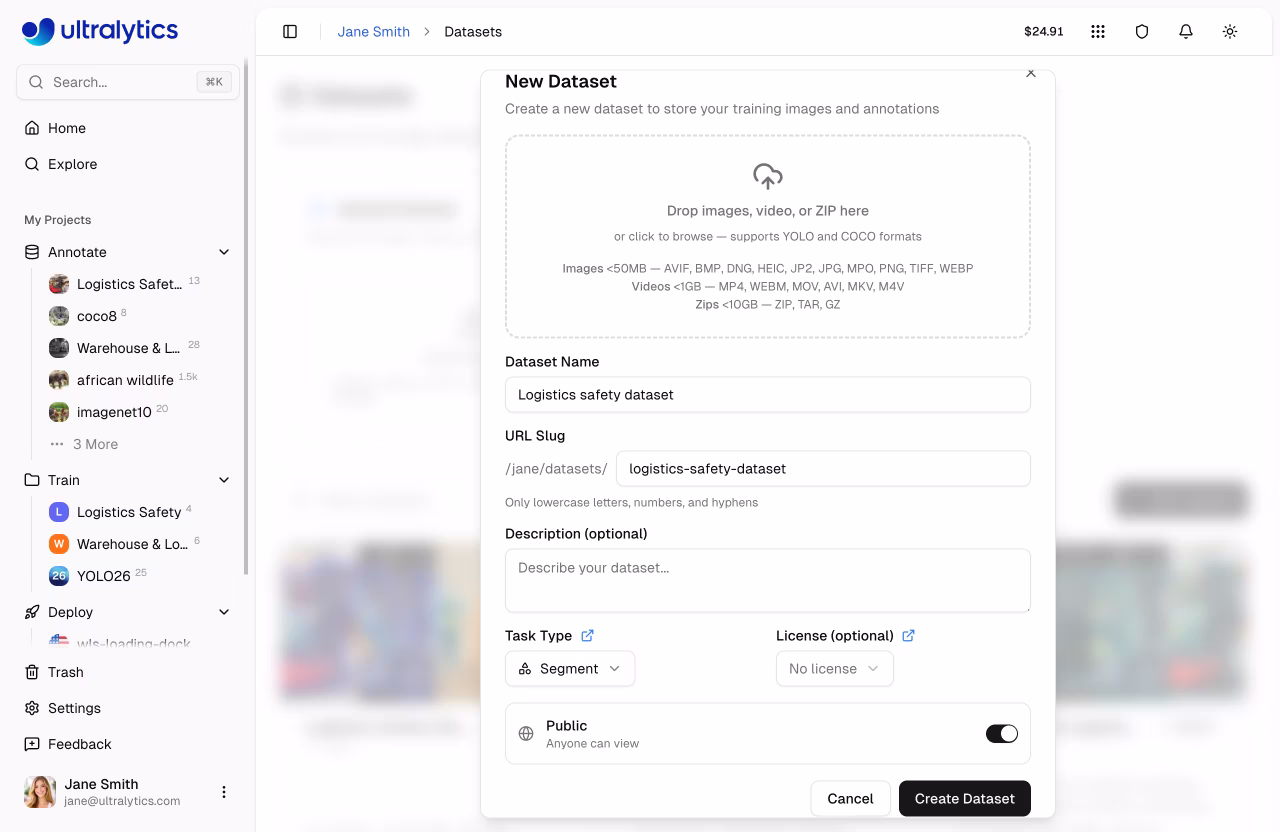
Link to this sectionUpload Process#
- Navigate to
Datasetsin the sidebar - Click
New Datasetor drag files into the upload zone - Select the task type (see supported tasks)
- Add a name and optional description
- Set visibility (public or private) and optional license (see available licenses)
- Click
Create & Upload(orCreate Datasetif creating an empty dataset)
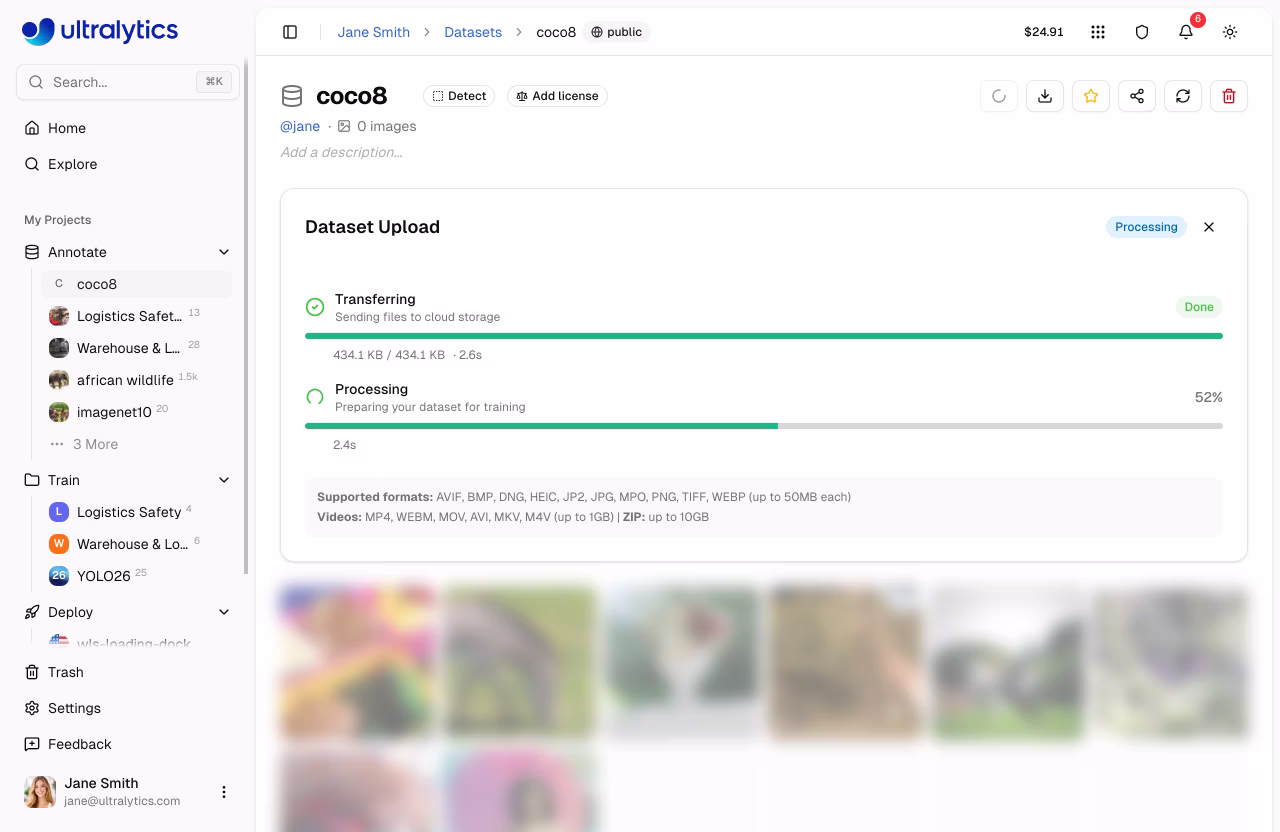
After upload, the platform processes your data through a multi-stage pipeline:
graph LR
    A[Upload]:::start --> B[Validate]:::proc
    B --> C[Normalize]:::proc
    C --> D[Thumbnail]:::proc
    D --> E[Parse Labels]:::proc
    E --> F[Statistics]:::out

    classDef start fill:#4CAF50,color:#fff
    classDef proc fill:#2196F3,color:#fff
classDef out fill:#9C27B0,color:#fff- Validation: Format and size checks
- Normalization: Large images resized (max 4096px, min dimension 28px)
- Thumbnails: 256px WebP previews generated
- Label Parsing: YOLO and COCO format labels extracted
- Statistics: Class distributions and image dimensions computed
Validate Before Upload
You can validate your dataset locally before uploading:
from ultralytics.data.utils import check_det_dataset

check_det_dataset("path/to/data.yaml")Images must be at least 28px on their shortest side. Images smaller than this are rejected during processing. Images larger than 4096px on their longest side are automatically resized with aspect ratio preserved.
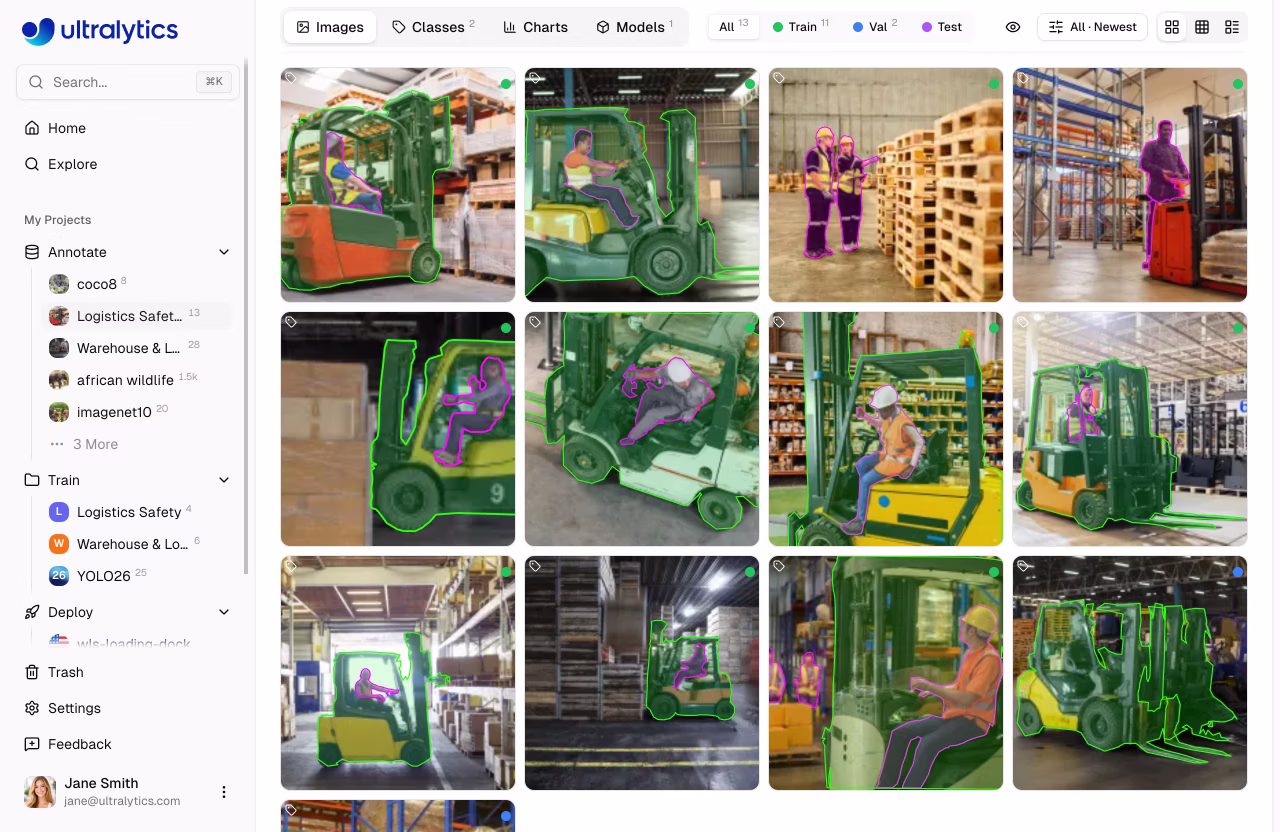
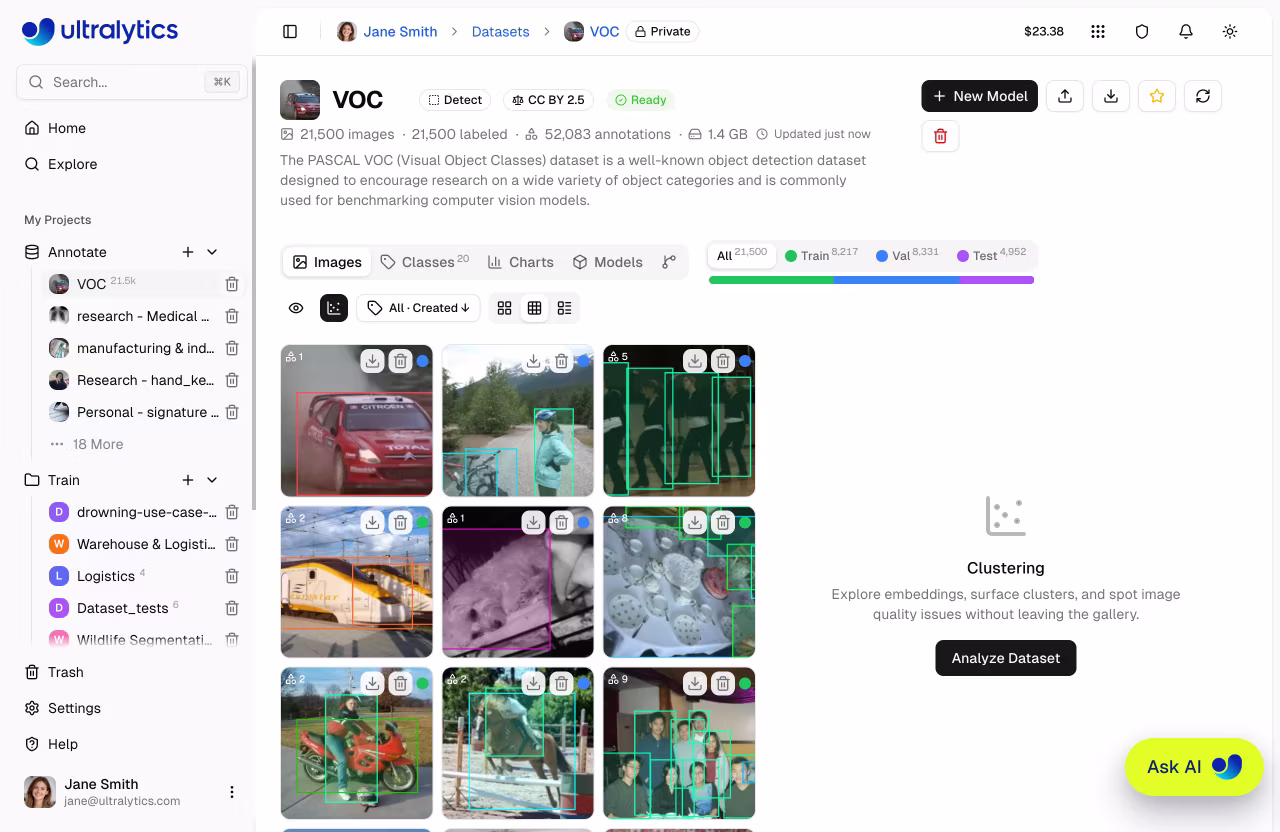
Link to this sectionBrowse Images#
View your dataset images in multiple layouts.
Open the Clustering panel from the gallery toolbar to explore your dataset as an interactive 2D scatter plot.
| View | Description |
|---|---|
| Grid | Thumbnail grid with annotation overlays (default) |
| Compact | Smaller thumbnails for quick scanning |
| Table | List with thumbnail, filename, dimensions, size, split, classes, and label counts |
Link to this sectionSorting and Filtering#
Images can be sorted and filtered for efficient browsing:
| Sort | Description |
|---|---|
| Newest / Oldest | Upload / creation order |
| Name A-Z / Z-A | Filename alphabetical |
| Height ↑/↓ | Image height in pixels |
| Width ↑/↓ | Image width in pixels |
| Size ↑/↓ | File size on disk |
| Annotations ↑/↓ | Annotation count per image |
For datasets over 100,000 images, name / size / width / height sorts are disabled to keep the gallery responsive. Newest, oldest, and annotation-count sorts remain available.
Use the Annotations filter set to Unannotated to quickly find images that still need annotation. This is especially useful for large datasets where you want to track labeling progress.
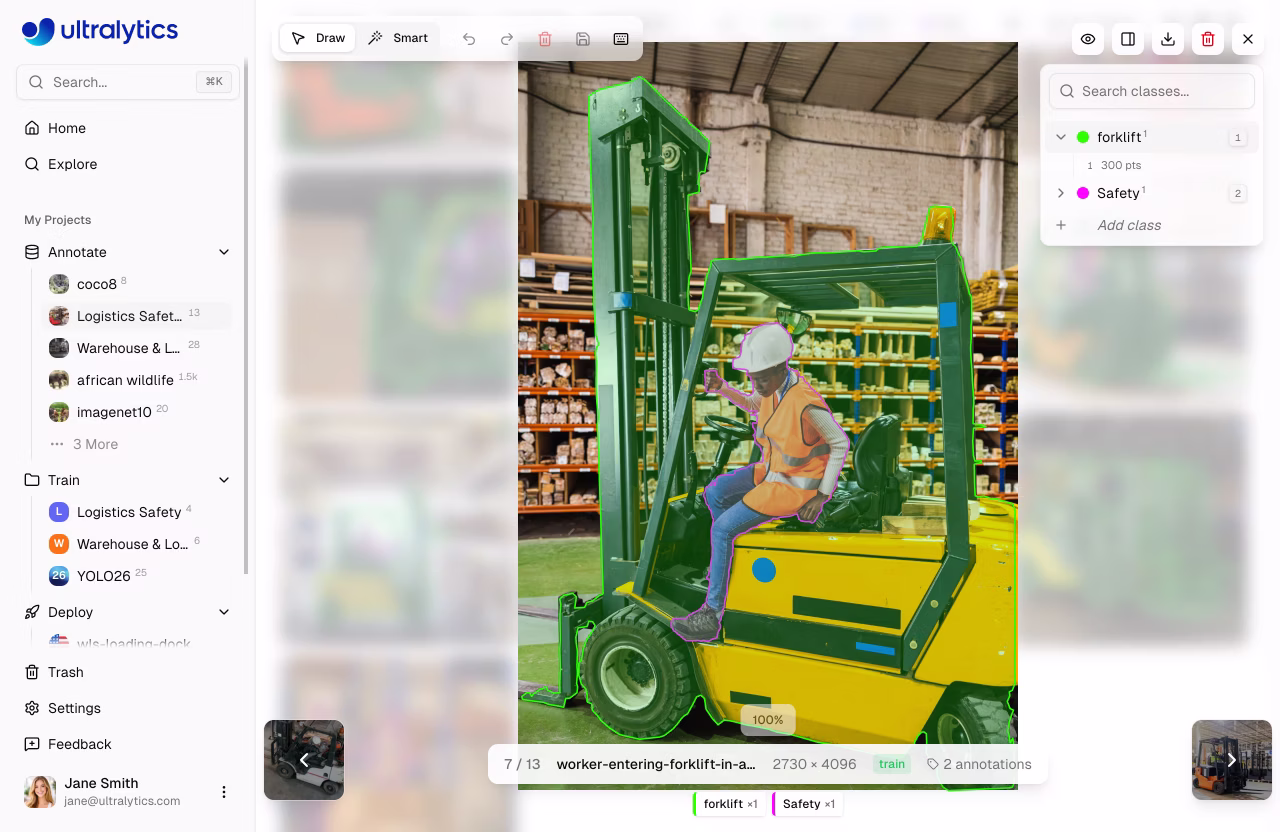
Link to this sectionFullscreen Viewer#
Click any image to open the fullscreen viewer with:
- Navigation: Arrow keys or thumbnail previews to browse
- Metadata: Filename, dimensions, split badge, annotation count
- Annotations: Toggle annotation overlay visibility
- Class Breakdown: Per-class label counts with color indicators
- Edit: Enter annotation mode to add or modify labels
- Download: Download the original image file
- Delete: Delete the image from the dataset
- Zoom:
Cmd/Ctrl+Scroll,Cmd/Ctrl++, orCmd/Ctrl+=to zoom in, andCmd/Ctrl+-to zoom out - Reset view:
Cmd/Ctrl + 0or the reset button to fit the image to the viewer - Pan: Hold
Spaceand drag to pan the canvas when zoomed - Pixel view: Toggle pixelated rendering for close inspection
Link to this sectionFilter by Split#
Filter images by their dataset split:
| Split | Purpose |
|---|---|
| Train | Used for model training |
| Val | Used for validation during training |
| Test | Used for final evaluation |
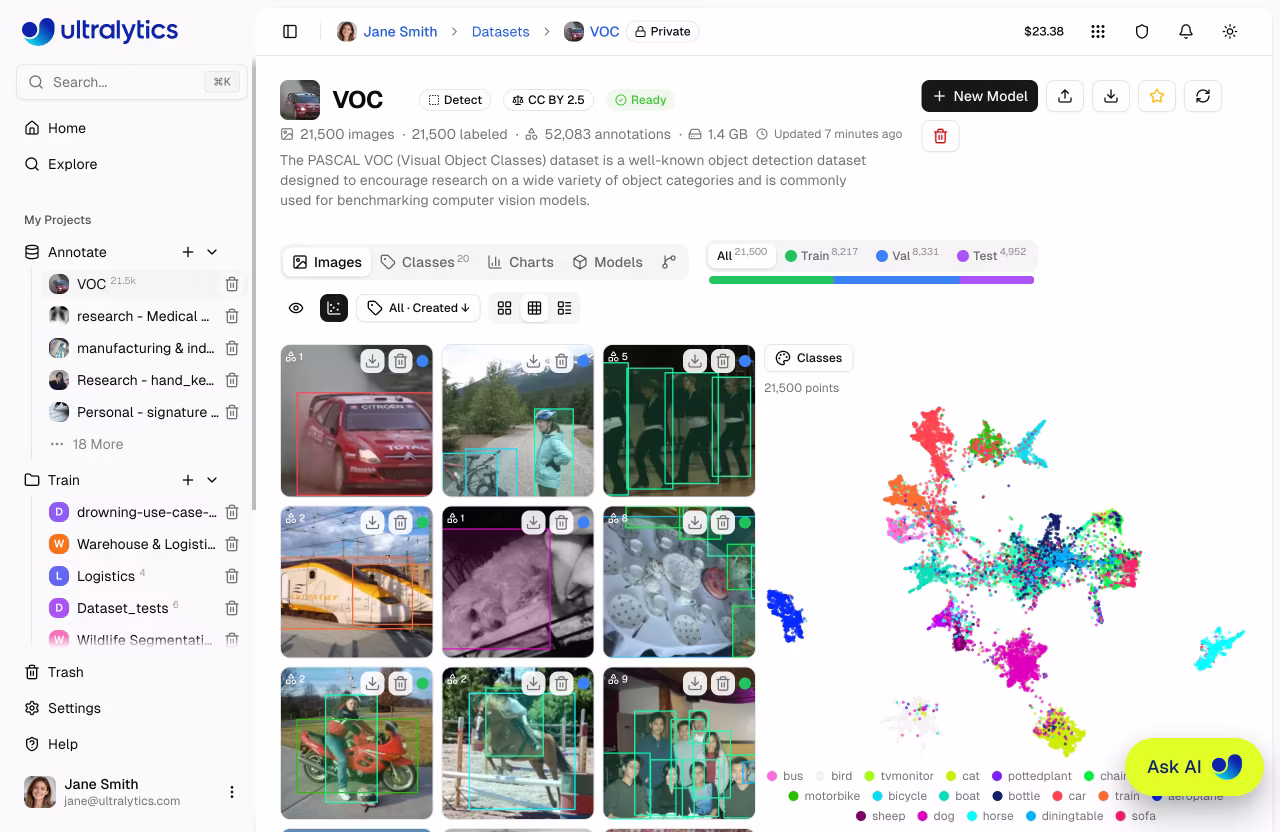
Link to this sectionClustering#
The Clustering panel projects your dataset into an interactive 2D scatter plot where visually similar images sit close together. Use it to surface clusters, spot duplicates and outliers, and inspect how splits or classes are distributed across your data — without leaving the gallery. Open it from the scatter-chart icon in the gallery toolbar on any dataset page.
Link to this sectionRunning Analysis#
Start an analysis:
- Open a dataset and click the scatter-chart icon in the gallery toolbar
- Click
Analyze Dataset - Wait for the progress bar to finish — results appear in the same panel
Analysis runs in the background and can take a few minutes depending on the size of your dataset. You can close the panel or leave the page and come back later.
Link to this sectionVisualization#
Once analysis completes, the panel shows a 2D scatter of all analyzed images. Gallery filters (split, class, labeled/unlabeled) dim out-of-filter points so you can focus on the subset you care about.
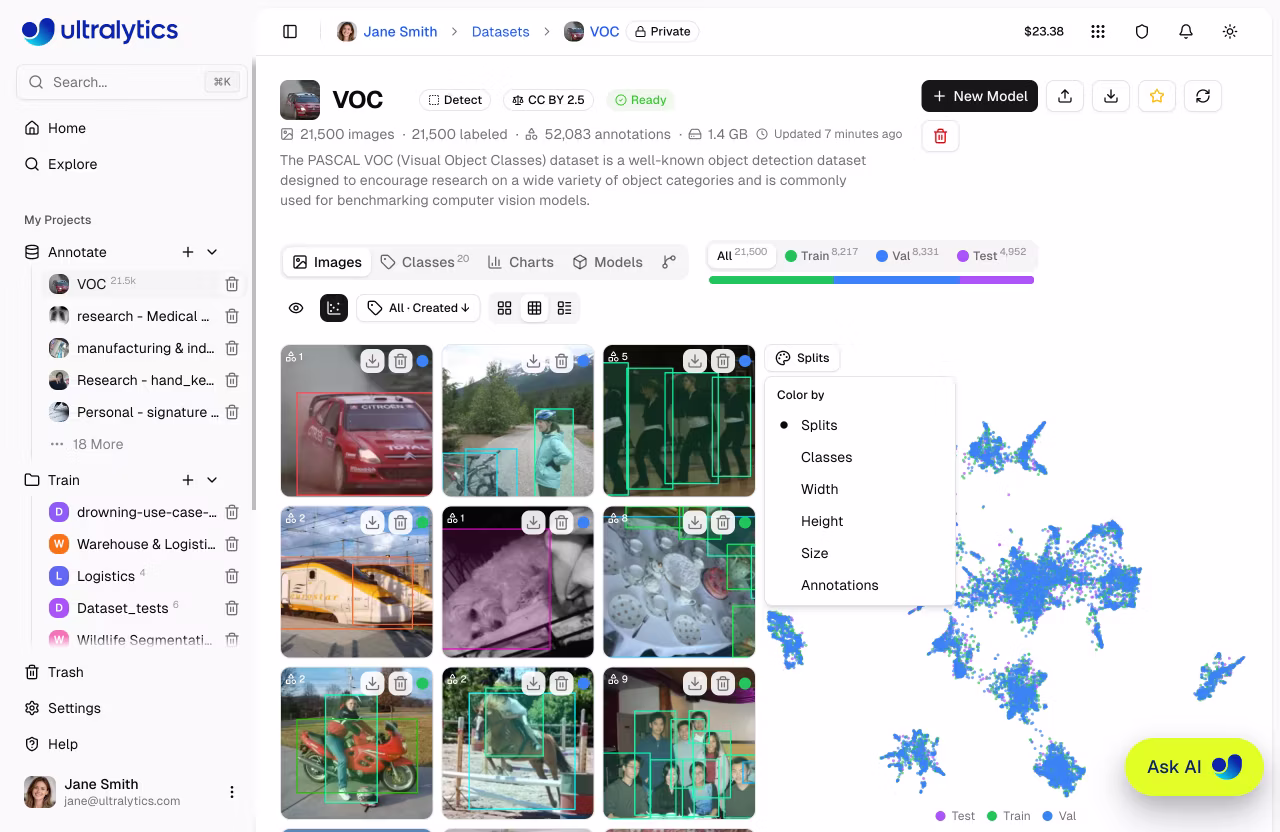
Link to this sectionColor By#
Change how data points are shaded with the Color by dropdown in the panel toolbar. Switch view modes at any time — the plot re-colors instantly so you can see how splits, classes, or image properties are distributed across your clusters:
| Option | Shading |
|---|---|
| Splits | Train / Val / Test |
| Classes | First annotation class on each image |
| Width | Image width |
| Height | Image height |
| Size | File size |
| Annotations | Number of annotations per image |
Link to this sectionLasso Selection#
Draw a free-form selection around a region to highlight points on the plot. The gallery filters down to the matching images, so you can inspect, relabel, move, or delete them using the usual image operations.
A chip above the chart shows how many points are selected — click the × to clear the lasso and return to the full gallery view.
Link to this sectionPan and Zoom#
Navigate large scatters directly from your mouse and keyboard:
| Input | Action |
|---|---|
| Scroll | Pan the plot in 2D |
| Cmd/Ctrl+Scroll | Zoom in or out, anchored at the cursor |
| Hold Space | Switch to drag-to-pan mode |
Link to this sectionRe-analyzing#
If your dataset changes after analysis, a Re-analyze button appears at the top of the panel for owners and editors.
Click Re-analyze to recompute embeddings and the 2D projection from scratch.
Link to this sectionDataset Tabs#
Each dataset page can show up to six tabs, depending on the dataset state and your permissions:
Link to this sectionImages Tab#
The default view showing the image gallery with annotation overlays. Supports grid, compact, and table view modes. Drag and drop files here to add more images.
Link to this sectionClasses Tab#
This tab appears when the dataset has images.
Manage annotation classes for your dataset:
- Class histogram: Bar chart showing annotation count per class with linear/log scale toggle
- Class table: Sortable, searchable table with class name, label count, and image count
- Edit class names: Click any class name to rename it inline
- Edit class colors: Click a color swatch to change the class color
- Add new class: Use the input at the bottom to add classes
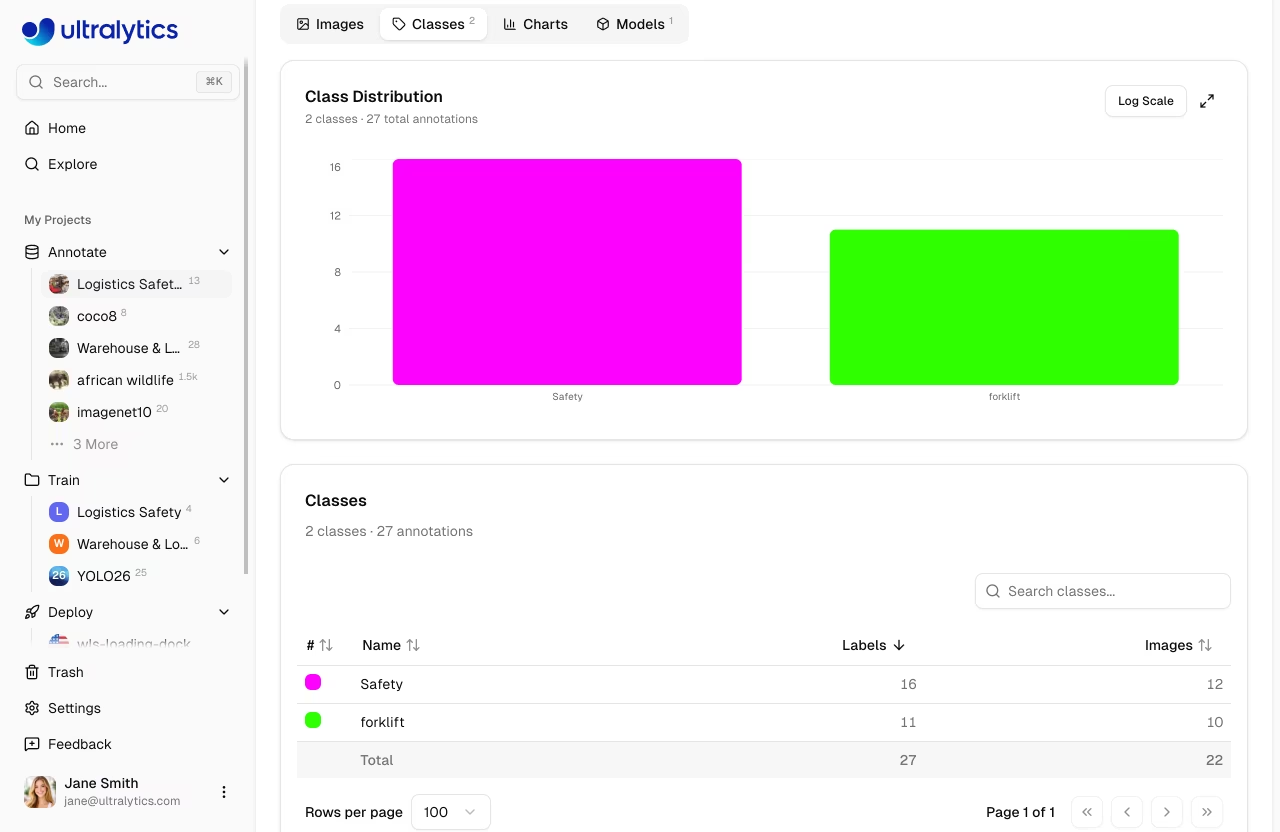
If your dataset has class imbalance (e.g., 10,000 "person" annotations but only 50 "bicycle"), use the Log Scale toggle on the class histogram to visualize all classes clearly.
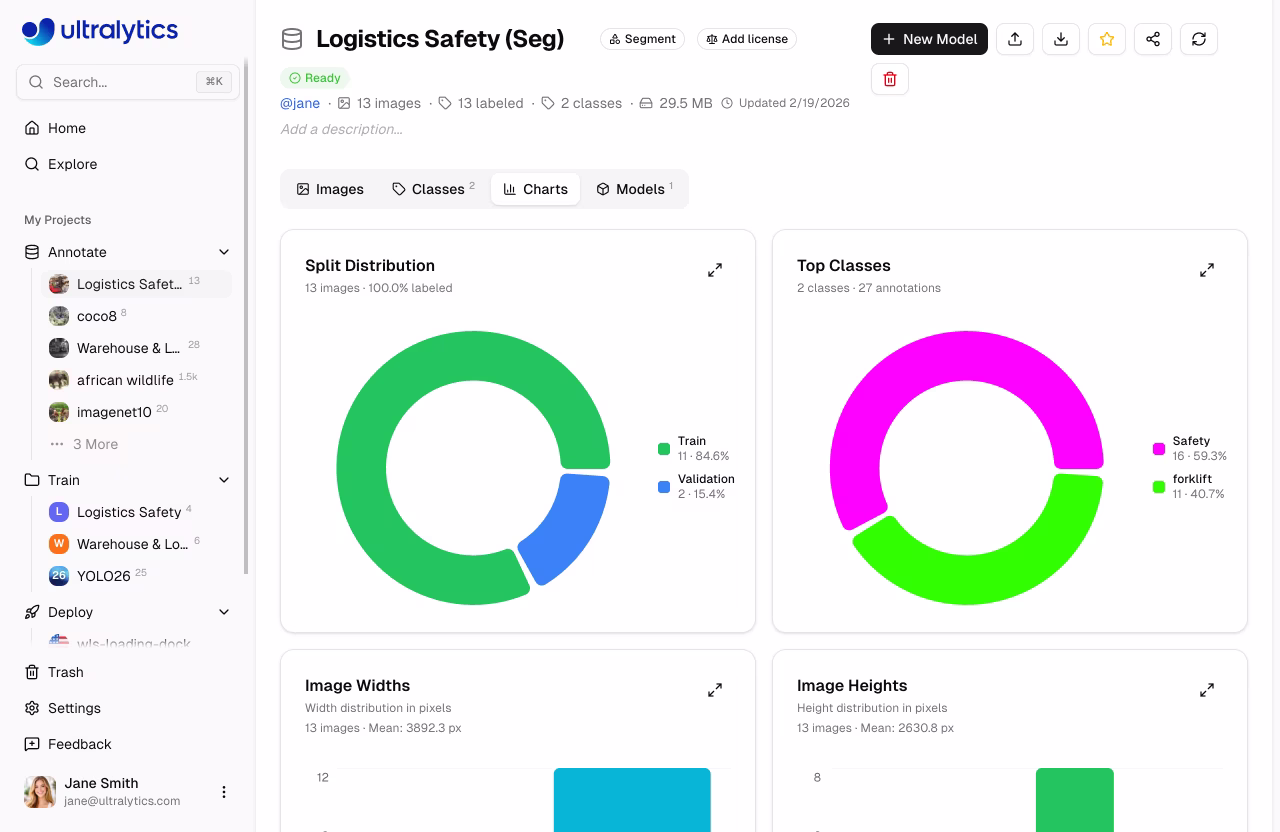
Link to this sectionCharts Tab#
This tab appears when the dataset has images.
Automatic statistics computed from your dataset:
| Chart | Description |
|---|---|
| Split Distribution | Donut chart of train/val/test image counts and labeled percent |
| Top Classes | Donut chart of the 10 most frequent annotation classes |
| Image Dimensions | Histogram of image width and height distribution (overlaid) with mean |
| Points per Instance | Polygon vertex or keypoint count per annotation (segment/pose) |
| Annotation Locations | 2D heatmap of bounding box center positions |
| Image File Size | Histogram of image file size distribution |
| Image Formats | Distribution of source image formats (JPG, PNG, etc.) |
| Bounding Box Dimensions | Histogram of bounding box width and height (overlaid) |
| Objects per Image | Histogram of annotation count per image |
| Image Dimensions 2D | 2D width vs height heatmap with aspect ratio guide lines |
Statistics are cached for 5 minutes. Changes to annotations will be reflected after the cache expires.
Click the expand button on any heatmap to view it in fullscreen mode. This provides a larger, more detailed view — useful for understanding spatial patterns in large datasets.
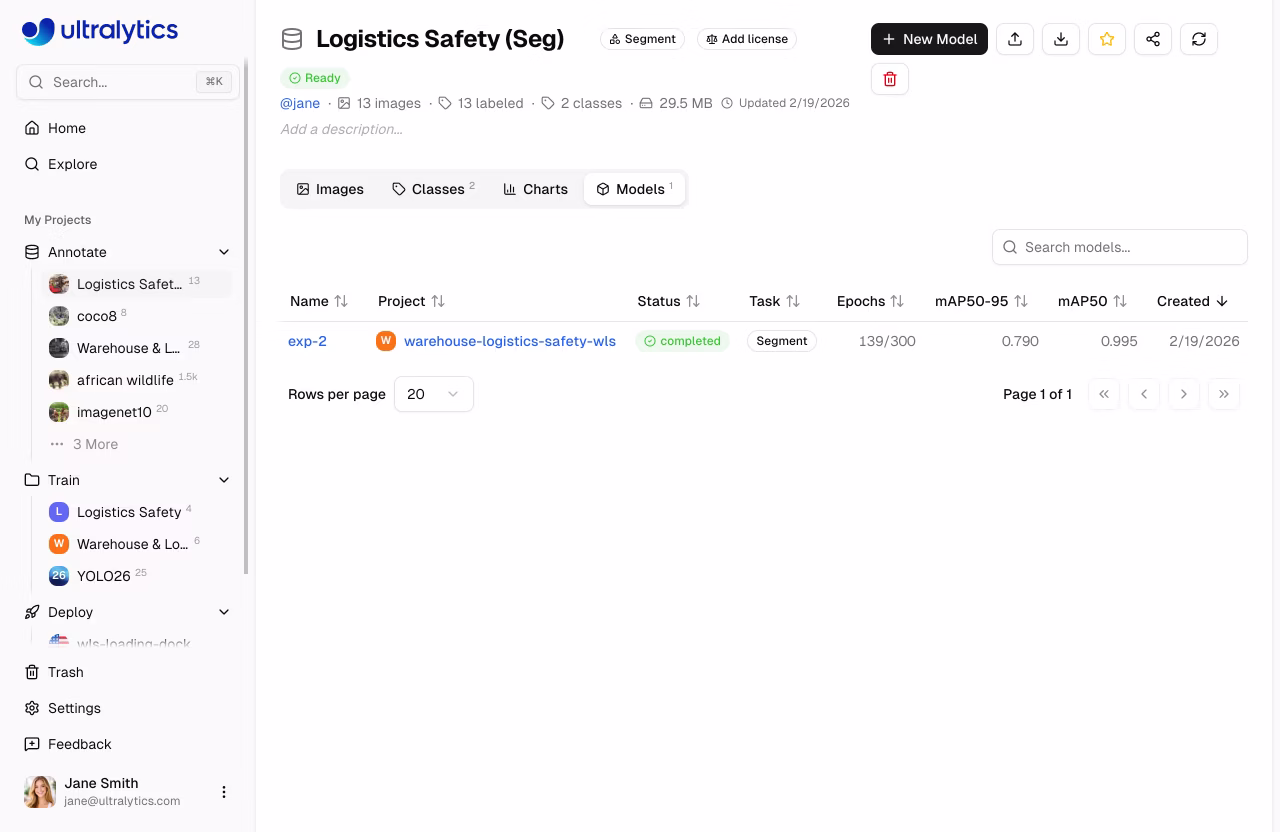
Link to this sectionModels Tab#
View all models trained on this dataset in a searchable table:
| Column | Description |
|---|---|
| Name | Model name with link |
| Project | Parent project with icon |
| Version | Immutable dataset version used for training, if any |
| Status | Training status badge |
| Task | YOLO task type |
| Epochs | Best epoch / total epochs |
| mAP50-95 | Mean average precision |
| mAP50 | mAP at IoU 0.50 |
| Created | Creation date |
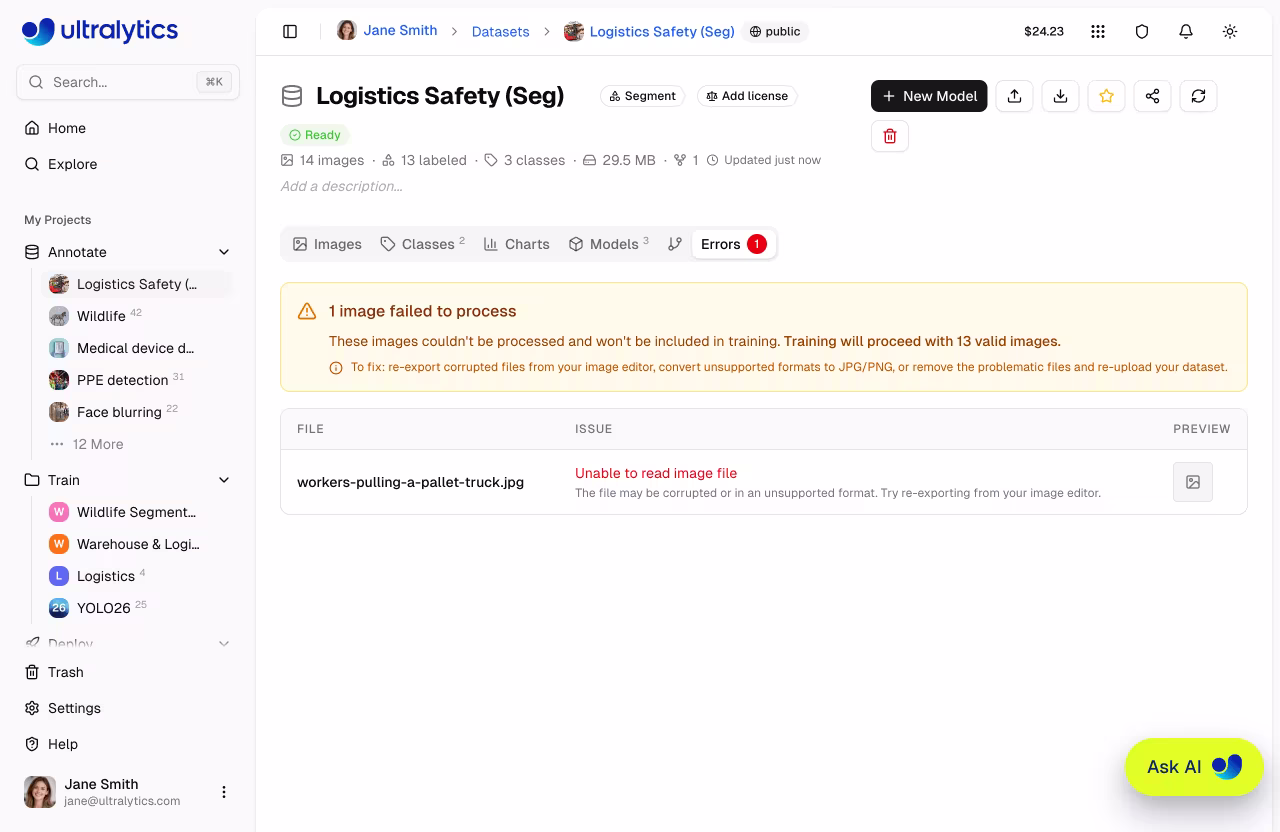
Link to this sectionErrors Tab#
This tab appears only when one or more files fail processing.
Images that failed processing are listed here with:
- Error banner: Total count of failed images and guidance
- Error table: Filename, user-friendly error description, fix hints, and preview thumbnail
- Common errors include corrupted files, unsupported formats, images too small (min 28px), and unsupported color modes
Common Processing Errors
| Error | Cause | Fix |
|---|---|---|
| Unable to read image file | Corrupted or unsupported format | Re-export from image editor |
| Incomplete or corrupted | File was truncated during transfer | Re-download the original file |
| Image too small | Minimum dimension below 28px | Use higher resolution source images |
| Unsupported color mode | CMYK or indexed color mode | Convert to RGB mode |
Link to this sectionVersions Tab#
Create immutable NDJSON snapshots of your dataset for reproducible training. Each version captures image counts, class counts, annotation counts, and file size at the time of creation.
| Column | Description |
|---|---|
| Version | Version number (v1, v2, ...) |
| Description | User-provided description (editable) |
| Images | Image count at time of snapshot |
| Classes | Class count at time of snapshot |
| Annotations | Annotation count at time of snapshot |
| Size | NDJSON export file size |
| Created | When the version was created |
To create a version:
- Open the Versions tab
- Optionally enter a description (e.g., "Added 500 training images" or "Fixed mislabeled classes")
- Click + New Version
- The new version appears in the table
- Download the version separately from the table when needed
Each version is numbered sequentially (v1, v2, v3...) and stored permanently. You can download any previous version at any time from the versions table.
Enable Save Dataset Version in the Cloud Training dialog to link a model to the exact dataset used for training. The Platform reuses a matching version when the dataset contents have not changed and creates a new version only when they have.
Version creation is available after the dataset reaches ready status.
Create a version before and after major changes to your dataset — adding images, fixing annotations, or rebalancing splits. This lets you compare model performance across different dataset states.
The size shown is the NDJSON export file size, which contains image URLs and annotations — not the images themselves. Actual image data is stored separately and accessed via signed URLs.
Link to this sectionExport Dataset#
Export your dataset for offline use with an NDJSON download from the dataset header or the Versions tab.
To export:
- Click the Download button (download icon) in the dataset header
- Download the current NDJSON snapshot directly
- Use the Versions tab when you want an immutable numbered snapshot you can re-download later
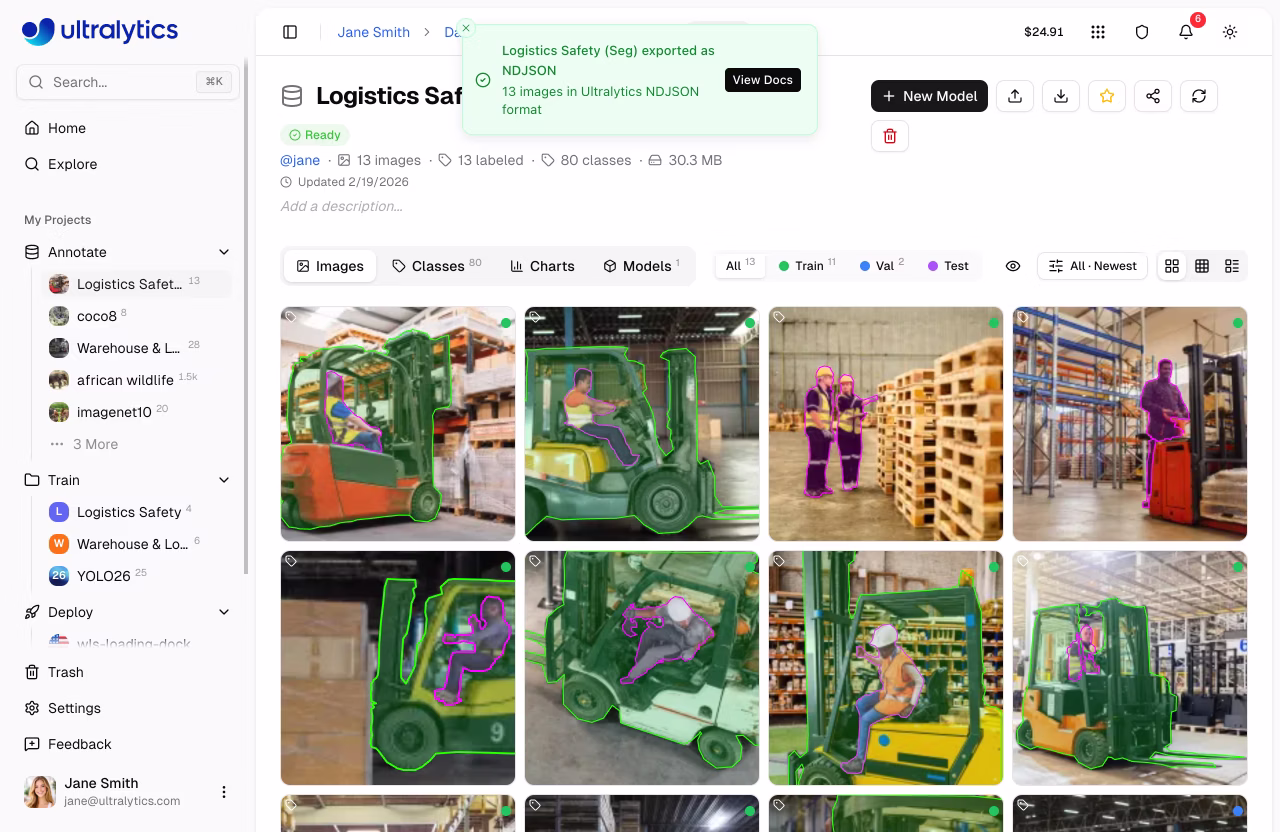
The NDJSON format stores one JSON object per line. The first line contains dataset metadata, followed by one line per image:
{"type": "dataset", "task": "detect", "name": "my-dataset", "description": "...", "bytes": 12345678, "url": "https://platform.ultralytics.com/...", "class_names": {"0": "person", "1": "car"}, "version": 1, "created_at": "2026-01-15T10:00:00Z", "updated_at": "2026-02-20T14:30:00Z"}
{"type": "image", "file": "img001.jpg", "url": "https://...", "width": 640, "height": 480, "split": "train", "annotations": {"boxes": [[0, 0.5, 0.5, 0.2, 0.3]]}}
{"type": "image", "file": "img002.jpg", "url": "https://...", "width": 1280, "height": 720, "split": "val"}Image URLs in the exported NDJSON are signed and valid for 7 days. If you need fresh URLs, re-export the dataset or create a new version.
See the Ultralytics NDJSON format documentation for full specification.
Link to this sectionImage Operations#
Link to this sectionQuick Actions#
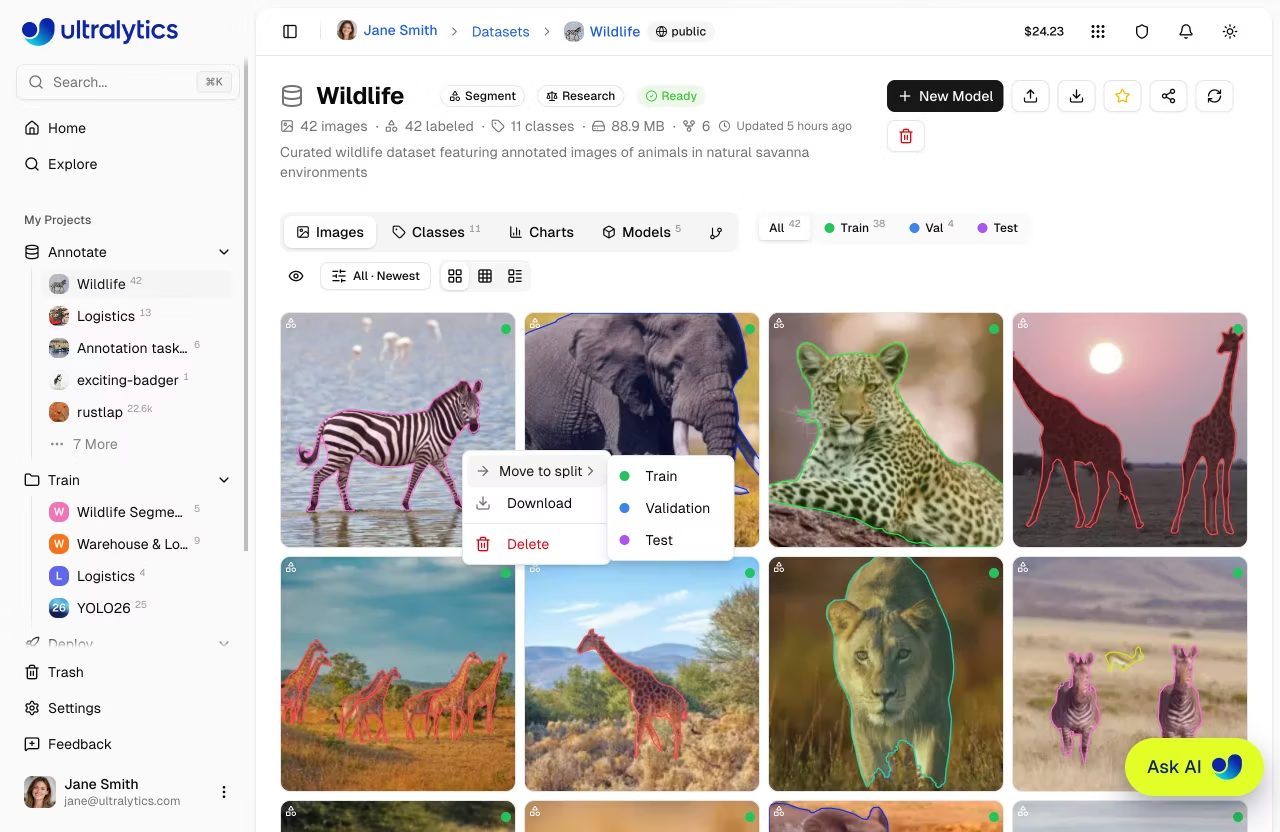
Right-click any image in Grid or Compact view to access quick actions:
| Action | Description |
|---|---|
| Move to Split | Reassign the image to Train, Val, or Test split |
| Download | Download the original image file |
| Delete | Delete the image from the dataset |
The image context menu operates on a single image. For bulk operations on multiple images, use Table view with checkbox selection.
Link to this sectionBulk Move to Split#
Reassign selected images to a different split within the same dataset:
- Switch to Table view
- Select images using checkboxes
- Right-click to open the context menu
- Choose
Move to split> Train, Validation, or Test
You can also drag and drop images onto the split filter tabs in grid view.
Upload all images to one dataset, then use bulk move-to-split to organize subsets into train, validation, and test splits.
Link to this sectionSplit Redistribution#
Redistribute all images across train, validation, and test splits using custom ratios:
- Click the split bar in the dataset toolbar to open the Redistribute Splits dialog
- Adjust split percentages using any of the methods below
- Review the live image count preview to confirm the distribution
- Click Apply to randomly reassign all images according to your percentages
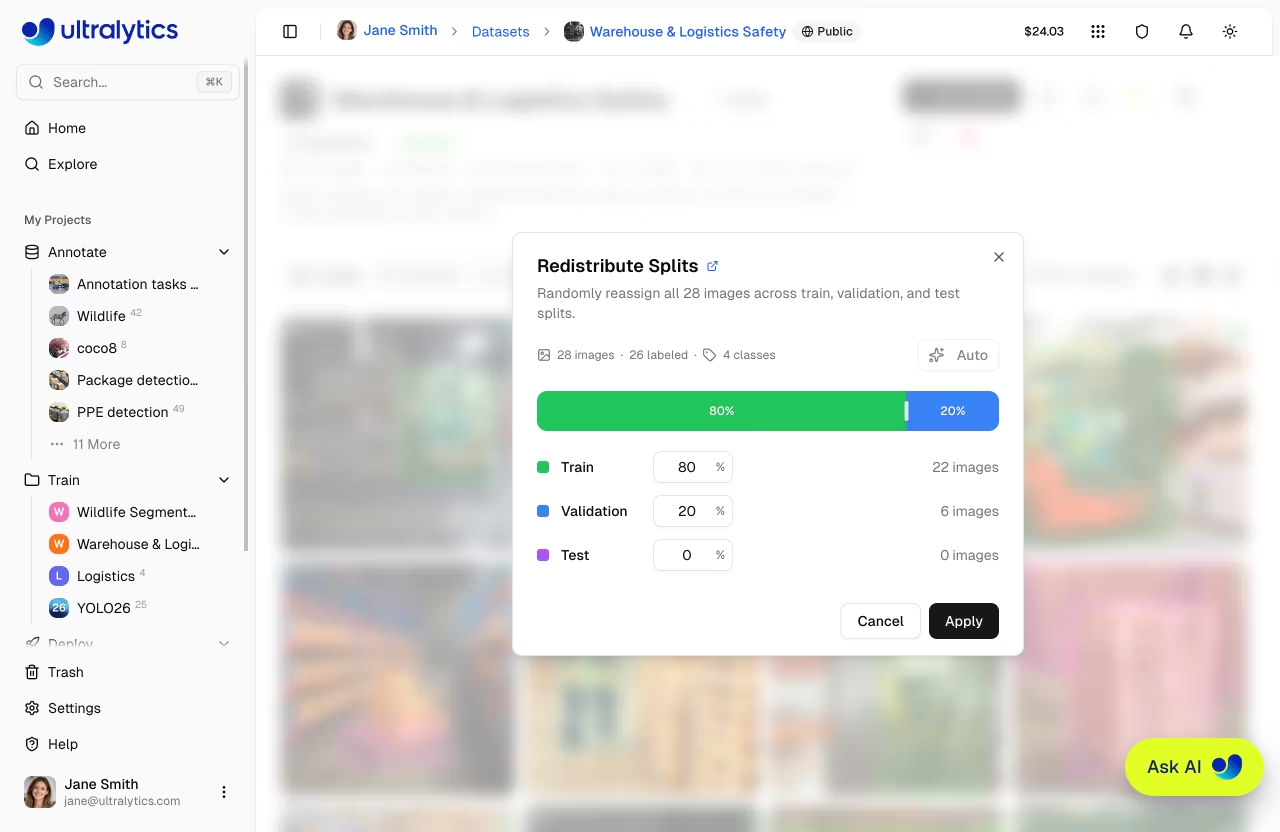
The dialog provides three ways to set your target split ratios:
| Method | Description |
|---|---|
| Drag | Drag the handles between the colored segments to visually adjust split boundaries |
| Type | Edit the percentage input for any split (the other two splits auto-rebalance proportionally) |
| Auto | One-click to instantly set an 80/20 train/validation split with the test split set to 0% |
A live preview shows exactly how many images will land in each split before you apply.
Click the Auto button to instantly set the recommended 80/20 train/validation split. This is the most common ratio for training.
Link to this sectionBulk Delete#
Delete multiple images at once:
- Select images in the table view
- Right-click and choose
Delete - Confirm deletion
Link to this sectionDataset URI#
Reference Platform datasets using the ul:// URI format (see Using Platform Datasets):
ul://username/datasets/dataset-slugYou can also paste a dataset or model web URL directly (e.g. https://platform.ultralytics.com/username/datasets/dataset-slug); it is automatically rewritten to the ul:// URI. Passing a list of datasets fine-tunes one base model across each in series, for example model.train(data=["ul://username/datasets/a", "ul://username/datasets/b"]).
Use this URI to train models from anywhere:
export ULTRALYTICS_API_KEY="YOUR_API_KEY"
yolo train model=yolo26n.pt data=ul://username/datasets/my-dataset epochs=100The ul:// URI works from any environment:
- Local machine: Train on your hardware, data downloaded automatically
- Google Colab: Access your Platform datasets in notebooks
- Remote servers: Train on cloud VMs with full dataset access
Link to this sectionAvailable Licenses#
The Platform supports the following licenses for datasets:
| License | Type |
|---|---|
| None | No license selected |
| CC0-1.0 | Public domain |
| CC-BY-2.5 | Permissive |
| CC-BY-4.0 | Permissive |
| CC-BY-SA-4.0 | Copyleft |
| CC-BY-NC-4.0 | Non-commercial |
| CC-BY-NC-SA-4.0 | Copyleft |
| CC-BY-ND-4.0 | No derivatives |
| CC-BY-NC-ND-4.0 | Non-commercial |
| Apache-2.0 | Permissive |
| MIT | Permissive |
| AGPL-3.0 | Copyleft |
| GPL-3.0 | Copyleft |
| Research-Only | Restricted |
| Other | Custom |
When cloning a dataset with a copyleft license (AGPL-3.0, GPL-3.0, CC-BY-SA-4.0, CC-BY-NC-SA-4.0), the clone inherits the license and the license selector is locked.
Link to this sectionVisibility Settings#
Control who can see your dataset:
| Setting | Description |
|---|---|
| Private | Only you can access |
| Public | Anyone can view on Explore page |
Visibility is set when creating a dataset in the New Dataset dialog using a toggle switch. Public datasets are visible on the Explore page.
Link to this sectionEdit Dataset#
Dataset metadata is edited inline directly on the dataset page — no dialog needed:
- Name: Click the dataset name to edit it. Changes auto-save on blur or
Enter. - Description: Click the description (or "Add a description..." placeholder) to edit. Changes auto-save.
- Task type: Click the task badge to select a different task type.
- License: Click the license selector to change the dataset license.
Each image stores annotations for all task types together. Changing the dataset task type controls which annotations are visible in the editor and included in exports and training. Annotations for other task types are preserved in the database and reappear when you switch back.
Link to this sectionClone Dataset#
When viewing a public dataset you do not own, click Clone Dataset to create a copy in your workspace. The clone includes all images, annotations, and class definitions. If the original dataset has a copyleft license, the clone inherits it and the license selector is locked.
Link to this sectionStar and Share#
- Star: Click the star button to bookmark a dataset. The star count is visible to all users.
- Share: For public datasets, click the share button to copy a link or share to social platforms.
Link to this sectionDelete Dataset#
Delete a dataset you no longer need:
- Open dataset actions menu
- Click
Delete - Confirm in the dialog: "This will move [name] to trash. You can restore it within 30 days."
Deleted datasets are moved to Trash — not permanently deleted. You can restore them within 30 days from Settings > Trash.
Link to this sectionTrain on Dataset#
Start training directly from your dataset:
- Click
New Modelon the dataset page - Select a project or create new
- Configure training parameters
- Start training
graph LR
    A[Dataset]:::start --> B[New Model]:::proc
    B --> C[Select Project]:::proc
    C --> D[Configure]:::proc
    D --> E[Start Training]:::out

    classDef start fill:#4CAF50,color:#fff
    classDef proc fill:#2196F3,color:#fff
    classDef out fill:#9C27B0,color:#fff
See Cloud Training for details.
Link to this sectionFAQ#
Link to this sectionWhat happens to my data after upload?#
Your data is processed and stored in your selected region (US, EU, or AP). Images are:
- Validated for format and size
- Rejected if minimum dimension is below 28px
- Normalized if larger than 4096px (preserving aspect ratio; encoded for optimized storage)
- Stored using Content-Addressable Storage (CAS) with XXH3-128 hashing
- Thumbnails generated at 256px WebP for fast browsing
Link to this sectionHow does storage work?#
Ultralytics Platform uses Content-Addressable Storage (CAS) for efficient storage:
- Deduplication: Identical images uploaded by different users are stored only once
- Integrity: XXH3-128 hashing ensures data integrity
- Efficiency: Reduces storage costs and speeds up processing
- Regional: Data stays in your selected region (US, EU, or AP)
Link to this sectionCan I add images to an existing dataset?#
Yes, drag and drop files onto the dataset page or use the upload button to add additional images. New statistics will be computed automatically.
Link to this sectionHow do I move images between splits?#
Use the bulk move-to-split feature:
- Select images in the table view
- Right-click and choose
Move to split - Select the target split (Train, Validation, or Test)
Link to this sectionWhat label formats are supported?#
Ultralytics Platform supports YOLO labels, COCO JSON, Ultralytics NDJSON, and raw image uploads:
One .txt file per image with normalized coordinates (0-1 range):
| Task | Format | Example |
|---|---|---|
| Detect | class cx cy w h | 0 0.5 0.5 0.2 0.3 |
| Segment | class x1 y1 x2 y2 ... | 0 0.1 0.1 0.9 0.1 0.9 0.9 |
| Pose | class cx cy w h kx1 ky1 v1 ... | 0 0.5 0.5 0.2 0.3 0.6 0.7 2 |
| OBB | class x1 y1 x2 y2 x3 y3 x4 y4 | 0 0.1 0.1 0.9 0.1 0.9 0.9 0.1 0.9 |
| Classify | Directory structure | train/cats/, train/dogs/ |
Pose visibility flags: 0=not labeled, 1=labeled but occluded, 2=labeled and visible.
Link to this sectionCan I annotate the same dataset for multiple task types?#
Yes. Each image stores annotations for all 6 task types (detect, segment, semantic, pose, OBB, classify) together. You can switch the dataset's active task type at any time without losing existing annotations. Only annotations matching the active task type are shown in the editor and included in exports and training — annotations for other tasks are preserved and reappear when you switch back.