使用 DVCLive 跟踪 YOLO26 高级实验
在机器学习中,实验跟踪对模型开发和评估至关重要。它涉及记录和分析多次训练运行中的各种参数、指标和结果。此过程对于了解模型性能以及基于数据做出决策以改进和优化模型至关重要。
将 DVCLive 与 Ultralytics YOLO26 集成后,可自动记录关键实验详情、比较不同运行的结果,并可视化数据以进行深入分析。本指南介绍如何设置和使用此集成。
DVCLive#
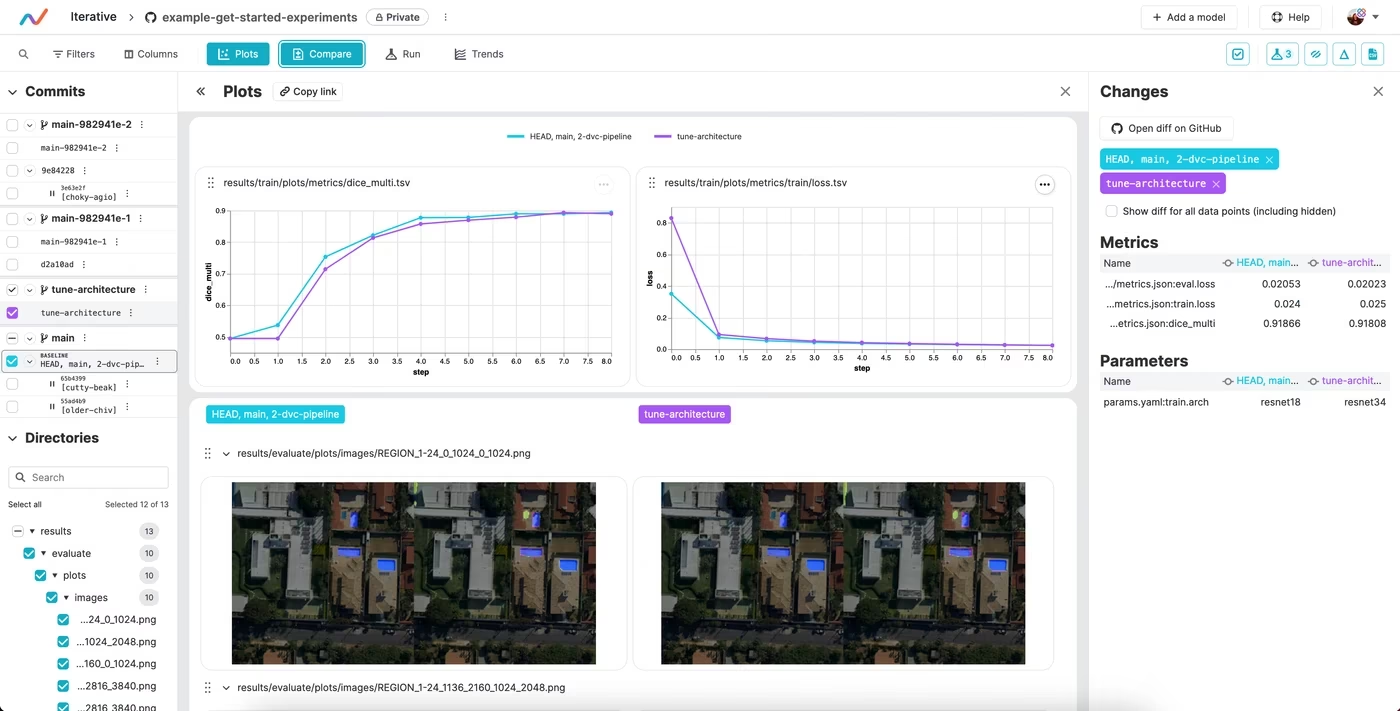
由 DVC 开发的 DVCLive 是一款用于机器学习实验跟踪的开源工具。它与 Git 和 DVC 配合使用,可自动记录实验数据,例如模型参数和训练指标,并通过数据可视化和分析工具轻松比较和分析多次运行。
使用 DVCLive 训练 YOLO26#
你可以使用 DVCLive 监控 YOLO26 训练会话。DVC 还提供实验可视化工具,其中包括一份报告,用于比较所有已跟踪实验的指标图。
安装#
运行以下命令安装所需的软件包:
# Install the required packages for YOLO26 and DVCLive
pip install ultralytics dvclive
有关安装过程的详细说明和最佳实践,请务必查看我们的 YOLO26 安装指南。安装 YOLO26 所需的软件包时,如果遇到任何问题,请参阅我们的常见问题指南,获取解决方案和建议。
配置 DVCLive#
安装必要的软件包后,设置项目环境,以便 DVCLive 能够在代码旁记录实验。
首先初始化 Git 仓库,因为 Git 在管理代码和 DVCLive 配置的版本控制方面发挥着关键作用。
# Initialize a Git repository
git init -q

# Configure Git with your details
git config --local user.email "your-email"
git config --local user.name "Your Name"

# Initialize DVC in your project
dvc init -q

# Commit the DVC setup to your Git repository
git commit -m "DVC init"
在这些命令中,请确保将 your-email 替换为与你的 Git 账户关联的电子邮件地址,并将 "Your Name" 替换为你的 Git 账户用户名。
用法#
使用 DVCLive 训练 YOLO26 模型#
首先运行 YOLO26 训练过程。你可以根据项目需求使用不同的模型配置和训练参数。例如:
# Example training commands for YOLO26 with varying configurations
yolo train model=yolo26n.pt data=coco8.yaml epochs=5 imgsz=512
yolo train model=yolo26n.pt data=coco8.yaml epochs=5 imgsz=640根据你的具体需求调整模型、数据、epochs 和 imgsz 参数。如需详细了解模型训练流程和最佳实践,请参阅我们的 YOLO26 模型训练指南。
使用 DVCLive 监控实验#
DVCLive 通过跟踪和可视化关键指标来改进训练流程。安装 DVCLive 后,其回调默认启用。它会记录训练参数、每个周期的损失、验证指标和学习率、训练与验证绘图、混淆矩阵,以及作为模型制品的 best.pt。运行 yolo settings dvc=False 可禁用此集成。要全面了解训练中使用的具体性能指标,请参阅我们的性能指标详细指南。
分析结果#
YOLO26 训练会话完成后,你可以使用 DVCLive 的可视化工具分析结果。由于集成会记录所有训练指标,你可以评估模型在多次运行中的表现。
要开始分析,你可以使用 DVC 的 API 提取实验数据,并通过 Pandas 处理数据,以便更轻松地操作和可视化:
import dvc.api
import pandas as pd

# 定义关注的列
columns = ["Experiment", "epochs", "imgsz", "model", "metrics.mAP50-95(B)"]

# 检索实验数据
df = pd.DataFrame(dvc.api.exp_show(), columns=columns)

# 清理数据
df.dropna(inplace=True)
df.reset_index(drop=True, inplace=True)

# 显示 DataFrame
print(df)
上方代码片段的输出以清晰的表格形式展示了使用 YOLO26 模型进行的不同实验。每一行代表一次不同的训练运行,列出实验名称、轮数、图像尺寸(imgsz)、所用的具体模型,以及 mAP50-95(B) 指标。该指标对于评估模型的准确率至关重要,数值越高表示性能越好。
使用 Plotly 可视化结果#
若要以更具交互性的方式直观分析实验结果,你可以使用 Plotly 的平行坐标图。这类图表特别适合了解不同参数和指标之间的关系与权衡。
from plotly.express import parallel_coordinates

# 创建平行坐标图
fig = parallel_coordinates(df, columns, color="metrics.mAP50-95(B)")

# 显示图表
fig.show()
上方代码片段的输出会生成一张图表,直观展示轮数、图像尺寸、模型类型与相应 mAP50-95(B) 得分之间的关系,帮助你发现实验数据中的趋势和模式。
使用 DVC 生成对比可视化图表#
DVC 提供了一个实用命令,可为实验生成对比图表。这对于比较不同模型在多次训练运行中的表现尤其有帮助。
# Generate DVC comparative plots
dvc plots diff $(dvc exp list --names-only)
执行此命令后,DVC 会生成对比不同实验指标的图表,并将其保存为 HTML 文件。下面的示例图片展示了通过此流程生成的典型图表。图片包含多种图形,例如展示 mAP、召回率、精确率、损失值等指标的图表,直观呈现了关键性能指标:
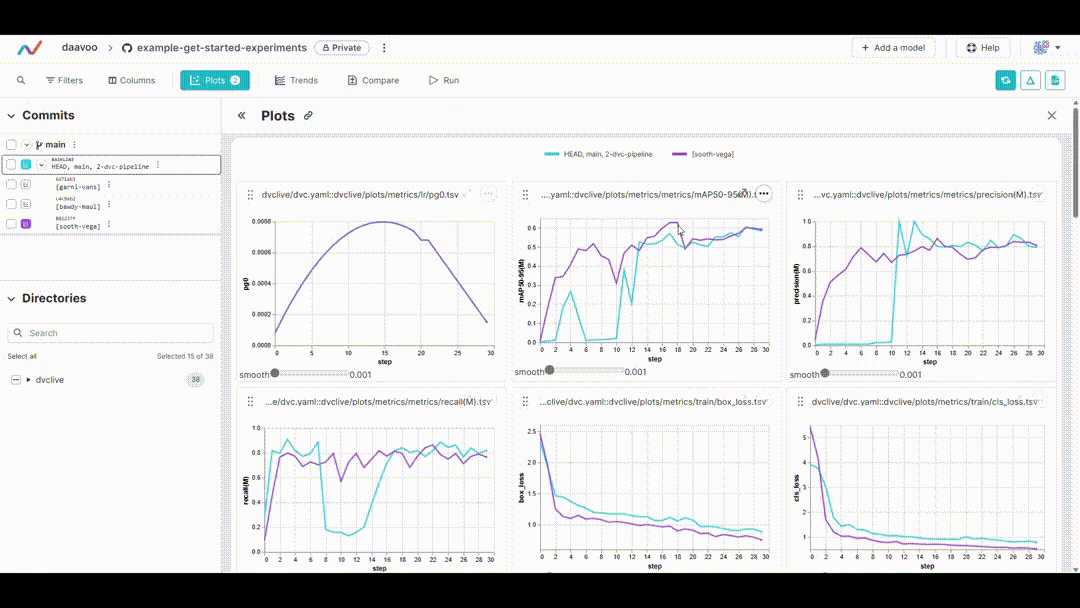
显示 DVC 图表#
如果你使用 Jupyter Notebook 并想显示生成的 DVC 图表,可以使用 IPython 的显示功能。
from IPython.display import HTML

# 将 DVC 图表显示为 HTML
HTML(filename="./dvc_plots/index.html")
这段代码会直接在 Jupyter Notebook 中呈现包含 DVC 图表的 HTML 文件,方便你分析可视化后的实验数据。
基于数据做出决策#
利用这些可视化结果获得的洞察,明智地决定如何优化模型、进行超参数调优以及实施其他修改,从而提升模型性能。
迭代实验#
根据分析结果迭代实验。调整模型配置、训练参数,甚至输入数据,然后重复训练和分析流程。通过这种迭代方法,你可以不断改进模型,尽可能提升其性能。
总结#
本指南带你了解了将 DVCLive 与 Ultralytics YOLO26 集成的流程,涵盖设置、实验监控、可视化和分析。
如需了解更多用法详情,请访问 DVCLive 官方文档。
常见问题#
将 DVCLive 与 Ultralytics YOLO26 集成非常简单。首先安装所需的软件包:
安装pip install ultralytics dvclive接下来,初始化 Git 仓库并在项目中配置 DVCLive:
初始环境设置git init -q git config --local user.email "your-email" git config --local user.name "Your Name" dvc init -q git commit -m "DVC init"请按照我们的 YOLO26 安装指南获取详细的设置说明。
将 DVCLive 与 YOLO26 配合使用有多项优势,例如:
- 自动记录:DVCLive 会自动记录模型参数和指标等关键实验详情。
- 轻松比较:便于比较不同运行的结果。
- 可视化工具:使用 DVCLive 的数据可视化功能进行深入分析。
如需了解更多详情,请参阅我们的 YOLO26 模型训练和 YOLO 性能指标指南,充分提升实验跟踪效率。
完成 YOLO26 训练后,DVCLive 可以帮助你有效地可视化和分析结果。以下示例代码用于加载和显示实验数据:
import dvc.api
import pandas as pd

# 定义关注的列
columns = ["Experiment", "epochs", "imgsz", "model", "metrics.mAP50-95(B)"]

# 检索实验数据
df = pd.DataFrame(dvc.api.exp_show(), columns=columns)

# 清理数据
df.dropna(inplace=True)
df.reset_index(drop=True, inplace=True)

# 显示 DataFrame
print(df)
若要交互式地可视化结果,请使用 Plotly 的平行坐标图:
from plotly.express import parallel_coordinates

fig = parallel_coordinates(df, columns, color="metrics.mAP50-95(B)")
fig.show()
如需查看更多示例和最佳实践,请参阅我们的 使用 DVCLive 训练 YOLO26指南。
要配置环境,顺利集成 DVCLive 和 YOLO26,请按以下步骤操作:
- 安装所需软件包:使用
pip install ultralytics dvclive。 - 初始化 Git 仓库:运行
git init -q。 - 初始化 DVC:执行
dvc init -q。 - 提交到 Git:使用
git commit -m "DVC init"。
这些步骤可确保正确设置实验跟踪和版本控制。
- 安装所需软件包:使用
DVCLive 提供了可视化 YOLO26 实验结果的工具。你可以按以下步骤生成对比图:
生成对比图表dvc plots diff $(dvc exp list --names-only)若要在 Jupyter Notebook 中显示这些图表,请使用:
from IPython.display import HTML

# 将图表显示为 HTML
HTML(filename="./dvc_plots/index.html")
这些可视化结果有助于发现趋势并优化模型性能。


评论5
提出问题、分享结果,或帮助其他人。
UltralyticsAssistantUltralytics
👋 Hello, thank you for bringing this up and for your interest in Ultralytics 🚀!
We recommend starting with the Ultralytics Documentation, where you can explore various features, including helpful integrations like DVC, to improve your ML workflows. The linked Chinese documentation will also be very helpful: 多功能集成:DVCLive!
If this is a 🐛 Bug Report, please provide a minimum reproducible example to help us further investigate the issue.
If this is a custom training ❓ Question, include as much detail as possible, such as your use case, dataset details, any training logs, and ensure you're leveraging the relevant model training tips to get the best results.
Here are a few recommendations to ensure you're up to date and ready to experiment with integrations like DVCLive:
Upgrade
Make sure you're using the latest version of the
ultralyticspackage by upgrading in your setup:pip install -U ultralyticsThe latest version ensures compatibility with integrations like DVCLive and other features.
Supported Environments
You can work seamlessly with YOLO and its integrations in the following environments:
- Notebooks with free GPU:


- Cloud Platforms like Google Cloud, AWS, or with a Docker setup
.
For real-time assistance, join the Ultralytics Discord 🎧, or for longer discussions, participate in our Discourse. You can also connect with others in our Subreddit for knowledge sharing.
An Ultralytics engineer will review your post soon and assist further. Thanks again for contributing to the Ultralytics community! ✨
liggr
Command line input command ”dvc plots diff $(dvc exp list --names-only)“,prompt ”No plots were loaded, visualization file will not be created.“, do I need to do any configuration?
 Glenn JocherUltralytics
@liggr to resolve the "No plots were loaded" message, ensure you've completed at least two YOLO training experiments with DVCLive logging enabled. The DVC integration requires tracked experiments to compare. Verify your experiments exist with
dvc exp list --names-onlyafter training. For setup details, refer to the DVCLive integration guide.
- Notebooks with free GPU:
Can this DVC be integrated with the YOLOV8 model?
- Glenn JocherUltralytics
Yes, DVC can be integrated with YOLOv8 for experiment tracking. The process is similar to the YOLO11 integration shown in our documentation. For YOLOv8-specific implementation details, see our guide at https://docs.ultralytics.com/integrations/dvc/ which applies to all YOLO versions.