Ultralytics YOLO26
概述#
Ultralytics YOLO26 是一个统一的实时视觉模型系列,详见 Ultralytics YOLO26 论文。它引入了原生端到端推理、更轻量的检测头、更新后的训练方案,以及用于检测、分割、分类、姿态估计和有向检测的任务专用头。
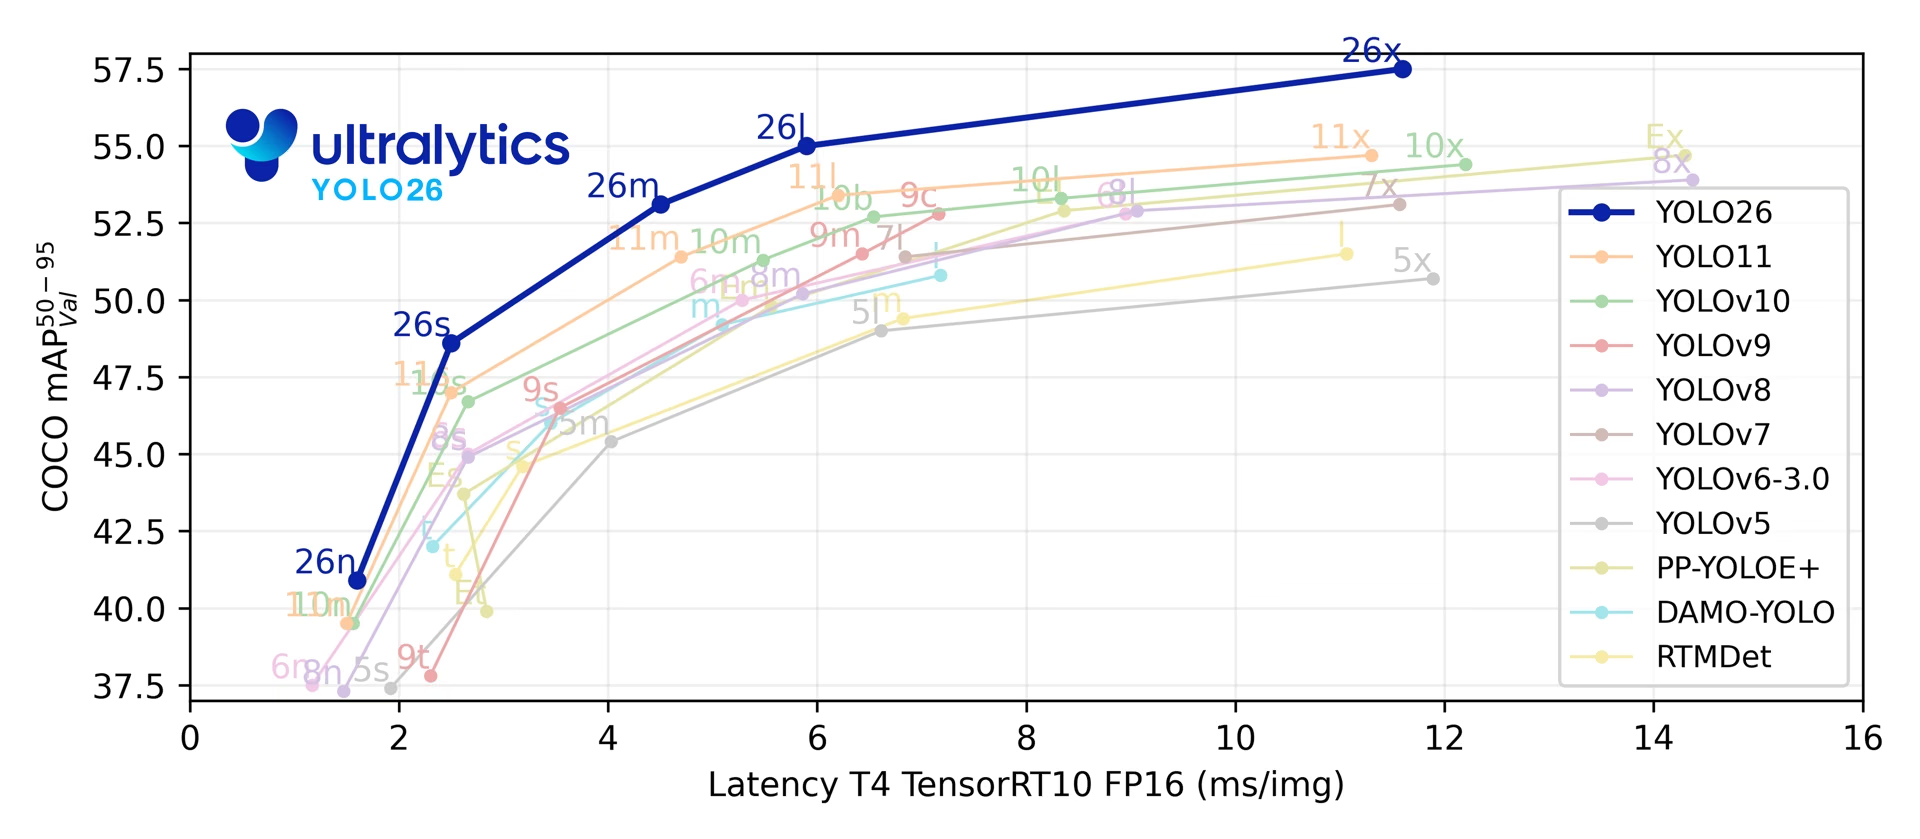
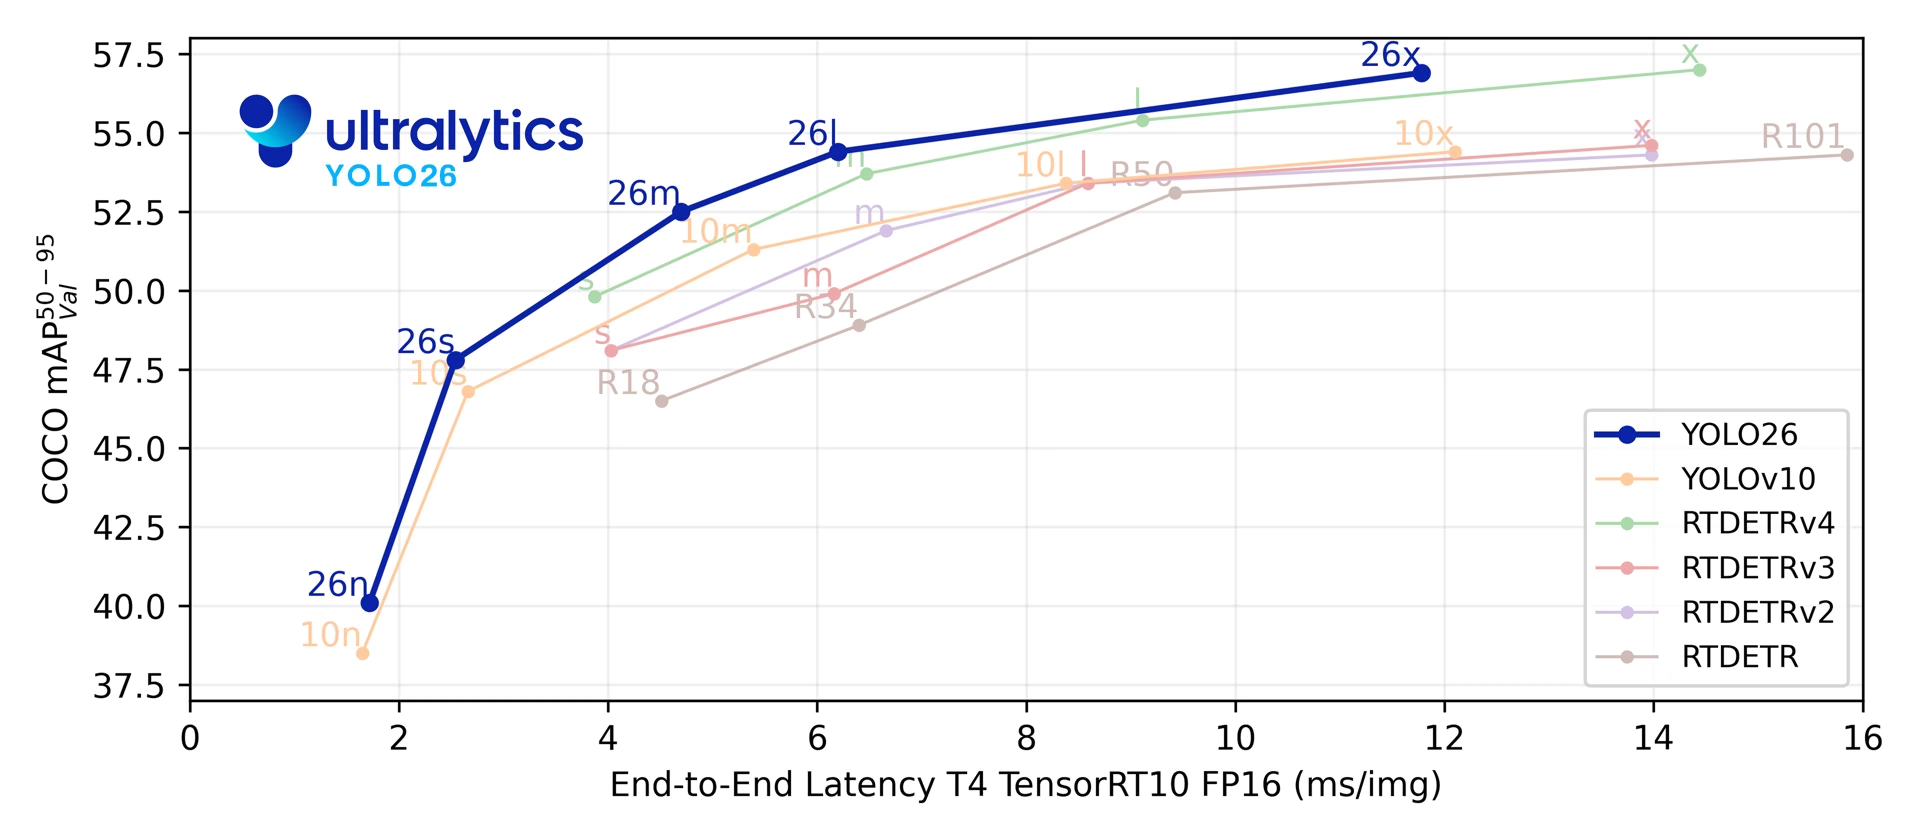
在五种检测模型尺寸中,YOLO26 在 COCO 上达到 40.9-57.5 mAP,T4 TensorRT 延迟为 1.7-11.8 ms。论文还报告称,在 Intel Xeon CPU @ 2.00 GHz 上,与 YOLO11n 相比,YOLO26n 的 CPU ONNX 推理速度最高可提升 43%。
查看尚未发布的 YOLO27 预览,了解计划中的架构、任务和初步基准测试结果。
from ultralytics import YOLO

model = YOLO("yolo26n.pt")  # 加载一个预训练的 YOLO26n 模型
results = model("path/to/bus.jpg") # 运行推理直接在 Ultralytics Platform 上探索和运行 YOLO26 模型。
YOLO26 模型系列围绕四个设计方向构建:
- 原生端到端推理:可选的一对一检测头无需非极大值抑制 (NMS)即可生成预测结果,从而简化部署并减少后处理。
- 更轻量的边界框回归:YOLO26 移除了分布焦点损失 (DFL),降低了检测头的复杂度,同时保留不受限制的回归范围。
- 训练方案更新:训练流程结合了 MuSGD(Muon + SGD 混合优化器)、Progressive Loss 和 STAL(Small-Target-Aware Label Assignment,小目标感知标签分配),以改进优化过程、将监督重点转移到推理时使用的检测头,并确保小目标获得正标签覆盖。已发布检查点所用的完整超参数记录在 YOLO26 训练方案指南中。
- 任务专用检测头和损失:YOLO26 针对实例分割、语义分割变体、姿态估计和旋转框检测引入了专门设计,同时让不同任务共用一条模型流水线。
这些更新共同改善了不同模型尺寸和部署目标下准确率与延迟之间的权衡。
主要功能#
-
无 DFL 回归 YOLO26 移除了分布焦点损失 (DFL),降低了检测头的复杂度并简化了导出流程。
-
端到端无 NMS 推理 YOLO26 支持使用
nms=False进行原生端到端推理,无需单独执行 NMS。默认的一对多路径使用 NMS 来提高准确率。 -
Progressive Loss + STAL Progressive Loss 将训练重点转向推理时使用的检测头,而 STAL 则提升小目标的正标签覆盖率。
-
高效部署 简化的检测头和可选的无 NMS 路径降低了不同导出目标和硬件配置下的推理开销,其中包括论文报告的 YOLO26n 相比 YOLO11n 的 CPU ONNX 加速效果。
-
实例分割增强 引入语义分割损失以改善模型收敛,并升级 proto 模块,利用多尺度信息提升掩码质量。论文报告称,在 COCO 实例分割任务上,相较 YOLO11,框 AP 最高提升 +2.5,掩码 AP 最高提升 +3.7。
-
精准姿态估计 集成残差对数似然估计 (RLE),以实现更准确的关键点定位,并优化解码流程来提高推理速度。论文报告称,在 COCO 姿态估计任务上,相比 YOLO11,AP 最高提升 +7.2。
-
改进的 OBB 解码 引入专用角度损失,以提高正方形目标的检测准确率,并优化 OBB 解码来解决边界不连续问题。论文报告称,在 DOTA-v1.0 旋转框检测任务上,相比 YOLO11,mAP 最高提升 +3.4。
支持的任务和模式#
YOLO26 在五种模型尺寸上支持 Ultralytics 的标准任务集:
| 模型 | 文件名 | 任务 | 训练 | 验证 | 推理 | 导出 |
|---|---|---|---|---|---|---|
| YOLO26 | yolo26n.pt yolo26s.pt yolo26m.pt yolo26l.pt yolo26x.pt | 检测 | ✅ | ✅ | ✅ | ✅ |
| YOLO26-seg | yolo26n-seg.pt yolo26s-seg.pt yolo26m-seg.pt yolo26l-seg.pt yolo26x-seg.pt | 实例分割 | ✅ | ✅ | ✅ | ✅ |
| YOLO26-sem | yolo26n-sem.pt yolo26s-sem.pt yolo26m-sem.pt yolo26l-sem.pt yolo26x-sem.pt | 语义分割 | ✅ | ✅ | ✅ | ✅ |
| YOLO26-depth | yolo26n-depth.pt yolo26s-depth.pt yolo26m-depth.pt yolo26l-depth.pt yolo26x-depth.pt | 深度估计 | ✅ | ✅ | ✅ | ✅ |
| YOLO26-cls | yolo26n-cls.pt yolo26s-cls.pt yolo26m-cls.pt yolo26l-cls.pt yolo26x-cls.pt | 分类 | ✅ | ✅ | ✅ | ✅ |
| YOLO26-pose | yolo26n-pose.pt yolo26s-pose.pt yolo26m-pose.pt yolo26l-pose.pt yolo26x-pose.pt | 姿态/关键点 | ✅ | ✅ | ✅ | ✅ |
| YOLO26-obb | yolo26n-obb.pt yolo26s-obb.pt yolo26m-obb.pt yolo26l-obb.pt yolo26x-obb.pt | 定向检测 | ✅ | ✅ | ✅ | ✅ |
该统一框架涵盖实时检测、实例分割、语义分割、单目深度估计、分类、姿态估计和旋转框目标检测,并支持训练、验证、推理和导出。
yolo26-p2.yaml 和 yolo26-p6.yaml 增加了 P2(小目标)或 P6(大输入)检测头,并且仅以 YAML 架构形式发布。不会发布针对特定尺度的 yolo26*-p2.pt 或 yolo26*-p6.pt 权重。你可以从 YAML 实例化一个缩放后的配置(例如 YOLO("yolo26n-p6.yaml")),并根据需要进行训练或微调;从预训练权重训练 YOLO26 P2 模型介绍了如何从 yolo26n.pt 开始,并检查 P2 输出是否存在。
性能指标#
这些模型在 COCO 上训练,包含 80 个预训练类别;使用示例请参阅检测文档。
| 模型 | 尺寸 (像素) | mAPval50-95 | mAP验证50-95 (e2e) | 速度 CPU ONNX (毫秒) | 速度 T4 TensorRT10 (ms) | 参数 (M) | FLOPs (B) |
|---|---|---|---|---|---|---|---|
| YOLO26n | 640 | 40.9 | 40.1 | 38.9 ± 0.7 | 1.7 ± 0.0 | 2.4 | 5.5 |
| YOLO26s | 640 | 48.6 | 47.8 | 87.2 ± 0.9 | 2.5 ± 0.0 | 9.5 | 20.9 |
| YOLO26m | 640 | 53.1 | 52.5 | 220.0 ± 1.4 | 4.7 ± 0.1 | 20.4 | 68.4 |
| YOLO26l | 640 | 55.0 | 54.4 | 286.2 ± 2.0 | 6.2 ± 0.2 | 24.8 | 86.8 |
| YOLO26x | 640 | 57.5 | 56.9 | 525.8 ± 4.0 | 11.8 ± 0.2 | 55.7 | 194.4 |
Params 和 FLOPs 数值针对融合后的模型计算,融合过程包括 Conv/BatchNorm 折叠和移除未使用的检测分支。速度测量使用 nms=False 选择无 NMS 检测头。预训练检查点保留完整训练架构,因此显示的数值可能更高。
使用示例#
下面的示例在 COCO8 示例数据集上训练 YOLO26 检测模型,以执行目标检测。
PyTorch 预训练的 *.pt 模型以及配置 *.yaml 文件都可以传递给 YOLO() 类,从而在 Python 中创建模型实例:
from ultralytics import YOLO

# 加载经过 COCO 预训练的 YOLO26n 模型
model = YOLO("yolo26n.pt")

# 使用 YOLO26n 模型对“bus.jpg”图像进行推理
results = model("path/to/bus.jpg")

# 使用 COCO8 示例数据集训练模型 100 个 epoch
results = model.train(data="coco8.yaml", epochs=100, imgsz=640)YOLO26 检测模型采用双头架构,可灵活适应不同的部署场景:
- 一对多头(默认):生成传统的 YOLO 输出,需要进行 NMS 后处理,输出
(N, nc + 4, 8400),其中nc是类别数。该检测头通常能达到略高的准确率,但需要额外的处理。 - 一对一头(
nms=False):生成无需 NMS 的端到端预测,输出(N, 300, 6),每张图像最多检测 300 个目标。该检测头针对快速推理和简化部署进行了优化。
你可以在导出、预测或验证时切换检测头:
from ultralytics import YOLO

model = YOLO("yolo26n.pt")

# 使用一对多头(默认,Ultralytics 会应用 NMS)
results = model.predict("image.jpg")  # inference
metrics = model.val(data="coco.yaml")  # validation
model.export(format="onnx")  # export

# 启用无 NMS 的一对一头
results = model.predict("image.jpg", nms=False)  # inference
metrics = model.val(data="coco.yaml", nms=False)  # validation
model.export(format="onnx", nms=False)  # export
预测和验证默认使用一对多头,以确保准确率。使用 nms=False 进行无 NMS 推理,或使用 nms=True 在受支持的导出格式中嵌入 NMS。无论选择哪种方式,两个检测头都会接受训练。有关输出格式和导出兼容性,请参阅端到端检测指南。
YOLOE-26:开放词汇检测与分割#
YOLO26 还是 YOLOE-26 的基础。YOLOE-26 是一个开放词汇变体,可根据文本提示、视觉提示或无提示模式检测和分割对象类别,而不是依赖训练时学习的固定类别列表。YOLOE-26 保留了 YOLO26 可选的无 NMS 端到端 (e2e) 检测头,因此即使目标类别随时间变化,在动态环境中也能保持足够快的开放词汇推理速度。在 LVIS minival 上,YOLOE-26x 在文本提示下达到 40.6 AP,在视觉提示下达到 38.5 AP,在无提示模式下达到 31.1 AP——这些是论文报告的非端到端数值,其端到端检测头分别低 1.1、2.3 和 1.2 AP。
有关各尺度的性能表、无提示变体和完整用法示例,请参阅 YOLOE 文档。
引用与致谢#
如需全面了解 YOLO26 架构、训练方案、任务检测头以及 YOLOE-26 开放词汇扩展,请阅读 Ultralytics YOLO26:统一的实时端到端视觉模型。如果你在研究中使用 YOLO26,请引用:
@misc{jocher2026ultralyticsyolo26unifiedrealtime,
  title = {Ultralytics YOLO26: Unified Real-Time End-to-End Vision Models},
  author = {Glenn Jocher and Jing Qiu and Mengyu Liu and Shuai Lyu and Fatih Cagatay Akyon and Muhammet Esat Kalfaoglu},
  year = {2026},
  eprint = {2606.03748},
  archivePrefix = {arXiv},
  primaryClass = {cs.CV},
  doi = {10.48550/arXiv.2606.03748},
  url = {https://arxiv.org/abs/2606.03748},
}
YOLO26 代码、模型和文档可在 Ultralytics GitHub 仓库和 Ultralytics 文档中获取,并依据 AGPL-3.0 和企业版许可提供。
常见问题#
- 无 DFL 回归:简化检测头和导出流程
- 端到端无 NMS 推理:支持使用
nms=False进行无 NMS 推理 - 渐进式损失 + STAL:改善训练对齐效果和小目标标签覆盖率
- MuSGD 优化器:结合 SGD 与受 Muon 启发的优化方法,实现稳定训练
- 特定任务的检测头和损失函数:改进对分割、姿态估计和有向目标检测的支持
YOLO26 通过以下方式提升部署效率:
- 可选的原生端到端推理,无需 NMS(
nms=False) - 无 DFL 回归和更轻量的检测头
- 导出融合后的模型,移除仅用于训练的辅助组件
- 与 Intel Xeon CPU @ 2.00 GHz 上的 YOLO11n 相比,YOLO26n 的 CPU ONNX 推理速度最高提升 43%
- 支持灵活的导出格式,包括 TensorRT、ONNX、CoreML、LiteRT 和 OpenVINO
- 可选的原生端到端推理,无需 NMS(
YOLO26 模型可通过
ultralytics包下载。安装或更新该包,然后加载模型:from ultralytics import YOLO # 加载预训练的 YOLO26 nano 模型 model = YOLO("yolo26n.pt") # 对图像进行推理 results = model("image.jpg")有关训练、验证和导出的说明,请参阅使用示例部分。


评论117
提出问题、分享结果,或帮助其他人。
hongzhuoxx
除了监督模型,我还期待着ultralytics可以推出高效准确易用的非监督瑕疵检测模型!
4Syedshajib55
How do I modify the architectural components (Head and Neck) of YOLOv26?
What is the process for inserting a Dropout layer at the end of the backbone in the YOLOv26 configuration?
2 Glenn JocherUltralytics
YOLO26 (no “v”) architecture edits are done in the model YAML, so start by copying
ultralytics/cfg/models/26/yolo26.yamlinto your project, modify thebackbone:/head:layer lists (the “neck” is part ofhead:), and train from that YAML following the Model YAML Configuration Guide.# yolo26_custom.yaml backbone: # ... existing backbone layers ... - [-1, 1, nn.Dropout, [0.2]] # add dropout at end of backbone (train-time only) head: # ... existing head/neck layers ...yolo train model=yolo26_custom.yaml data=your_dataset.yaml imgsz=640If you share which task model you’re editing (
detect/seg/pose/obb) and which variant (n/s/m/l/x), we can point you to the exact YAML to start from and where to insert the change in that graph.1Hi Glenn,
Thank you for the quick response and guidance! To answer your question: I am focusing on the detect task, and I will be experimenting with both the s (small) and m (medium) variants.
For context, I am working on a paper targeting a Q1 journal. My project focuses on Emotion Detection (5 classes: Angry, Happy, Sad, Neutral, Surprised) using the RAVDESS dataset. I have extracted peak emotion frames from the videos and augmented the dataset to roughly 21k images (640x640 resolution). My core research objective is to demonstrate that a customized YOLO26 architecture can outperform the standard baseline for detecting subtle facial micro-expressions. To achieve this, I want to modify the backbone—specifically by adding Batch Normalization and Dropout layers (potentially after the C2f blocks or may be after c3k2 blocks of that yolo26 architechtural images) to improve regularization and prevent overfitting on facial features.
Could you help me with the following?
-
Could you point me to the exact base YAML files for the yolo26s and yolo26m detection models to use as my starting point?
-
From an architectural standpoint, where exactly in the backbone would you theoretically recommend inserting these Dropout/BN layers? (e.g., after which specific layer index or block) to maximize accuracy without degrading the spatial feature maps necessary for facial detection?
Any insights on how to best structure this custom YAML would be incredibly helpful. Thanks again for your time!
-
- Baseline Reference: Finally, could you share the raw YAML configuration code that details the standard YOLO26 backbone and head? I would like to include this exact baseline structure in my paper’s methodology section to clearly contrast it with my proposed modifications.
hbzylilin
延迟了10天了,还没动静
1lwplw
真不错,期待开源
1- Glenn JocherUltralytics(已编辑)
@etemical 感谢建议!目前未原生支持行为识别/多目标行为检测;建议先用 YOLO26 组合
detect+track多目标跟踪与可选pose关键点作为上游信号,并在 GitHub 提交详细需求(数据标注格式与评测指标)为 Feature Request 模板 便于评估;参考 Track 模式文档 与 Pose 任务文档。yolo track model=yolo26n.pt source=your_video.mp4 tracker=bytetrack.yaml show=True yolo pose predict model=yolo26n-pose.pt source=your_video.mp4 show=True@lwplw 谢谢关注!YOLO26 现已发布,可阅读我们的 YOLO26 介绍博客 了解功能。
Jiahao Chen
请问如果我想要引用本页面的YOLO26和其他模型的对比曲线图,已经在文中索引了来源。但是期刊要求需要拿到作者的授权,请问如何申请授权呢?
 Paula DerrengerUltralytics
您好,针对期刊要求的图片书面授权,建议联系 Ultralytics 法务团队,说明申请转载 YOLO26 对比曲线图,并附上页面链接、具体图片、论文题目、期刊名称、是否修改图片,以及期刊的授权模板(如有),请求确认版权归属并提供书面许可。目前未找到该图专门的公开授权流程,因此这里不能代为授予许可;请以收到的正式书面回复为准。
cyberpunk-edgerunner
maybe
CIFAR-10-LTdataset can help. you do not need background images because our initial conversation started without that, for an image, there can be one to 15 object in one image The cause of the shared-memory increase will remain unconfirmed unless you runpython train.pyin your computer with an rtx gpuOn Sat, Oct 10, 2026 at 6:15 AM Paula Derrenger @.***> wrote:
Understood—you don’t need to interrupt your work for the batch=16 comparison. Could you name a public long-tailed dataset you consider representative and share your approximate class counts, background-image proportion, and typical/maximum objects per image? That would help define a reproduction using the configuration you already shared, without requiring your company’s data or another production run. The cause of the shared-memory increase remains unconfirmed.
— Reply to this email directly, view it on GitHub https://github.com/orgs/ultralytics/discussions/26446?email_source=notifications&email_token=BSIM7DUZ6A5KFG7YKF2H6KT5TGBBRA5CNFSNUABIM5UWIORPF5TWS5BNNB2WEL2ENFZWG5LTONUW63SDN5WW2ZLOOQXTCOBYGQ2DONBZUZZGKYLTN5XKOY3PNVWWK3TUUVSXMZLOOSWGM33PORSXEX3DNRUWG2Y#discussioncomment-18844749, or unsubscribe https://github.com/notifications/unsubscribe-auth/BSIM7DTBK4XV3HXIPMFHVXT5TGBBRAVCNFSNUABIKJSXA33TNF2G64TZHM2TGNJTGYYDINBVHNCGS43DOVZXG2LPNY5TCMBZGE3TMNRUUF3AE . Triage notifications, keep track of coding agent tasks and review pull requests on the go with GitHub Mobile for iOS https://github.com/notifications/mobile/ios/BSIM7DST66YNYHAKPWPY3PT5TGBBRA5CNFSNUABIM5UWIORPF5TWS5BNNB2WEL2ENFZWG5LTONUW63SDN5WW2ZLOOQXTCOBYGQ2DONBZUZZGKYLTN5XKOY3PNVWWK3TUUVSXMZLOOSVGM33PORSXEX3JN5ZQ and Android https://github.com/notifications/mobile/android/BSIM7DRDX2BJPHP7PHHKRG35TGBBRA5CNFSNUABIM5UWIORPF5TWS5BNNB2WEL2ENFZWG5LTONUW63SDN5WW2ZLOOQXTCOBYGQ2DONBZUZZGKYLTN5XKOY3PNVWWK3TUUVSXMZLOOSXGM33PORSXEX3BNZSHE33JMQ. Download it today! You are receiving this because you commented.Message ID: @.*** com>
- Paula DerrengerUltralytics
Thanks for clarifying the 1–15 objects per image; we can keep background-only images out of the reproduction.
CIFAR-10-LTis a long-tailed classification benchmark, so it would not directly reproduce your multi-object detection setup. I can’t executepython train.pyon an RTX GPU here, and I haven’t reproduced the shared-memory increase. Could you share a public-data version of the script, including dataset preparation, so someone with suitable hardware can run the same test without your company’s data?
I cannot run the same code with batch=16, reasons:
- I work in a company and have my own KPI to meet and improve
- I have added background image data in the dataset so it is no longer same.
- I am planning to add more images in future.
I suggest you download a long tailed distributed dataset to mimic my experiment.
thank you
On Fri, Oct 9, 2026 at 5:15 AM Paula Derrenger @.***> wrote:
Thanks for clarifying that it was 15 GB of shared GPU memory and sharing the configuration; sorry for requesting the script again. To test whether batch-related memory pressure contributes, could you compare your batch=64 run with batch=16, keeping all other settings unchanged? See the batch-size guidance https://docs.ultralytics.com/guides/model-training-tips#batch-size-and-gpu-utilization. Please share epoch 2–3 text logs and dedicated/shared GPU memory readings from the comparison; this will help narrow down the cause without assuming the memory change is a bug.
— Reply to this email directly, view it on GitHub https://github.com/orgs/ultralytics/discussions/26446?email_source=notifications&email_token=BSIM7DWLJ3KRNTXM7Y6Q4O35TARKLA5CNFSNUABIM5UWIORPF5TWS5BNNB2WEL2ENFZWG5LTONUW63SDN5WW2ZLOOQXTCOBYGI2TINRTUZZGKYLTN5XKOY3PNVWWK3TUUVSXMZLOOSWGM33PORSXEX3DNRUWG2Y#discussioncomment-18825463, or unsubscribe https://github.com/notifications/unsubscribe-auth/BSIM7DQLZ4KWCGA6TEUDIS35TARKLAVCNFSNUABIKJSXA33TNF2G64TZHM2TGNJTGYYDINBVHNCGS43DOVZXG2LPNY5TCMBZGE3TMNRUUF3AE . Triage notifications, keep track of coding agent tasks and review pull requests on the go with GitHub Mobile for iOS https://github.com/notifications/mobile/ios/BSIM7DV53PCZWPENVMYYNYT5TARKLA5CNFSNUABIM5UWIORPF5TWS5BNNB2WEL2ENFZWG5LTONUW63SDN5WW2ZLOOQXTCOBYGI2TINRTUZZGKYLTN5XKOY3PNVWWK3TUUVSXMZLOOSVGM33PORSXEX3JN5ZQ and Android https://github.com/notifications/mobile/android/BSIM7DX2XUXERTKYLIDJ2C35TARKLA5CNFSNUABIM5UWIORPF5TWS5BNNB2WEL2ENFZWG5LTONUW63SDN5WW2ZLOOQXTCOBYGI2TINRTUZZGKYLTN5XKOY3PNVWWK3TUUVSXMZLOOSXGM33PORSXEX3BNZSHE33JMQ. Download it today! You are receiving this because you commented.Message ID: @.*** com>
- Paula DerrengerUltralytics
Understood—you don’t need to interrupt your work for the
batch=16comparison. Could you name a public long-tailed dataset you consider representative and share your approximate class counts, background-image proportion, and typical/maximum objects per image? That would help define a reproduction using the configuration you already shared, without requiring your company’s data or another production run. The cause of the shared-memory increase remains unconfirmed.
- I have shared you exact code in this email thread(check my second reply) and the command to run it was `python .\det_yoloM_5-10.py' .
- yes, it was 15GB of shared GPU
- sorry, I do not have
separate dedicated/shared memory readings at comparable batch positions in each epoch, but there was a steady consumption of about 15GB of shared memory throughout the training. however I can provide you argos.yaml
task: detect mode: train model: yolo26m.pt data: yoloDet_clsAgnostic_split/data.yaml epochs: 200 time: null patience: 20 batch: 64 imgsz: 640 save: true save_period: -1 cache: false device: '0' workers: 6 project: null name: train-2 exist_ok: false pretrained: true cls_remap: true optimizer: auto verbose: false seed: 0 deterministic: true single_cls: false rect: false cos_lr: false close_mosaic: 10 resume: false amp: true fraction: 1.0 profile: false freeze: null multi_scale: 0.0 compile: false channels_last: null overlap_mask: true mask_ratio: 4 dropout: 0.0 val: true split: val save_json: false conf: null iou: 0.7 max_det: 300 quantize: null dnn: false plots: true nms: null source: null vid_stride: 1 stream_buffer: false visualize: false augment: false agnostic_nms: false classes: null retina_masks: false embed: null show: false save_frames: false save_txt: false save_conf: false save_crop: false show_labels: true show_conf: true show_boxes: true line_width: null format: torchscript keras: false optimize: false dynamic: false simplify: true opset: null workspace: null lr0: 0.01 lrf: 0.01 momentum: 0.937 weight_decay: 0.0005 warmup_epochs: 3.0 warmup_momentum: 0.8 warmup_bias_lr: 0.1 distill_model: null dis: 6.0 box: 7.5 cls: 0.5 cls_pw: 0.0 dfl: 1.5 pose: 12.0 kobj: 1.0 rle: 1.0 angle: 1.0 dlog: 1.0 dgrad: 0.5 dlam: 1.0 nbs: 64 hsv_h: 0.015 hsv_s: 0.7 hsv_v: 0.4 degrees: 0.0 translate: 0.1 scale: 0.5 shear: 0.0 perspective: 0.0 flipud: 0.0 fliplr: 0.5 bgr: 0.0 mosaic: 1.0 mixup: 0.0 cutmix: 0.0 copy_paste: 0.0 copy_paste_mode: flip auto_augment: randaugment erasing: 0.4 cfg: null tracker: tracktrack.yaml save_dir: C:\Training9\runs\detect\train-2On Thu, Oct 8, 2026 at 6:07 AM Paula Derrenger @.***> wrote:
Thanks for the complete checks and text logs. Epoch 2 is faster (14:27 versus 1:02:39), despite GPU_mem dropping from 28.6G to 17.4G, so these readings alone don’t establish GPU underutilization. Could you paste your exact training command or script, including the model and training settings? Also, does “around 15 epoch” mean 15 GB of shared GPU memory in both epochs? Please provide separate dedicated/shared memory readings at comparable batch positions in each epoch so we can investigate the discrepancy.
— Reply to this email directly, view it on GitHub https://github.com/orgs/ultralytics/discussions/26446?email_source=notifications&email_token=BSIM7DQKA3GIYQSCDVEWEJ35S3OWHA5CNFSNUABIM5UWIORPF5TWS5BNNB2WEL2ENFZWG5LTONUW63SDN5WW2ZLOOQXTCOBYGAZTKNJWUZZGKYLTN5XKOY3PNVWWK3TUUVSXMZLOOSWGM33PORSXEX3DNRUWG2Y#discussioncomment-18803556, or unsubscribe https://github.com/notifications/unsubscribe-auth/BSIM7DX34MSUWFFX5WDRXW35S3OWHAVCNFSNUABIKJSXA33TNF2G64TZHM2TGNJTGYYDINBVHNCGS43DOVZXG2LPNY5TCMBZGE3TMNRUUF3AE . Triage notifications, keep track of coding agent tasks and review pull requests on the go with GitHub Mobile for iOS https://github.com/notifications/mobile/ios/BSIM7DSVPQ3LAONGDZOZWWD5S3OWHA5CNFSNUABIM5UWIORPF5TWS5BNNB2WEL2ENFZWG5LTONUW63SDN5WW2ZLOOQXTCOBYGAZTKNJWUZZGKYLTN5XKOY3PNVWWK3TUUVSXMZLOOSVGM33PORSXEX3JN5ZQ and Android https://github.com/notifications/mobile/android/BSIM7DQHEDECXNLNQEWJLC35S3OWHA5CNFSNUABIM5UWIORPF5TWS5BNNB2WEL2ENFZWG5LTONUW63SDN5WW2ZLOOQXTCOBYGAZTKNJWUZZGKYLTN5XKOY3PNVWWK3TUUVSXMZLOOSXGM33PORSXEX3BNZSHE33JMQ. Download it today! You are receiving this because you commented.Message ID: @.*** com>
- Paula DerrengerUltralytics
Thanks for clarifying that it was 15 GB of shared GPU memory and sharing the configuration; sorry for requesting the script again. To test whether batch-related memory pressure contributes, could you compare your
batch=64run withbatch=16, keeping all other settings unchanged? See the batch-size guidance. Please share epoch 2–3 text logs and dedicated/shared GPU memory readings from the comparison; this will help narrow down the cause without assuming the memory change is a bug.
here are my yolo checks yolo checks Ultralytics 8.4.155 Python-3.13.12 torch-2.12.0.dev20260408+cu128 CUDA:0 (NVIDIA GeForce RTX 5090, 32607MiB) Setup complete (24 CPUs, 63.5 GB RAM, 1738.9/1881.5 GB disk)
OS Windows-11-10.0.26200-SP0 Environment Windows Python 3.13.12 Install pip Path C:\Users\devth\miniconda3\Lib\site-packages\ultralytics RAM 63.46 GB Disk 1738.9/1881.5 GB CPU Intel Core Ultra 9 285K CPU count 24 GPU NVIDIA GeForce RTX 5090, 32607MiB GPU count 1 CUDA 12.8
cloudpickle 3.1.2>=3.1.1 filelock 3.29.0>=3.16.1 numpy 2.4.4>=1.23.0; platform_system != "Darwin" numpy 2.4.4!=2.0.,!=2.1.,!=2.2.*,!=2.3.0,!=2.3.1,!=2.3.2,!=2.3.3,!=2.3.4,>=1.23.0; platform_system == "Darwin" matplotlib 3.10.8>=3.3.0 opencv-python 4.13.0.92!=4.13.0.90,>=4.7.0 pillow 12.2.0>=7.1.2 pyyaml 6.0.3>=5.3.1 requests 2.32.5>=2.23.0 torch 2.12.0.dev20260408+cu128>=1.8.0 torch 2.12.0.dev20260408+cu128!=2.4.0,>=1.8.0; sys_platform == "win32" torchvision 0.27.0.dev20260407+cu128>=0.9.0 psutil 7.2.2>=5.8.0 polars 1.40.1>=0.20.0 nvidia-ml-py 13.610.43>=12.0.0 ultralytics-thop 2.1.6>=2.1.6 ultralytics-platform 0.1.48>=0.1.45; python_version >= "3.11"
(shared memory used in first and second epoch was around 15 epoch) these are the first two epoch details in Text
 Epoch    GPU_mem   box_loss   cls_loss    l1_loss  Instances       Size
  1/200      28.6G      1.174      1.891    0.01363         90
640: 33% ━━━╸──────── 1561/4702 1.1it/s 23:55<49:25libpng warning: iCCP: known incorrect sRGB profile 1/200 28.6G 1.15 1.582 0.01327 91 640: 56% ━━━━━━╸───── 2674/4702 1.3it/s 40:45<26:43libpng warning: iCCP: known incorrect sRGB profile 1/200 28.6G 1.144 1.475 0.01325 77 640: 72% ━━━━━━━━╸─── 3419/4702 1.3it/s 49:44<16:45libpng warning: iCCP: known incorrect sRGB profile 1/200 28.6G 1.144 1.471 0.01325 84 640: 73% ━━━━━━━━╸─── 3451/4702 1.4it/s 50:07<14:41libpng warning: iCCP: known incorrect sRGB profile 1/200 28.6G 1.146 1.395 0.01332 84 640: 92% ━━━━━━━━━━━─ 4370/4702 5.0it/s 1:01:16<1:07libpng warning: iCCP: known incorrect sRGB profile 1/200 28.6G 1.146 1.373 0.01335 74 640: 100% ━━━━━━━━━━━━ 4702/4702 1.3it/s 1:02:39 Class Images Instances Box(P R mAP50 mAP50-95): 22% ━━╸───────── 57/256 2.5it/s 26.7s<1:19libpng warning: iCCP: known incorrect sRGB profile Class Images Instances Box(P R mAP50 mAP50-95): 47% ━━━━━╸────── 122/256 2.3it/s 1:10<59.4slibpng warning: iCCP: known incorrect sRGB profile Class Images Instances Box(P R mAP50 mAP50-95): 100% ━━━━━━━━━━━━ 256/256 1.9it/s 2:17 all 32677 47931 0.863 0.726 0.818 0.584
Epoch GPU_mem box_loss cls_loss l1_loss InstancesSize 2/200 17.4G 1.183 1.123 0.01413 74 640: 29% ━━━╸──────── 1380/4702 5.1it/s 4:16<10:45libpng warning: iCCP: known incorrect sRGB profile 2/200 17.4G 1.196 1.133 0.01441 107 640: 55% ━━━━━━╸───── 2615/4702 5.8it/s 8:09<6:02libpng warning: iCCP: known incorrect sRGB profile 2/200 17.4G 1.193 1.126 0.01434 99 640: 64% ━━━━━━━╸──── 3020/4702 5.5it/s 9:20<5:06libpng warning: iCCP: known incorrect sRGB profile 2/200 17.4G 1.193 1.125 0.01435 106 640: 67% ━━━━━━━━──── 3179/4702 5.6it/s 9:50<4:33libpng warning: iCCP: known incorrect sRGB profile 2/200 17.4G 1.192 1.121 0.01434 109 640: 81% ━━━━━━━━━╸── 3847/4702 5.5it/s 11:52<2:36libpng warning: iCCP: known incorrect sRGB profile 2/200 17.4G 1.195 1.12 0.01437 86 640: 100% ━━━━━━━━━━━━ 4702/4702 5.4it/s 14:27 Class Images Instances Box(P R mAP50 mAP50-95): 22% ━━╸───────── 57/256 2.5it/s 20.6s<1:21libpng warning: iCCP: known incorrect sRGB profile Class Images Instances Box(P R mAP50 mAP50-95): 47% ━━━━━╸────── 122/256 2.1it/s 50.3s<1:04libpng warning: iCCP: known incorrect sRGB profile Class Images Instances Box(P R mAP50 mAP50-95): 100% ━━━━━━━━━━━━ 256/256 2.3it/s 1:51 all 32677 47931 0.889 0.778 0.87 0.638
On Tue, Oct 6, 2026 at 10:29 AM Paula Derrenger @.***> wrote:
No—by “yolo checks output,” I mean the terminal’s software/hardware summary, not results.csv. Please activate the same Python environment used for training, run yolo checks in PowerShell, and paste its complete text output; it reports your Ultralytics, Python, PyTorch, and GPU details (environment checks reference https://docs.ultralytics.com/reference/utils/checks#ultralytics.utils.checks.check_yolo). (docs.ultralytics.com https://docs.ultralytics.com/reference/utils/checks) Thanks for sharing the driver information. Please also provide separate dedicated/shared GPU-memory readings at matching points in epochs 1 and 2, plus your training command or configuration, so we can investigate without assuming the memory drop indicates hardware underutilization.
— Reply to this email directly, view it on GitHub https://github.com/orgs/ultralytics/discussions/26446?email_source=notifications&email_token=BSIM7DSK7MKPVE56RJJGI435SR33BA5CNFSNUABIM5UWIORPF5TWS5BNNB2WEL2ENFZWG5LTONUW63SDN5WW2ZLOOQXTCOBXG4YDKNJSUZZGKYLTN5XKOY3PNVWWK3TUUVSXMZLOOSWGM33PORSXEX3DNRUWG2Y#discussioncomment-18770552, or unsubscribe https://github.com/notifications/unsubscribe-auth/BSIM7DRBVYTDNBPWAZRUQXL5SR33BAVCNFSNUABIKJSXA33TNF2G64TZHM2TGNJTGYYDINBVHNCGS43DOVZXG2LPNY5TCMBZGE3TMNRUUF3AE . Triage notifications, keep track of coding agent tasks and review pull requests on the go with GitHub Mobile for iOS https://github.com/notifications/mobile/ios/BSIM7DXMRZI3YZR75VFDAGT5SR33BA5CNFSNUABIM5UWIORPF5TWS5BNNB2WEL2ENFZWG5LTONUW63SDN5WW2ZLOOQXTCOBXG4YDKNJSUZZGKYLTN5XKOY3PNVWWK3TUUVSXMZLOOSVGM33PORSXEX3JN5ZQ and Android https://github.com/notifications/mobile/android/BSIM7DRXQCNW5JUZNGVDHU35SR33BA5CNFSNUABIM5UWIORPF5TWS5BNNB2WEL2ENFZWG5LTONUW63SDN5WW2ZLOOQXTCOBXG4YDKNJSUZZGKYLTN5XKOY3PNVWWK3TUUVSXMZLOOSXGM33PORSXEX3BNZSHE33JMQ. Download it today! You are receiving this because you commented.Message ID: @.*** com>
- Paula DerrengerUltralytics
Thanks for the complete checks and text logs. Epoch 2 is faster (14:27 versus 1:02:39), despite
GPU_memdropping from 28.6G to 17.4G, so these readings alone don’t establish GPU underutilization. Could you paste your exact training command or script, including the model and training settings? Also, does “around 15 epoch” mean 15 GB of shared GPU memory in both epochs? Please provide separate dedicated/shared memory readings at comparable batch positions in each epoch so we can investigate the discrepancy.
pls explain what is yolo checks output? what do you mean by that ? are you referring to results.csv from runs folder??
here is my driver detail PS C:\Training9> nvidia-smi Tue Oct 6 09:22:05 2026 +-----------------------------------------------------------------------------------------+ | NVIDIA-SMI 610.60 KMD Version: 610.60 CUDA UMD Version: 13.3 | +-----------------------------------------+------------------------+----------------------+ | GPU Name Driver-Model | Bus-Id Disp.A | Volatile Uncorr. ECC | | Fan Temp Perf Pwr:Usage/Cap | Memory-Usage | GPU-Util Compute M. | | | | MIG M. | |=========================================+========================+======================| | 0 NVIDIA GeForce RTX 5090 WDDM | 00000000:01:00.0 On | N/A | | 57% 73C P1 479W / 575W | 19362MiB / 32607MiB | 80% Default | | | | N/A | +-----------------------------------------+------------------------+----------------------+
PS C:\Training9> nvcc --version nvcc: NVIDIA (R) Cuda compiler driver Copyright (c) 2005-2025 NVIDIA Corporation Built on Wed_Jan_15_19:38:46_Pacific_Standard_Time_2025 Cuda compilation tools, release 12.8, V12.8.61 Build cuda_12.8.r12.8/compiler.35404655_0
epoch 1 vram usage(in terminal) = 28.6 GB and in task manager ~29.1 GB epoch 2 to epoch 73 vram usage (in terminal) = 17.4 GB and in task manager vram usage is 18.1 GB
73rd epoch
Epoch GPU_mem box_loss cls_loss l1_loss InstancesSize 73/200 17.4G 0.9935 0.7903 0.01002 86 640: 0% ──────────── 4/4702 4.4it/s 1.0s<17:51libpng warning: iCCP: known incorrect sRGB profile 73/200 17.4G 1.023 0.7368 0.01159 84 640: 9% ━─────────── 446/4702 5.8it/s 1:17<12:17libpng warning: iCCP: known incorrect sRGB profile 73/200 17.4G 1.024 0.7397 0.01152 93 640: 63% ━━━━━━━╸──── 2990/4702 5.6it/s 8:41<5:06libpng warning: iCCP: known incorrect sRGB profile 73/200 17.4G 1.024 0.7402 0.01151 119 640: 65% ━━━━━━━╸──── 3080/4702 5.3it/s 8:57<5:06libpng warning: iCCP: known incorrect sRGB profile 73/200 17.4G 1.026 0.7422 0.01152 113 640: 76% ━━━━━━━━━─── 3586/4702 5.6it/s 10:28<3:20libpng warning: iCCP: known incorrect sRGB profile 73/200 17.4G 1.029 0.7459 0.01156 78 640: 100% ━━━━━━━━━━━━ 4702/4702 5.7it/s 13:46 Class Images Instances Box(P R mAP50 mAP50-95): 22% ━━╸───────── 57/256 2.7it/s 20.9s<1:13libpng warning: iCCP: known incorrect sRGB profile Class Images Instances Box(P R mAP50 mAP50-95): 47% ━━━━━╸────── 122/256 2.1it/s 48.9s<1:02libpng warning: iCCP: known incorrect sRGB profile Class Images Instances Box(P R mAP50 mAP50-95): 100% ━━━━━━━━━━━━ 256/256 2.4it/s 1:47 all 32677 47931 0.927 0.855 0.93 0.724
since you are trying to replicate my detection code , I must tell you in my train folder I have around 150000 images with txt files, 32000 in val and 31000 in test
while you are at it, I need a change in the ultralytics package, since it can detect and restore corrupt JPG(and many more errors), would it possible for you to make this change permanent? since it a type of fix and everyone wants that and no one wants to ultralytics package to just internally fix the images i know it won't be implemented by of security reasons by just keep in future todo list
to be honest , in my view, the ultralytics package does not fully utilise the hardware. I have run barebone code that using just the pytorch and few more basic codes and they utilise
thank you in advance
On Mon, Oct 5, 2026 at 10:42 PM Paula Derrenger @.***> wrote:
Thanks for sharing the script. A plausible explanation for the drop from 28.6G to 17.4G is cache cleanup between epochs: the training loop https://docs.ultralytics.com/reference/engine/trainer#ultralytics.engine.trainer.BaseTrainer._do_train conditionally clears reserved memory before validation and at epoch end when usage exceeds 50% of device capacity. This could explain the drop, but does not establish why Windows reports shared-memory usage. ( docs.ultralytics.com https://docs.ultralytics.com/reference/engine/trainer) Please share yolo checks output, your NVIDIA driver version, and dedicated/shared GPU-memory readings as text at matching points in both epochs so we can check your installed version and distinguish the two observations.
— Reply to this email directly, view it on GitHub https://github.com/orgs/ultralytics/discussions/26446?email_source=notifications&email_token=BSIM7DSOVWTY24AP4M6GU5D5SPI7FA5CNFSNUABIM5UWIORPF5TWS5BNNB2WEL2ENFZWG5LTONUW63SDN5WW2ZLOOQXTCOBXGYZTCOJVUZZGKYLTN5XKOY3PNVWWK3TUUVSXMZLOOSWGM33PORSXEX3DNRUWG2Y#discussioncomment-18763195, or unsubscribe https://github.com/notifications/unsubscribe-auth/BSIM7DUUEOVQC4A4Q7SCGUL5SPI7FAVCNFSNUABIKJSXA33TNF2G64TZHM2TGNJTGYYDINBVHNCGS43DOVZXG2LPNY5TCMBZGE3TMNRUUF3AE . Triage notifications, keep track of coding agent tasks and review pull requests on the go with GitHub Mobile for iOS https://github.com/notifications/mobile/ios/BSIM7DVWK73UY4PTSMIRTTL5SPI7FA5CNFSNUABIM5UWIORPF5TWS5BNNB2WEL2ENFZWG5LTONUW63SDN5WW2ZLOOQXTCOBXGYZTCOJVUZZGKYLTN5XKOY3PNVWWK3TUUVSXMZLOOSVGM33PORSXEX3JN5ZQ and Android https://github.com/notifications/mobile/android/BSIM7DW6Q4F7VJMCOTRDMPD5SPI7FA5CNFSNUABIM5UWIORPF5TWS5BNNB2WEL2ENFZWG5LTONUW63SDN5WW2ZLOOQXTCOBXGYZTCOJVUZZGKYLTN5XKOY3PNVWWK3TUUVSXMZLOOSXGM33PORSXEX3BNZSHE33JMQ. Download it today! You are receiving this because you commented.Message ID: @.*** com>
- Paula DerrengerUltralytics
No—by “
yolo checksoutput,” I mean the terminal’s software/hardware summary, notresults.csv. Please activate the same Python environment used for training, runyolo checksin PowerShell, and paste its complete text output; it reports your Ultralytics, Python, PyTorch, and GPU details (environment checks reference). (docs.ultralytics.com) Thanks for sharing the driver information. Please also provide separate dedicated/shared GPU-memory readings at matching points in epochs 1 and 2, plus your training command or configuration, so we can investigate without assuming the memory drop indicates hardware underutilization.