Ví dụ khám phá VOC


Chào mừng đến với sổ tay API Ultralytics Explorer. Sổ tay này giới thiệu các tài nguyên có sẵn để khám phá tập dữ liệu bằng tìm kiếm ngữ nghĩa, tìm kiếm vector và truy vấn SQL.
Thử yolo explorer (được hỗ trợ bởi API Explorer)
Cài đặt ultralytics và chạy yolo explorer trong terminal của bạn để chạy các truy vấn tùy chỉnh và tìm kiếm ngữ nghĩa trong trình duyệt của bạn.
Lưu ý từ Cộng đồng ⚠️
Kể từ ultralytics>=8.3.10, hỗ trợ Ultralytics Explorer đã bị ngừng. Các tính năng khám phá tập dữ liệu tương tự (và mở rộng) có sẵn trong Nền tảng Ultralytics.
Thiết lập
Cài đặt ultralytics và các yêu cầu cần thiết các phần phụ thuộc, sau đó kiểm tra phần mềm và phần cứng.
!uv pip install ultralytics[explorer] openai
yolo checks
Tìm kiếm tương đồng
Sử dụng sức mạnh của tìm kiếm tương đồng vectơ để tìm các điểm dữ liệu tương tự trong tập dữ liệu của bạn cùng với khoảng cách của chúng trong không gian nhúng. Chỉ cần tạo một bảng nhúng cho cặp tập dữ liệu-mô hình đã cho. Nó chỉ cần thiết một lần và nó được tự động sử dụng lại.
exp = Explorer("VOC.yaml", model="yolo26n.pt")
exp.create_embeddings_table()
Sau khi bảng embedding được xây dựng, bạn có thể chạy tìm kiếm ngữ nghĩa theo bất kỳ cách nào sau đây:
- Trên một chỉ mục/danh sách các chỉ mục nhất định trong tập dữ liệu, ví dụ:
exp.get_similar(idx=[1, 10], limit=10) - Trên bất kỳ hình ảnh / danh sách hình ảnh nào không có trong tập dữ liệu - exp.get_similar(img=["path/to/img1", "path/to/img2"], limit=10). Trong trường hợp có nhiều đầu vào, tổng hợp các embedding của chúng sẽ được sử dụng.
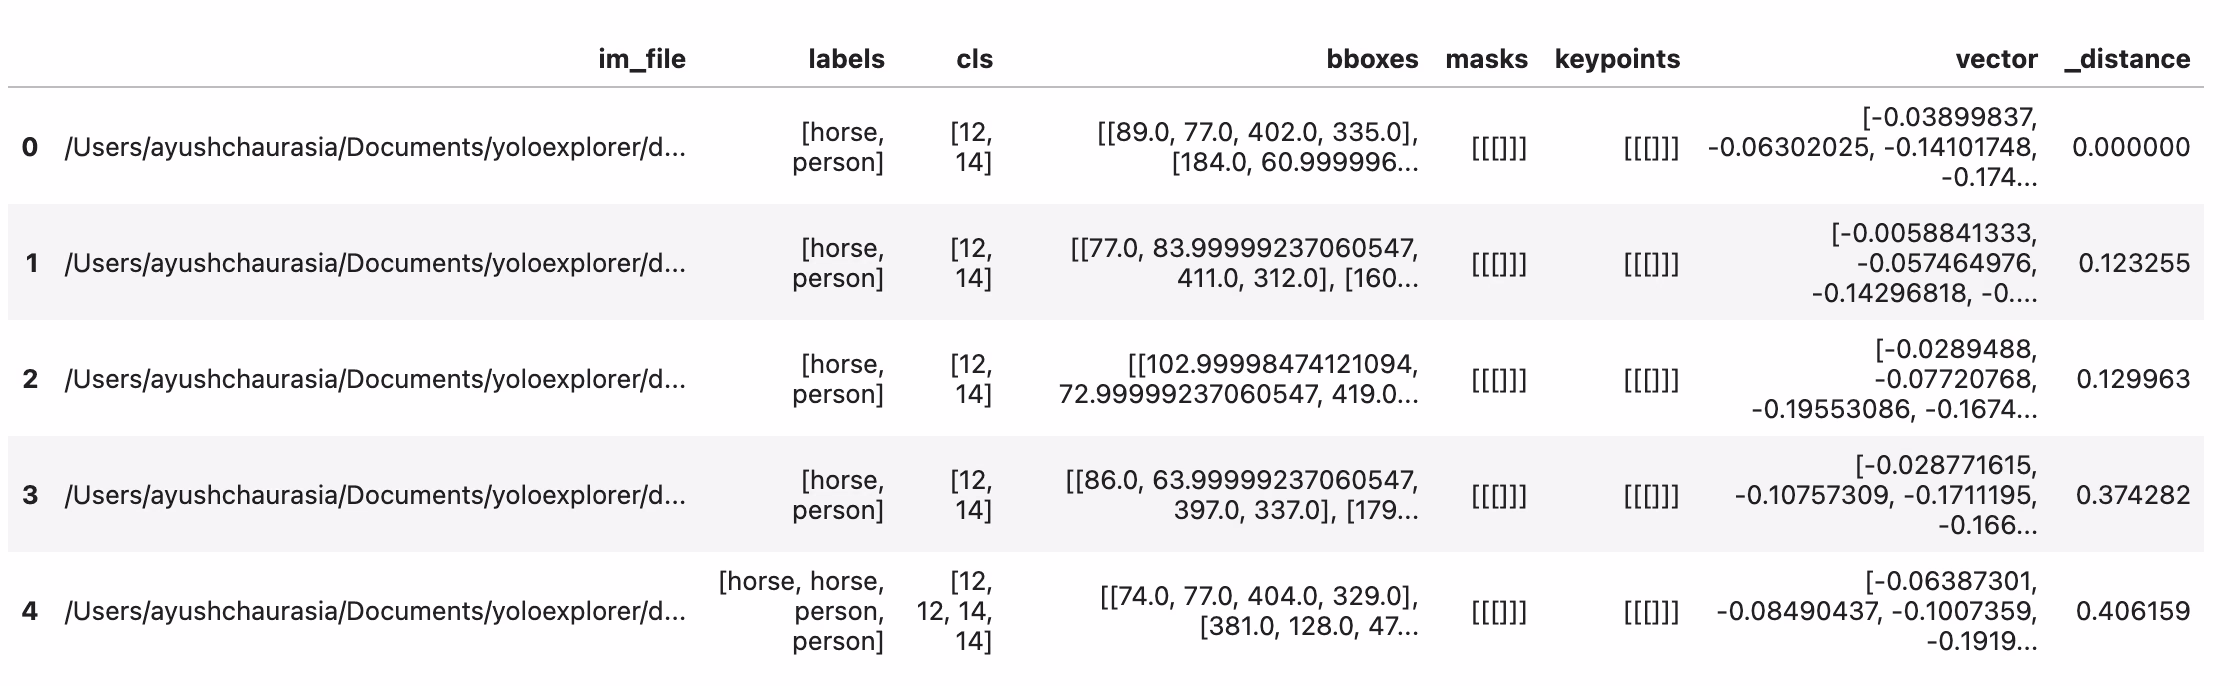
Bạn nhận được một DataFrame của Pandas với số lượng giới hạn các điểm dữ liệu tương tự nhất với đầu vào, cùng với khoảng cách của chúng trong không gian embedding. Bạn có thể sử dụng tập dữ liệu này để thực hiện lọc thêm.
# Search dataset by index
similar = exp.get_similar(idx=1, limit=10)
similar.head()
Bạn cũng có thể vẽ biểu đồ các mẫu tương tự trực tiếp bằng cách sử dụng plot_similar util
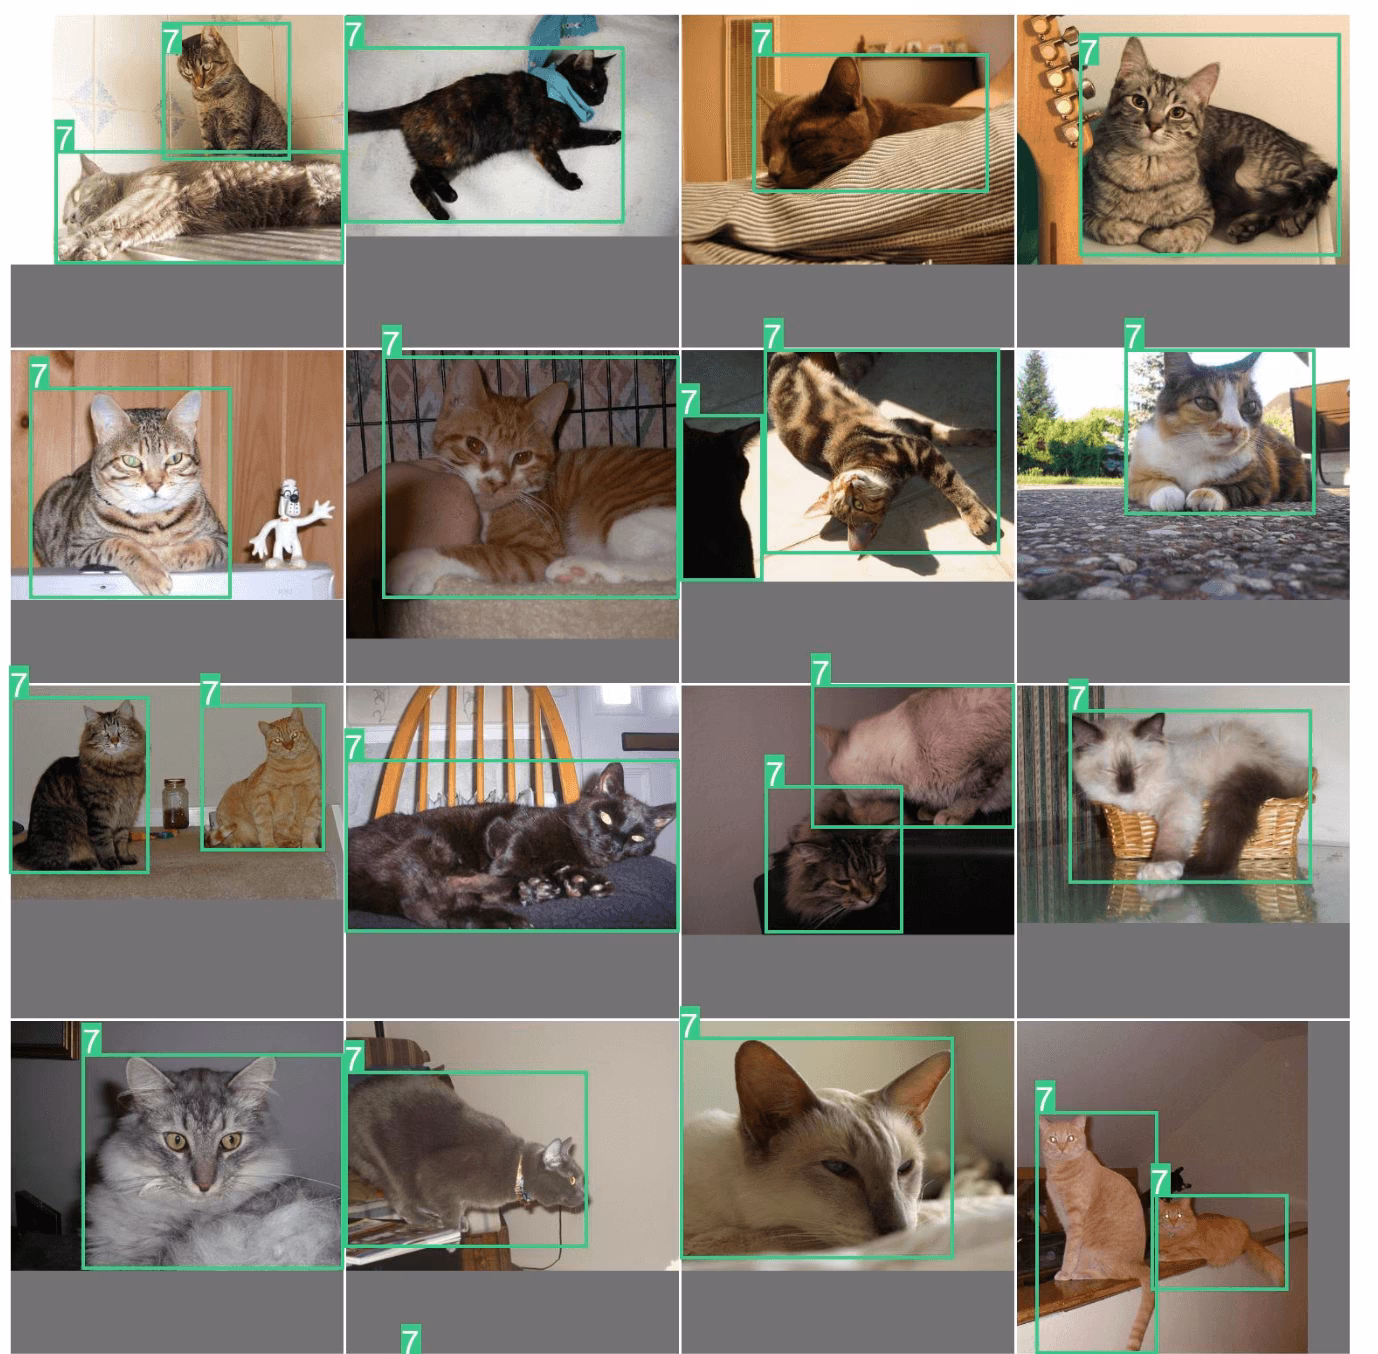
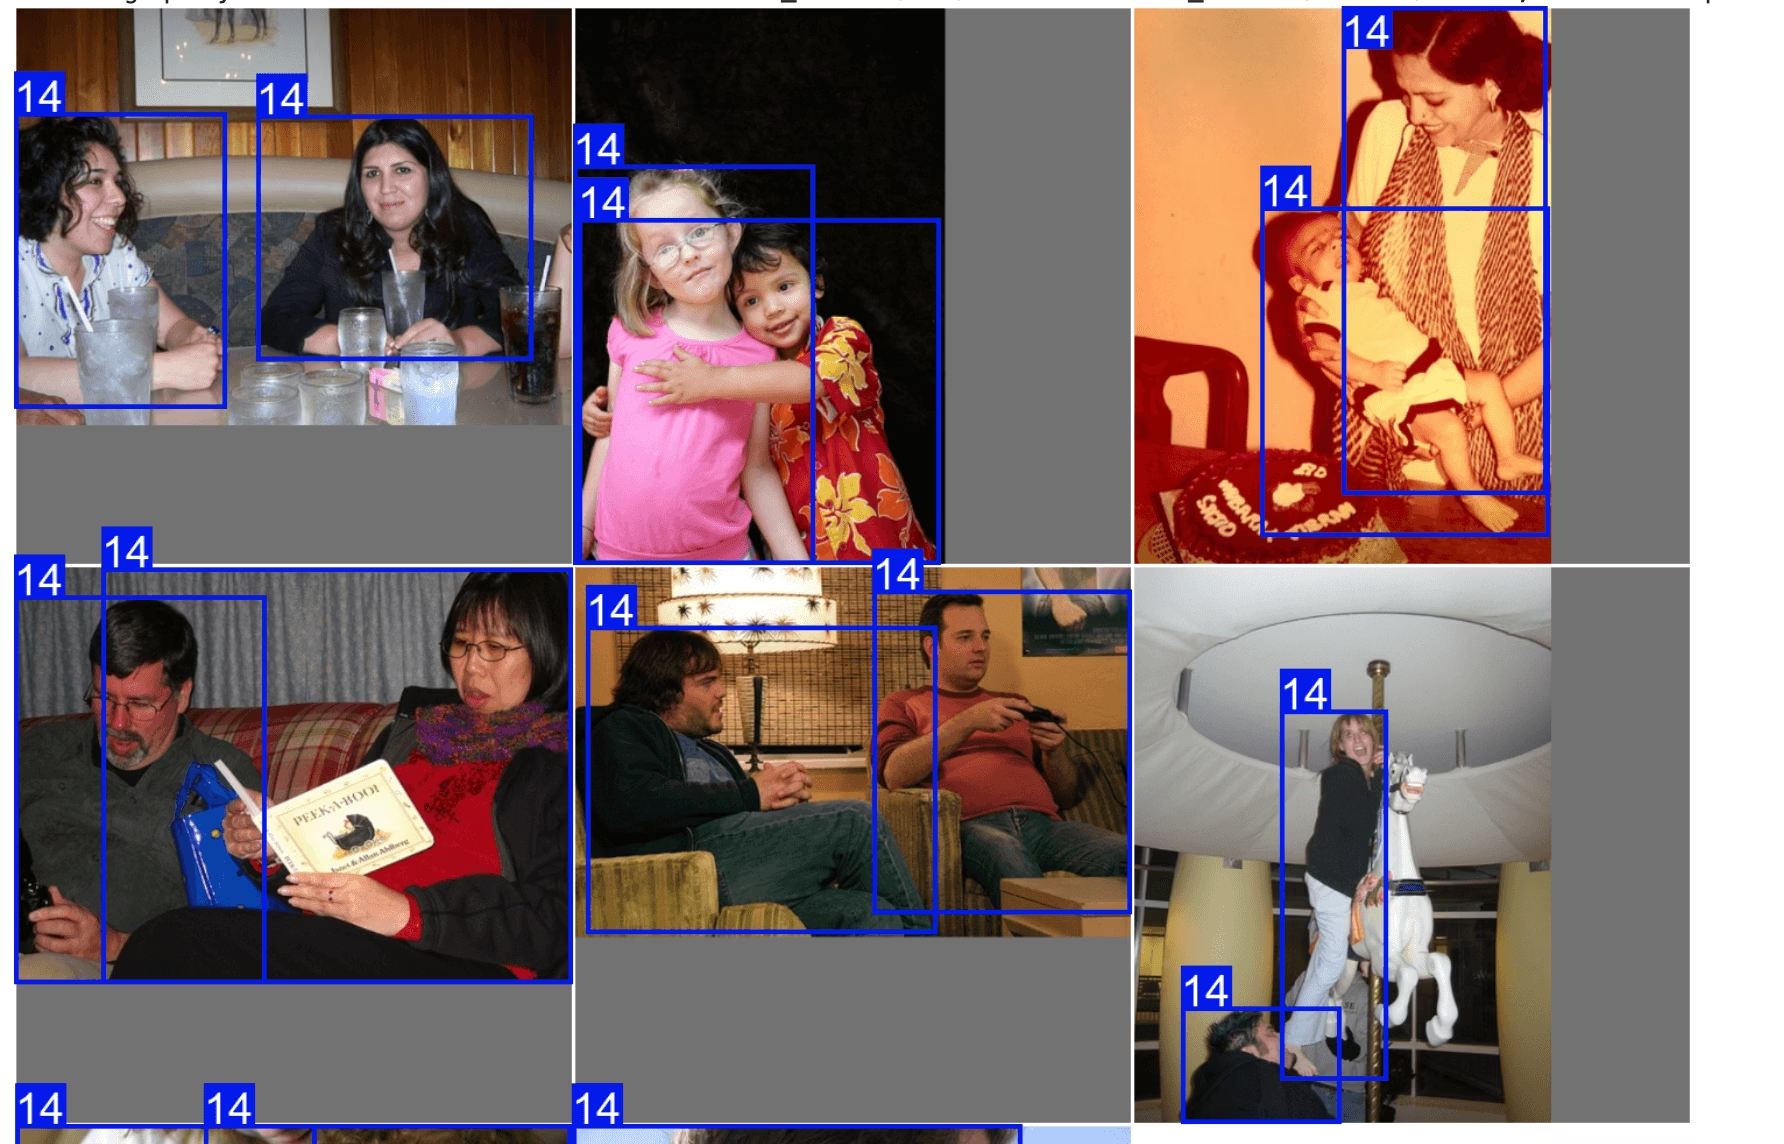
exp.plot_similar(idx=6500, limit=20)
exp.plot_similar(idx=[100, 101], limit=10)  # Can also pass list of idxs or imgs

exp.plot_similar(img="https://ultralytics.com/images/bus.jpg", limit=10, labels=False)  # Can also pass external images
Hỏi AI: Tìm kiếm hoặc Lọc bằng Ngôn ngữ Tự nhiên
Bạn có thể nhắc đối tượng Explorer với loại điểm dữ liệu bạn muốn xem, và nó sẽ cố gắng trả về một DataFrame với các kết quả đó. Vì nó được hỗ trợ bởi LLM, nó không phải lúc nào cũng chính xác. Trong trường hợp đó, nó sẽ trả về None.
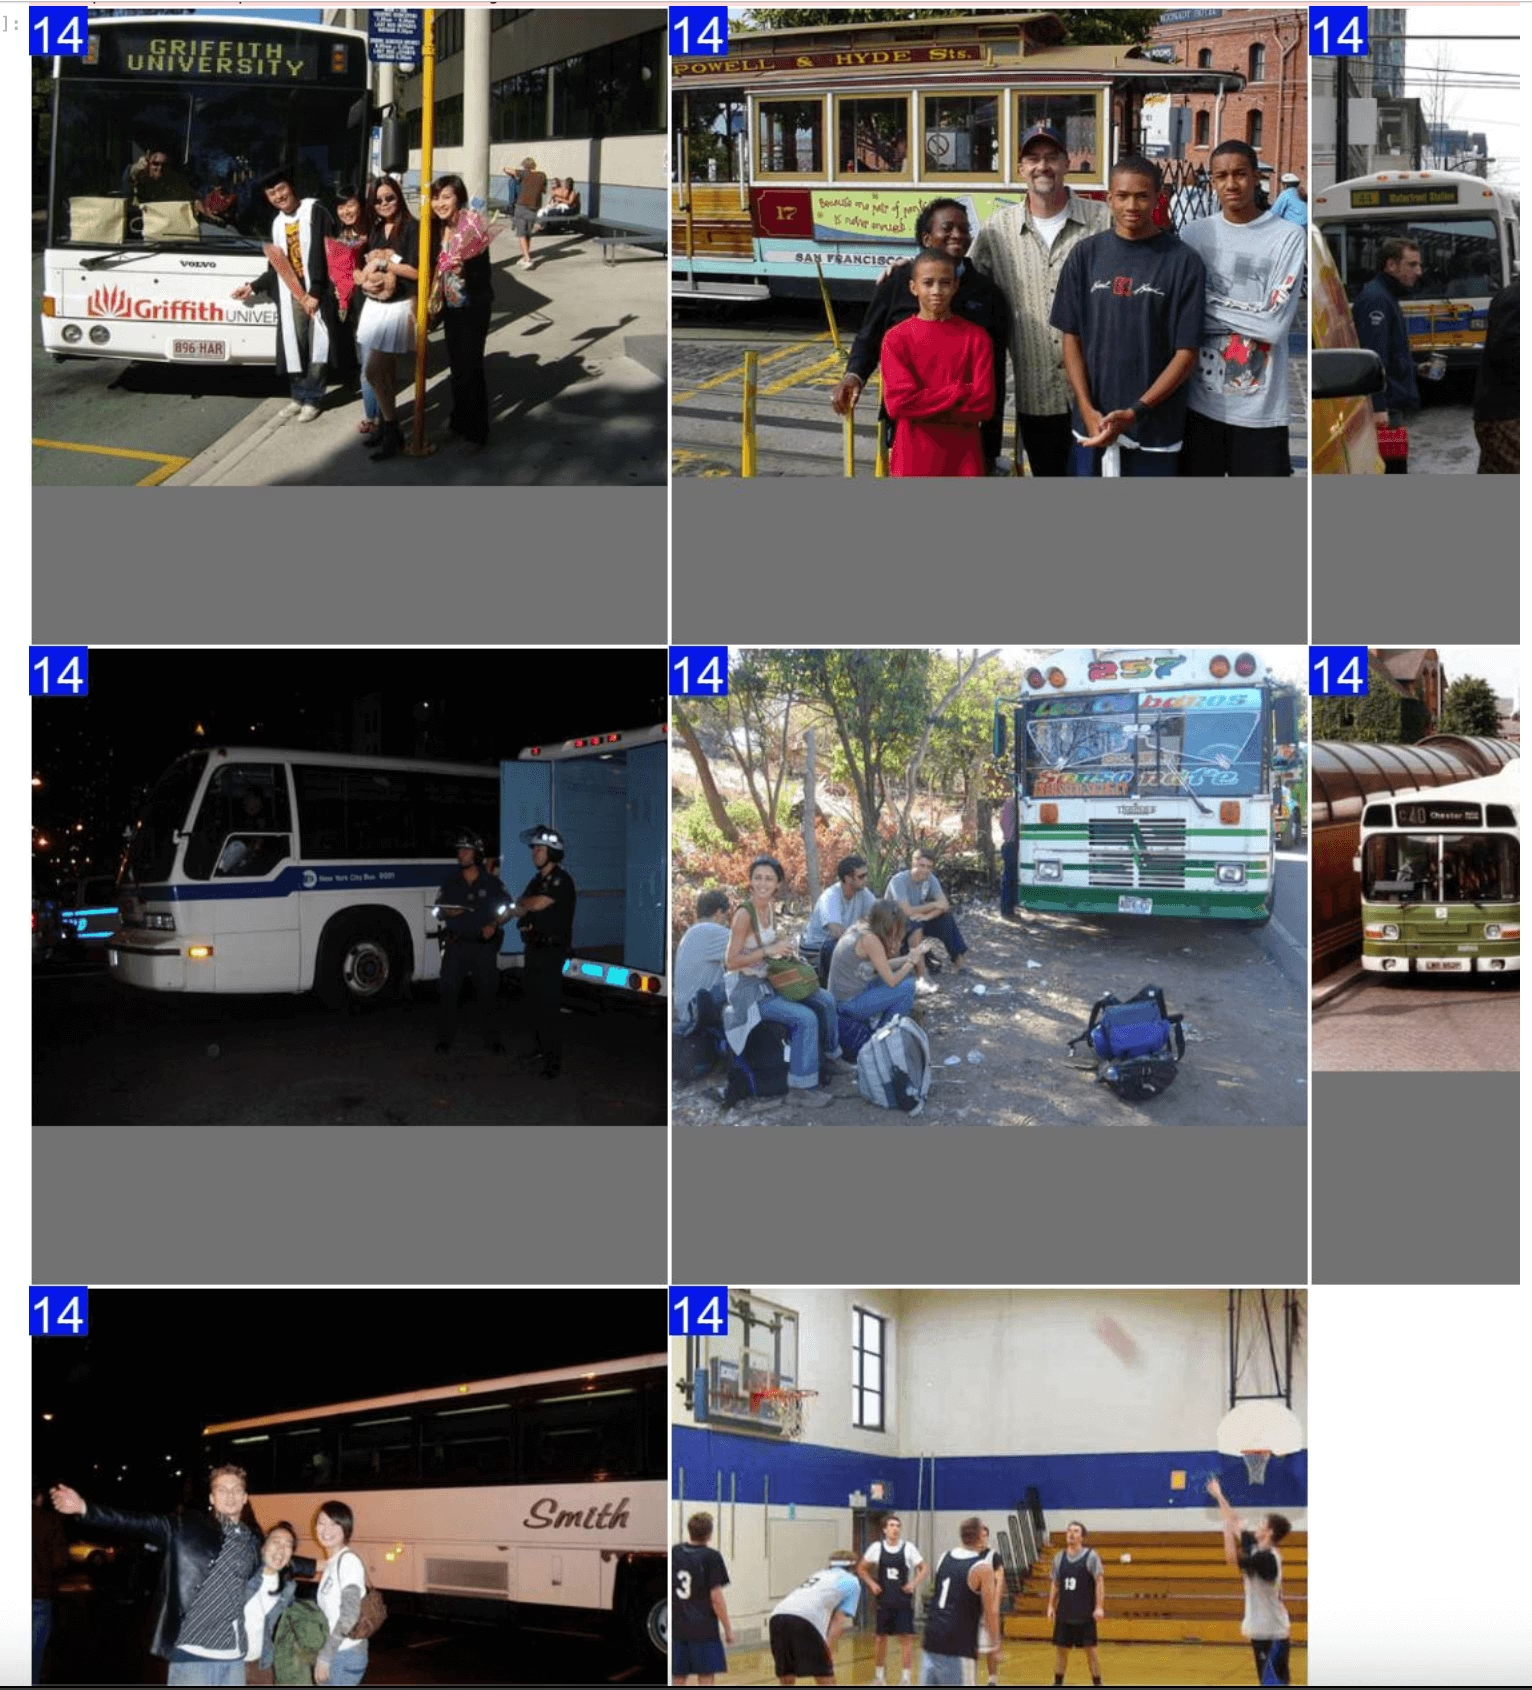
df = exp.ask_ai("show me images containing more than 10 objects with at least 2 persons")
df.head(5)
Để vẽ biểu đồ các kết quả này, bạn có thể sử dụng plot_query_result tiện ích. Ví dụ:
plt = plot_query_result(exp.ask_ai("show me 10 images containing exactly 2 persons"))
Image.fromarray(plt)
# plot
from PIL import Image
from ultralytics.data.explorer import plot_query_result

plt = plot_query_result(exp.ask_ai("show me 10 images containing exactly 2 persons"))
Image.fromarray(plt)
Chạy Truy vấn SQL trên Tập dữ liệu của Bạn
Đôi khi bạn có thể muốn điều tra các mục nhất định trong tập dữ liệu của mình. Để làm điều này, Explorer cho phép bạn thực hiện các truy vấn SQL. Nó chấp nhận một trong các định dạng sau:
- Các truy vấn bắt đầu bằng "WHERE" sẽ tự động chọn tất cả các cột. Điều này có thể được coi là một truy vấn viết tắt.
- Bạn cũng có thể viết các truy vấn đầy đủ, nơi bạn có thể chỉ định các cột cần chọn.
Điều này có thể được sử dụng để điều tra hiệu suất mô hình và các điểm dữ liệu cụ thể. Ví dụ:
- giả sử mô hình của bạn gặp khó khăn với những hình ảnh có người và chó. Bạn có thể viết một truy vấn như thế này để chọn các điểm có ít nhất 2 người VÀ ít nhất một con chó.
Bạn có thể kết hợp truy vấn SQL và tìm kiếm ngữ nghĩa để lọc xuống loại kết quả cụ thể
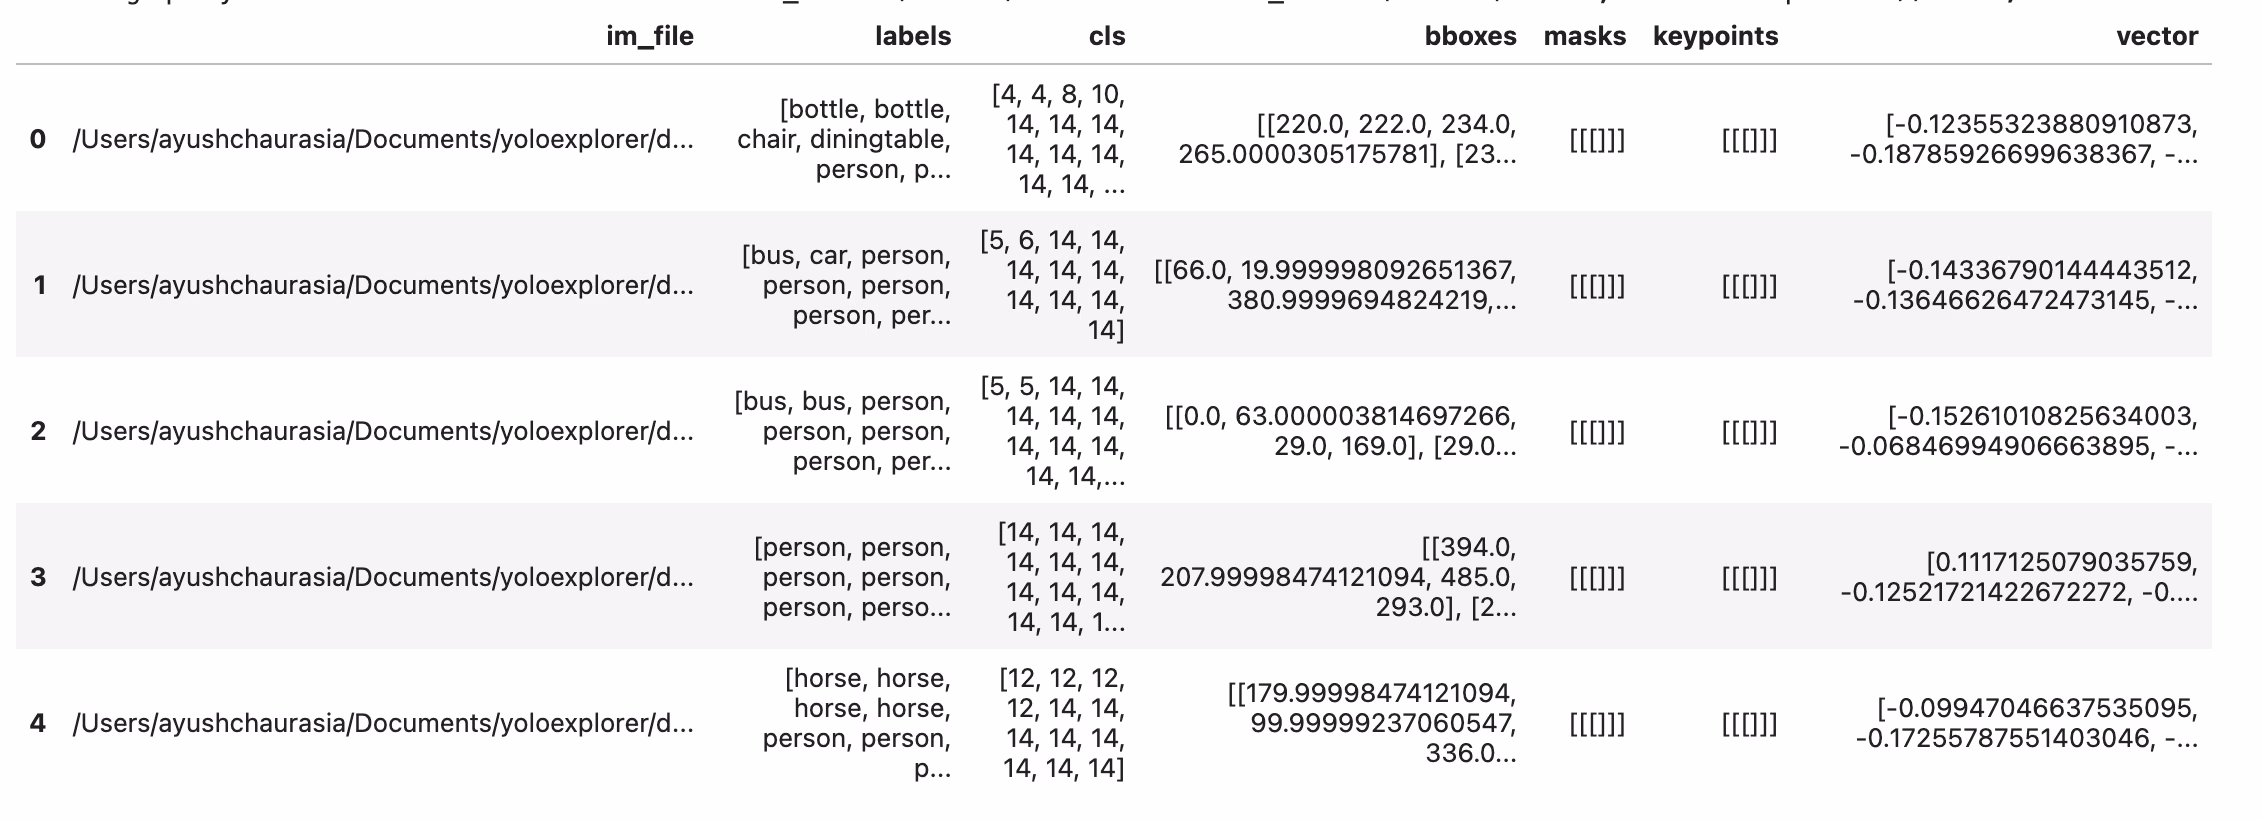
table = exp.sql_query("WHERE labels LIKE '%person, person%' AND labels LIKE '%dog%' LIMIT 10")
exp.plot_sql_query("WHERE labels LIKE '%person, person%' AND labels LIKE '%dog%' LIMIT 10", labels=True)
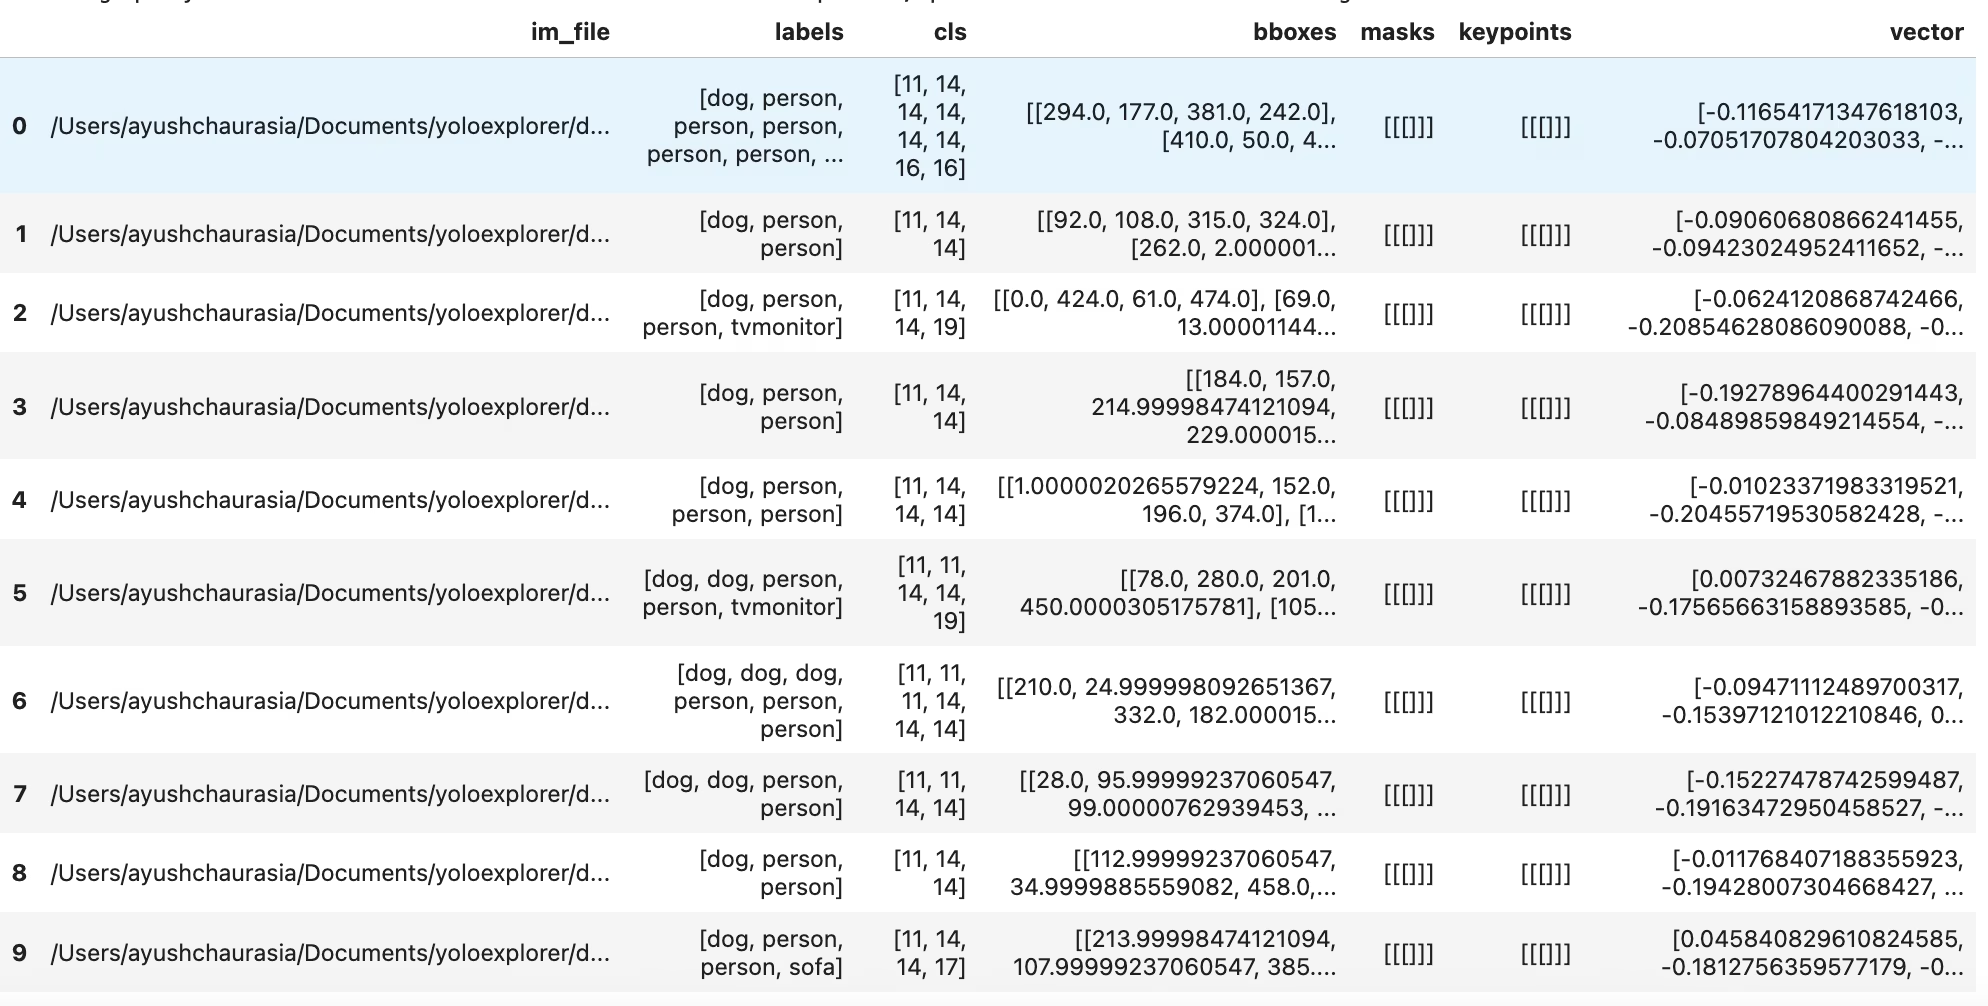
table = exp.sql_query("WHERE labels LIKE '%person, person%' AND labels LIKE '%dog%' LIMIT 10")
print(table)
Tương tự như tìm kiếm tương đồng, bạn cũng có một tiện ích để vẽ trực tiếp các truy vấn SQL bằng cách sử dụng exp.plot_sql_query
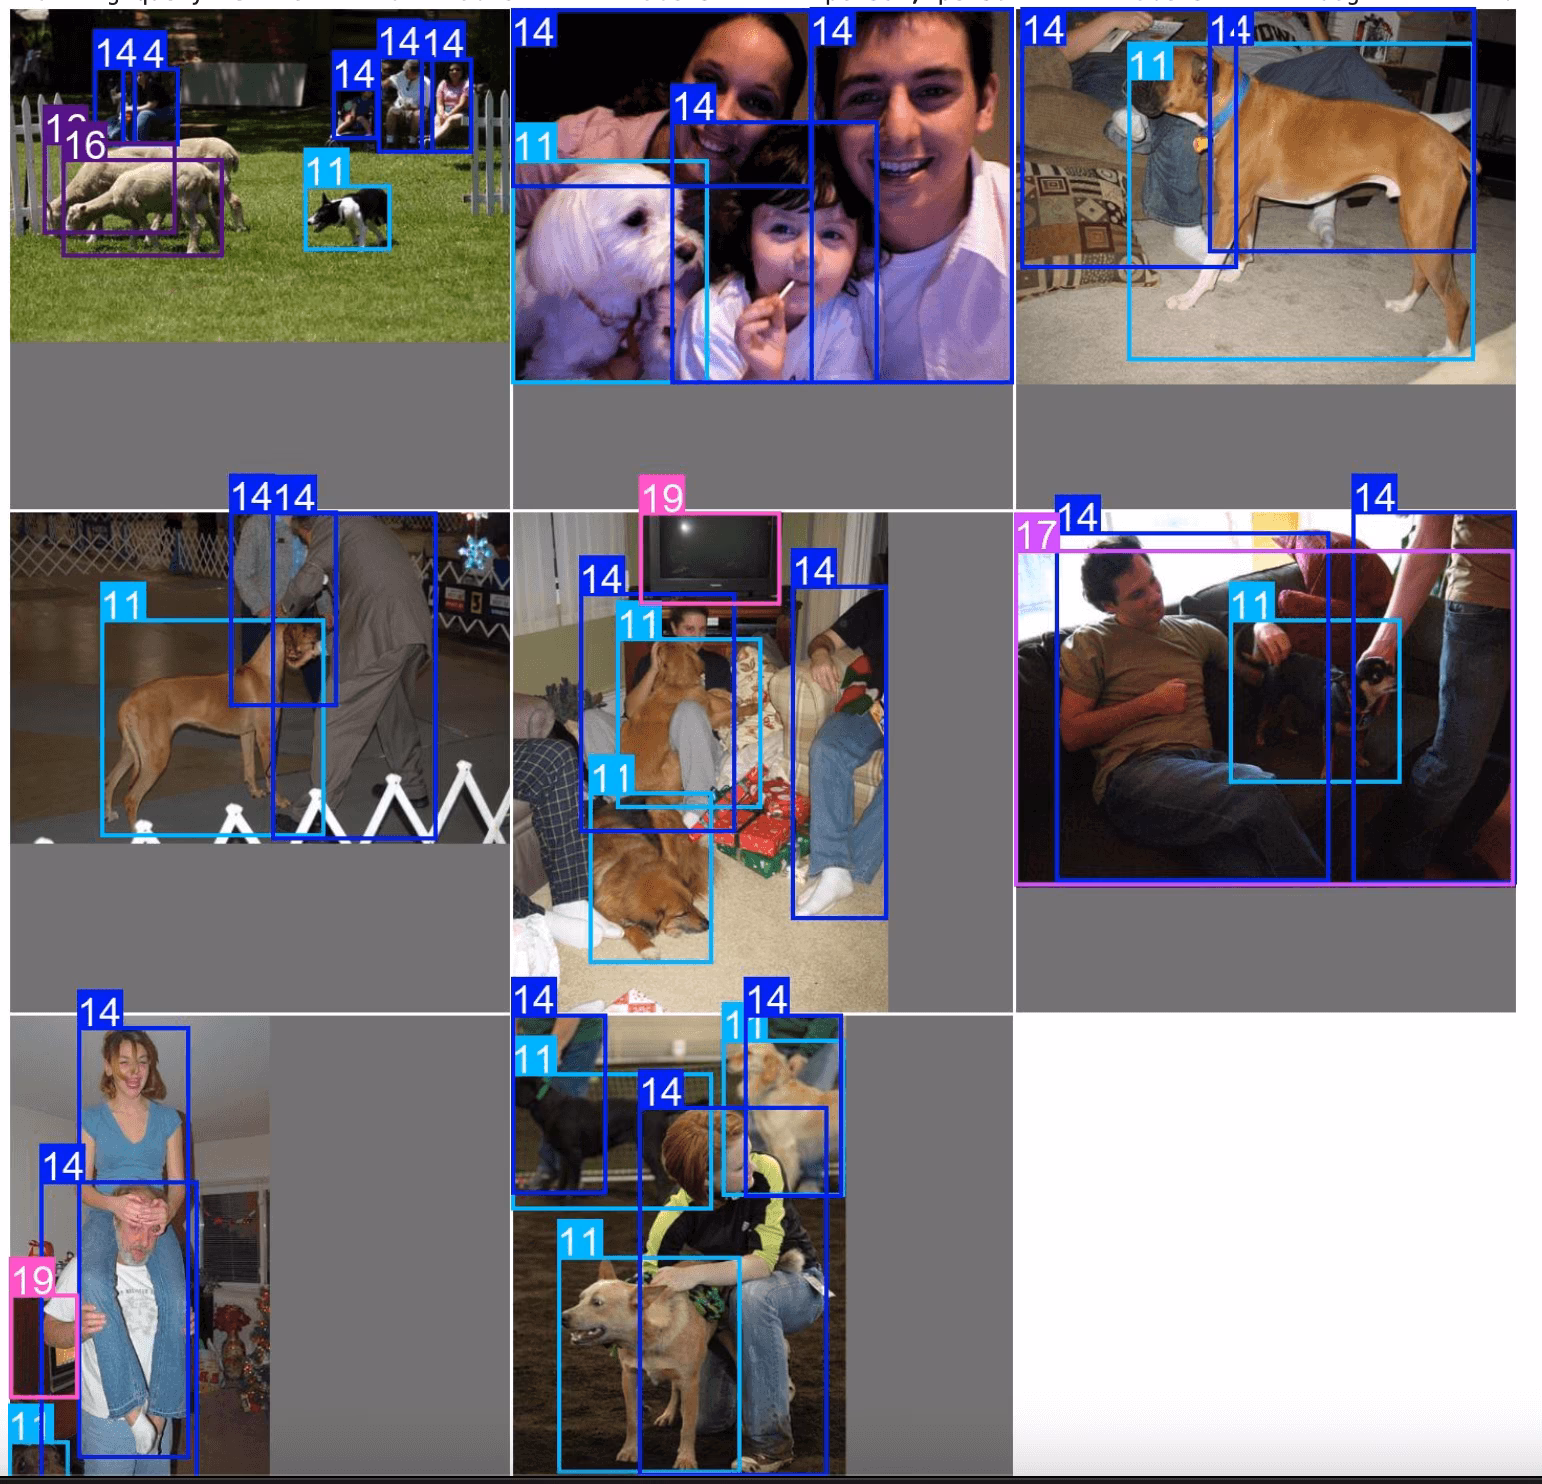
exp.plot_sql_query("WHERE labels LIKE '%person, person%' AND labels LIKE '%dog%' LIMIT 10", labels=True)
Làm việc với bảng nhúng (Nâng cao)
Explorer hoạt động trên LanceDB các bảng bên trong. Bạn có thể truy cập trực tiếp bảng này bằng cách sử dụng Explorer.table đối tượng và chạy các truy vấn thô, đẩy các bộ lọc trước và sau, v.v.
table = exp.table
print(table.schema)
Chạy truy vấn thô
Tìm kiếm Vector tìm các vector gần nhất từ cơ sở dữ liệu. Trong hệ thống đề xuất hoặc công cụ tìm kiếm, bạn có thể tìm thấy các sản phẩm tương tự từ sản phẩm bạn đã tìm kiếm. Trong LLM và các ứng dụng AI khác, mỗi điểm dữ liệu có thể được trình bày bằng các embedding được tạo từ một số mô hình, nó trả về các tính năng phù hợp nhất.
Một tìm kiếm trong không gian vectơ chiều cao, là để tìm K-Láng giềng gần nhất (KNN) của vectơ truy vấn.
Độ đo Trong LanceDB, Độ đo (Metric) là cách để mô tả khoảng cách giữa một cặp vectơ. Hiện tại, nó hỗ trợ các độ đo sau:
- L2
- Cosine
- Tìm kiếm tương đồng của Dot Explorer sử dụng L2 theo mặc định. Bạn có thể chạy truy vấn trực tiếp trên các bảng hoặc sử dụng định dạng lance để xây dựng các tiện ích tùy chỉnh để quản lý bộ dữ liệu. Xem thêm chi tiết về các thao tác bảng LanceDB có sẵn trong tài liệu.
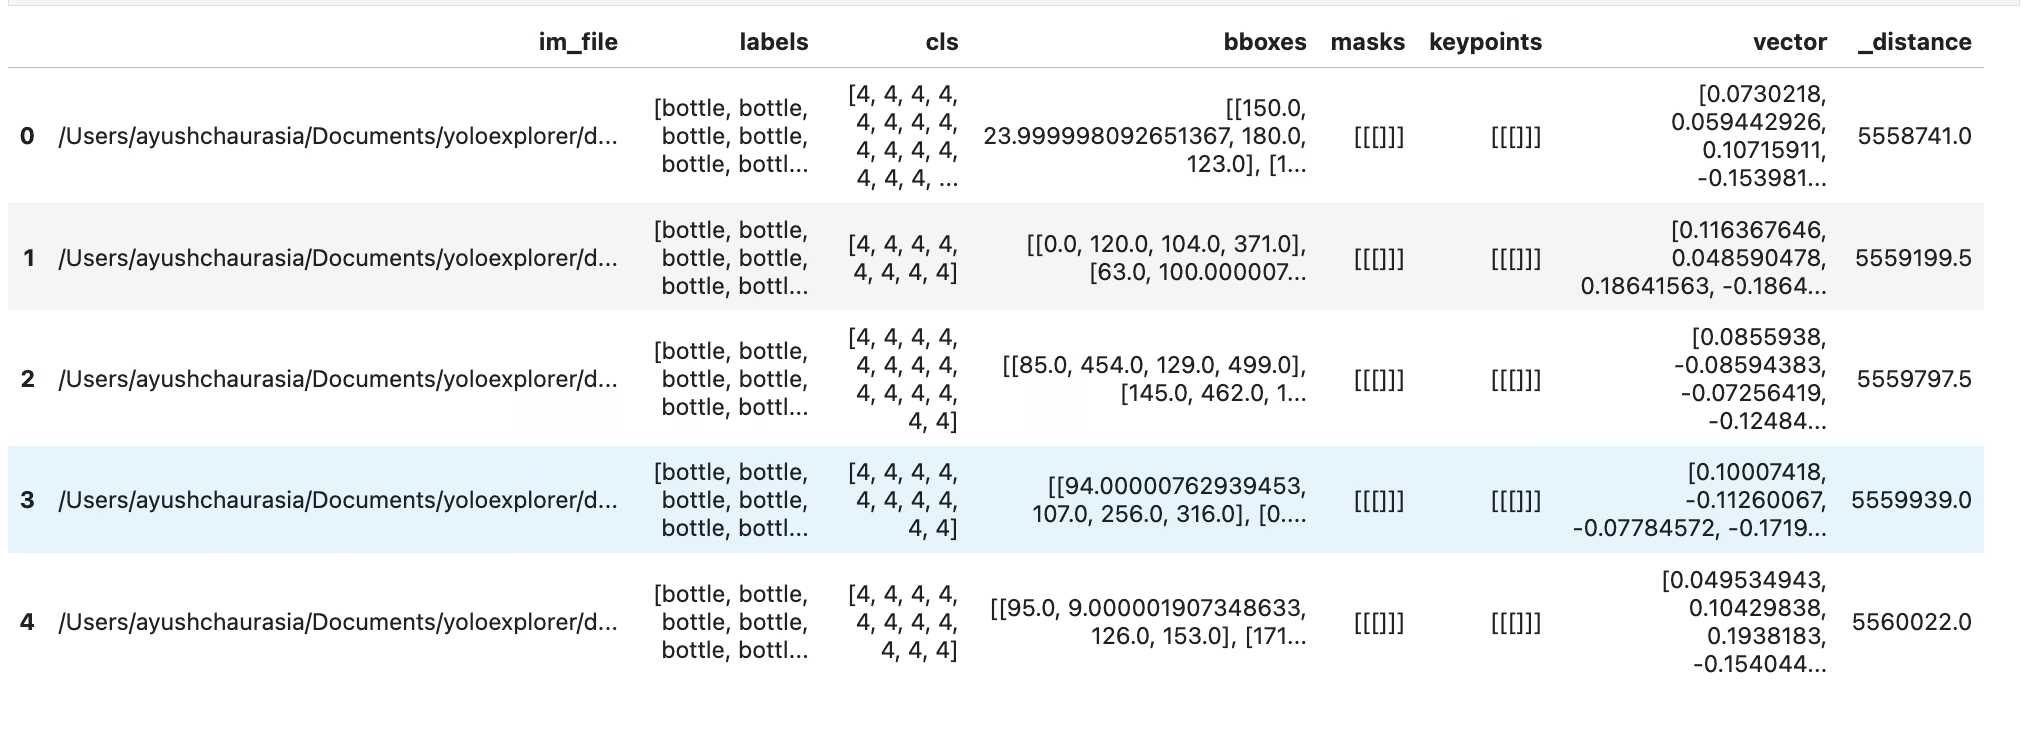
dummy_img_embedding = [i for i in range(256)]
table.search(dummy_img_embedding).limit(5).to_pandas()
Chuyển đổi qua lại giữa các định dạng dữ liệu phổ biến
df = table.to_pandas()
pa_table = table.to_arrow()
Làm việc với Embeddings
Bạn có thể truy cập nhúng thô từ bảng lancedb và phân tích nó. Các nhúng hình ảnh được lưu trữ trong cột vector
import numpy as np

embeddings = table.to_pandas()["vector"].tolist()
embeddings = np.array(embeddings)
Biểu đồ phân tán
Một trong những bước sơ bộ trong phân tích embedding là vẽ biểu đồ chúng trong không gian 2D thông qua giảm chiều. Hãy thử một ví dụ
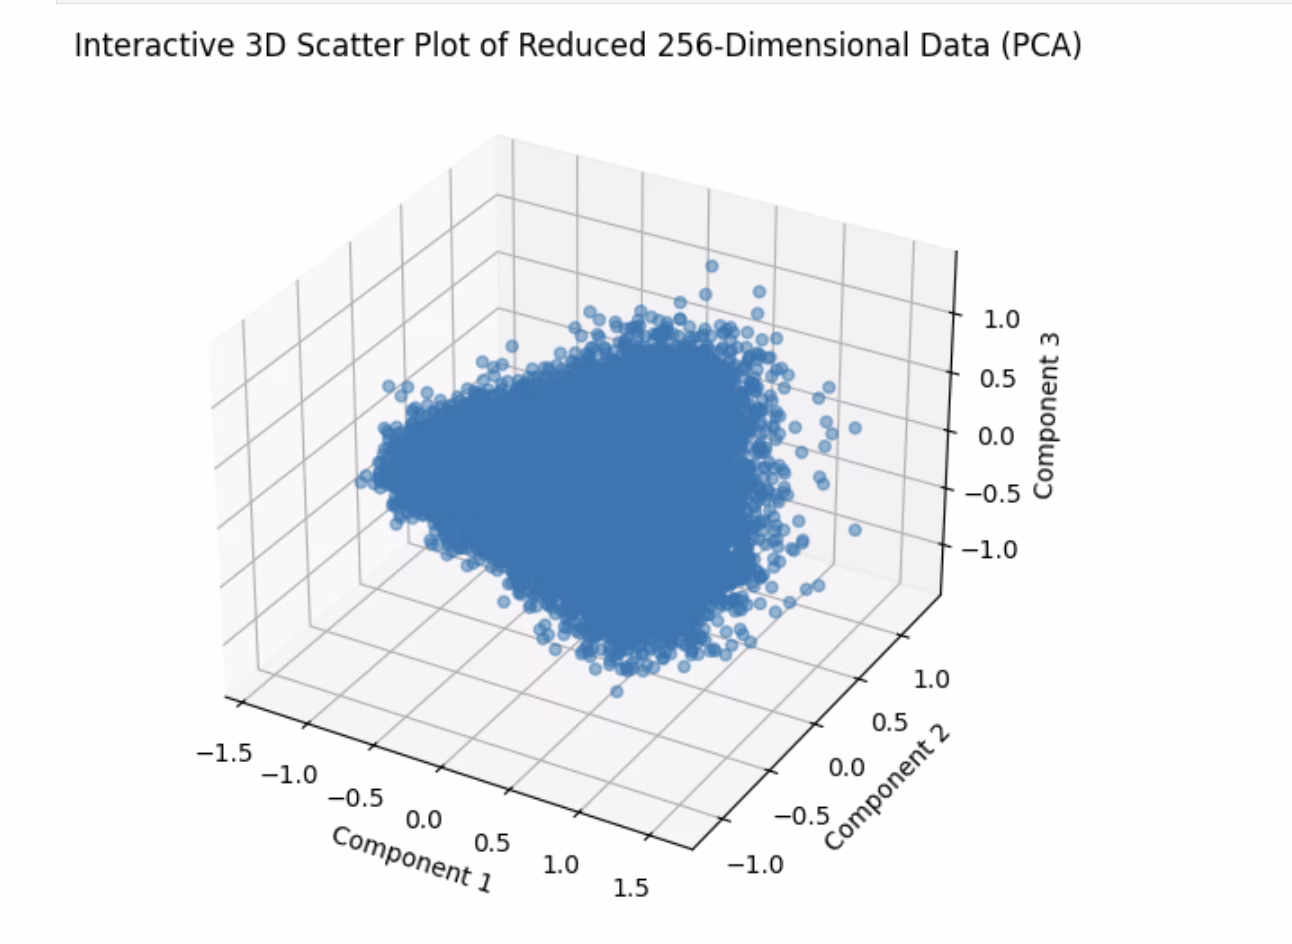
import matplotlib.pyplot as plt
from sklearn.decomposition import PCA  # pip install scikit-learn

# Reduce dimensions using PCA to 3 components for visualization in 3D
pca = PCA(n_components=3)
reduced_data = pca.fit_transform(embeddings)

# Create a 3D scatter plot using Matplotlib's Axes3D
fig = plt.figure(figsize=(8, 6))
ax = fig.add_subplot(111, projection="3d")

# Scatter plot
ax.scatter(reduced_data[:, 0], reduced_data[:, 1], reduced_data[:, 2], alpha=0.5)
ax.set_title("3D Scatter Plot of Reduced 256-Dimensional Data (PCA)")
ax.set_xlabel("Component 1")
ax.set_ylabel("Component 2")
ax.set_zlabel("Component 3")

plt.show()
Chỉ số tương đồng
Đây là một ví dụ đơn giản về một hoạt động được hỗ trợ bởi bảng nhúng. Explorer đi kèm với một similarity_index operation-
- Nó cố gắng ước tính mức độ tương đồng của mỗi điểm dữ liệu với phần còn lại của tập dữ liệu.
- Nó thực hiện điều đó bằng cách đếm số lượng embedding ảnh nằm gần hơn max_dist đến ảnh hiện tại trong không gian embedding được tạo, xem xét top_k ảnh tương tự tại một thời điểm.
Đối với một bộ dữ liệu, mô hình nhất định, max_dist & top_k chỉ số tương đồng sau khi được tạo sẽ được sử dụng lại. Trong trường hợp tập dữ liệu của bạn đã thay đổi hoặc bạn chỉ cần tạo lại chỉ số tương đồng, bạn có thể chuyển force=True. Tương tự như tìm kiếm vector và SQL, điều này cũng đi kèm với một tiện ích để trực tiếp vẽ biểu đồ.
sim_idx = exp.similarity_index(max_dist=0.2, top_k=0.01)
exp.plot_similarity_index(max_dist=0.2, top_k=0.01)
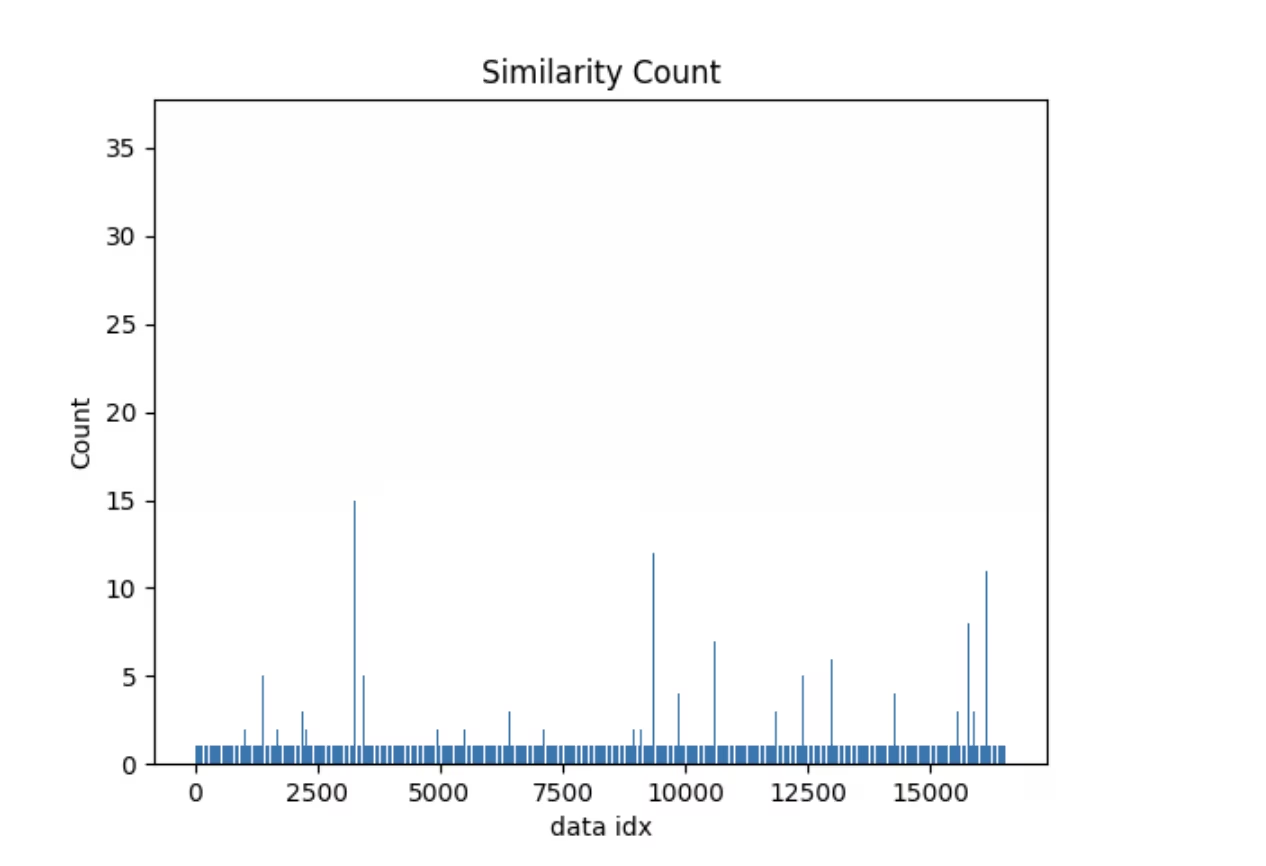
Trước tiên, hãy xem cốt truyện.
exp.plot_similarity_index(max_dist=0.2, top_k=0.01)
Bây giờ hãy xem xét đầu ra của hoạt động
sim_idx = exp.similarity_index(max_dist=0.2, top_k=0.01, force=False)

sim_idx
Hãy tạo một truy vấn để xem những điểm dữ liệu nào có số lượng tương đồng lớn hơn 30 và vẽ đồ thị các hình ảnh tương tự với chúng.
import numpy as np

sim_count = np.array(sim_idx["count"])
sim_idx["im_file"][sim_count > 30]
Bạn sẽ thấy một cái gì đó như thế này
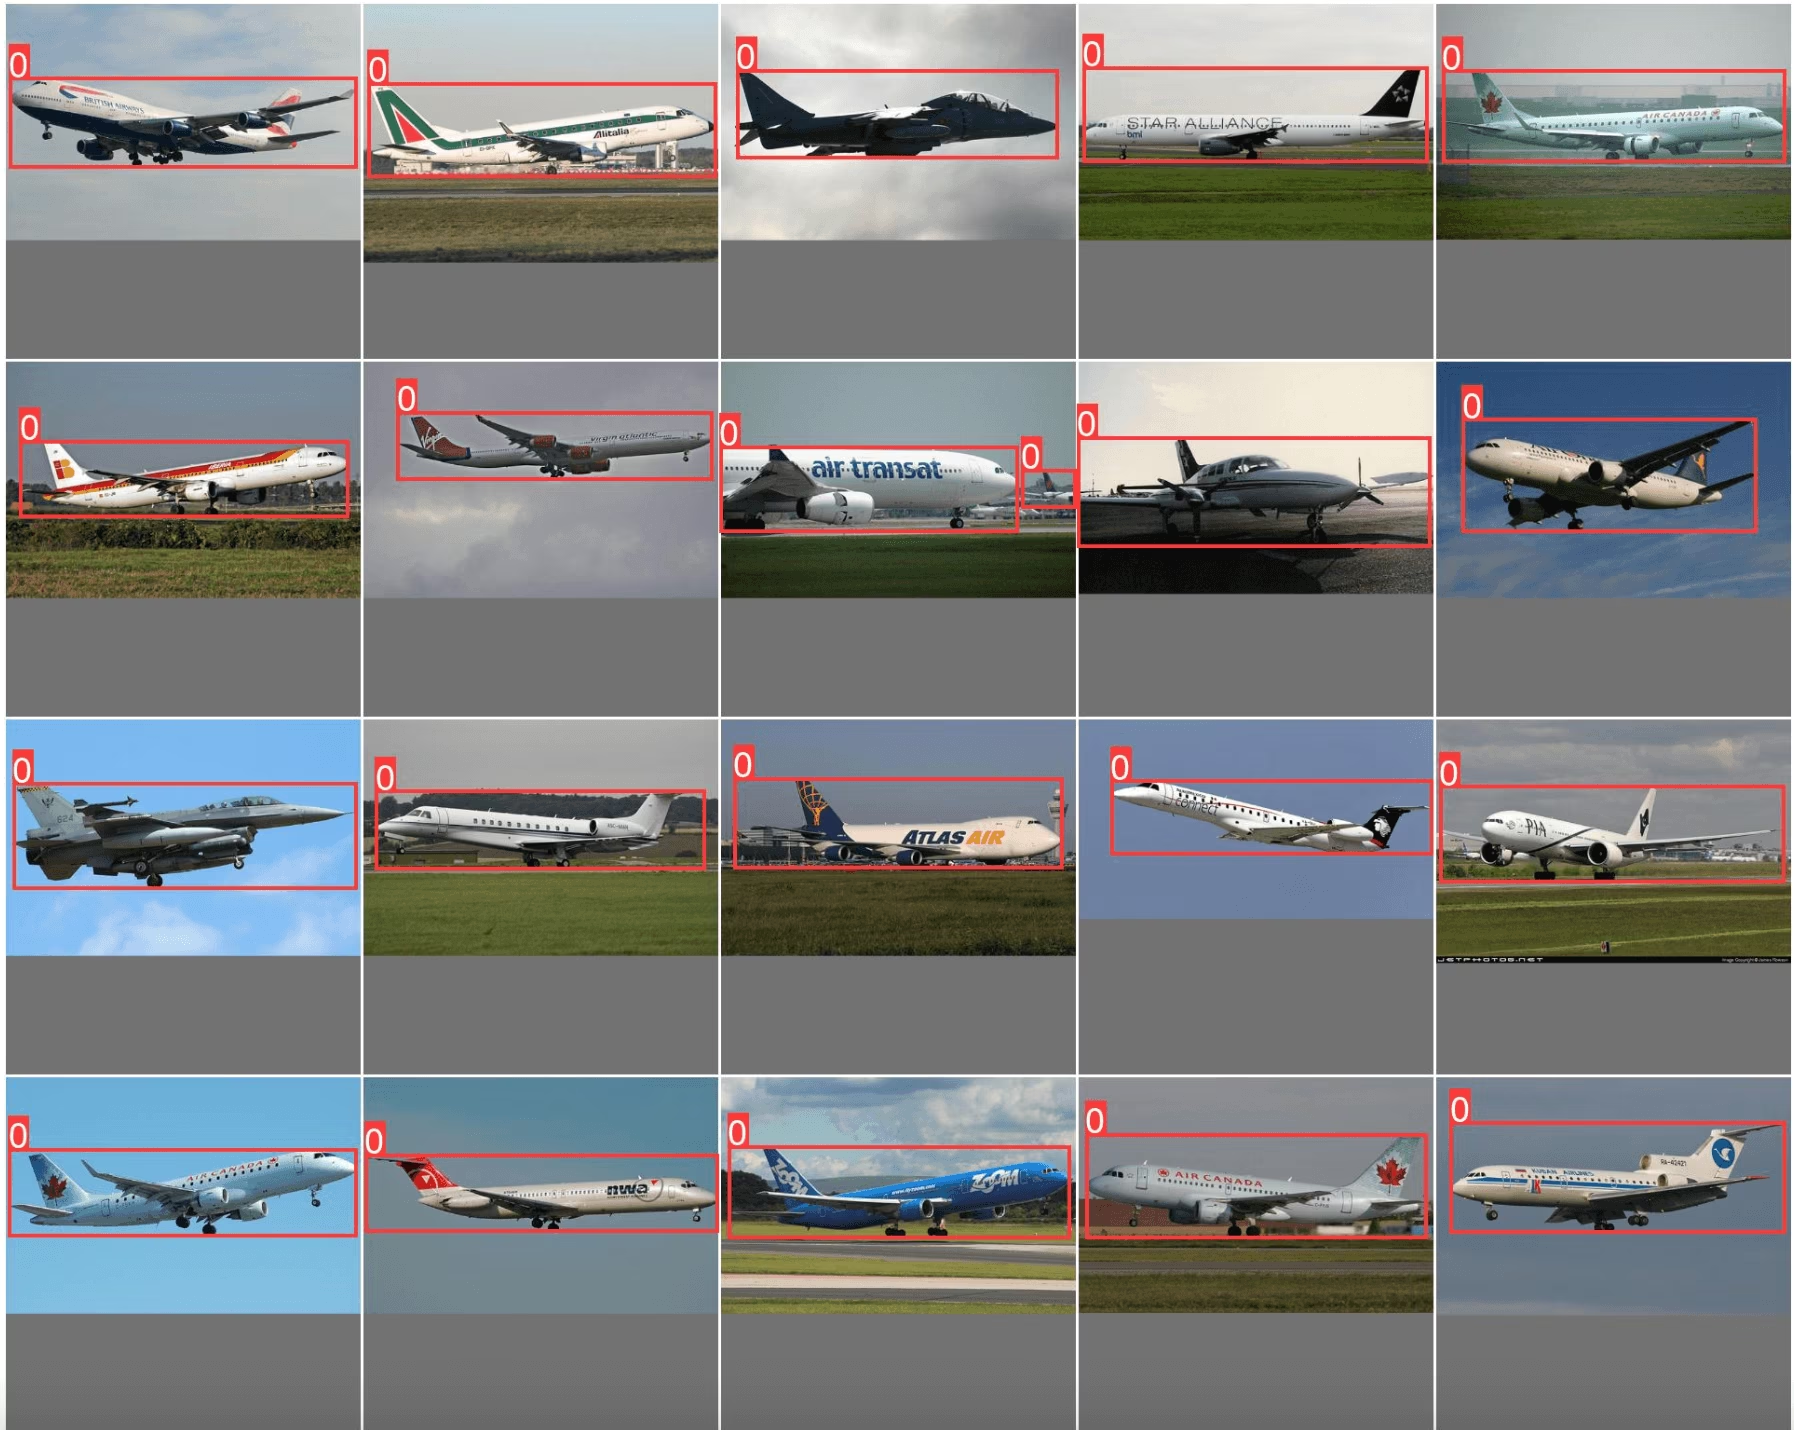
exp.plot_similar(idx=[7146, 14035]) # Using avg embeddings of 2 images


