Analytics mit Ultralytics YOLO26
Einführung
Dieser Leitfaden bietet einen umfassenden Überblick über drei grundlegende Arten von Datenvisualisierungen: Liniendiagramme, Balkendiagramme und Kreisdiagramme. Jeder Abschnitt enthält Schritt-für-Schritt-Anleitungen und Code-Snippets zur Erstellung dieser Visualisierungen mit Python.
Ansehen: Wie man mit Ultralytics analytische Diagramme erstellt | Liniendiagramme, Balkendiagramme, Flächen- und Kreisdiagramme
Visuelle Beispiele
| Liniendiagramm | Balkendiagramm | Kreisdiagramm |
|---|---|---|
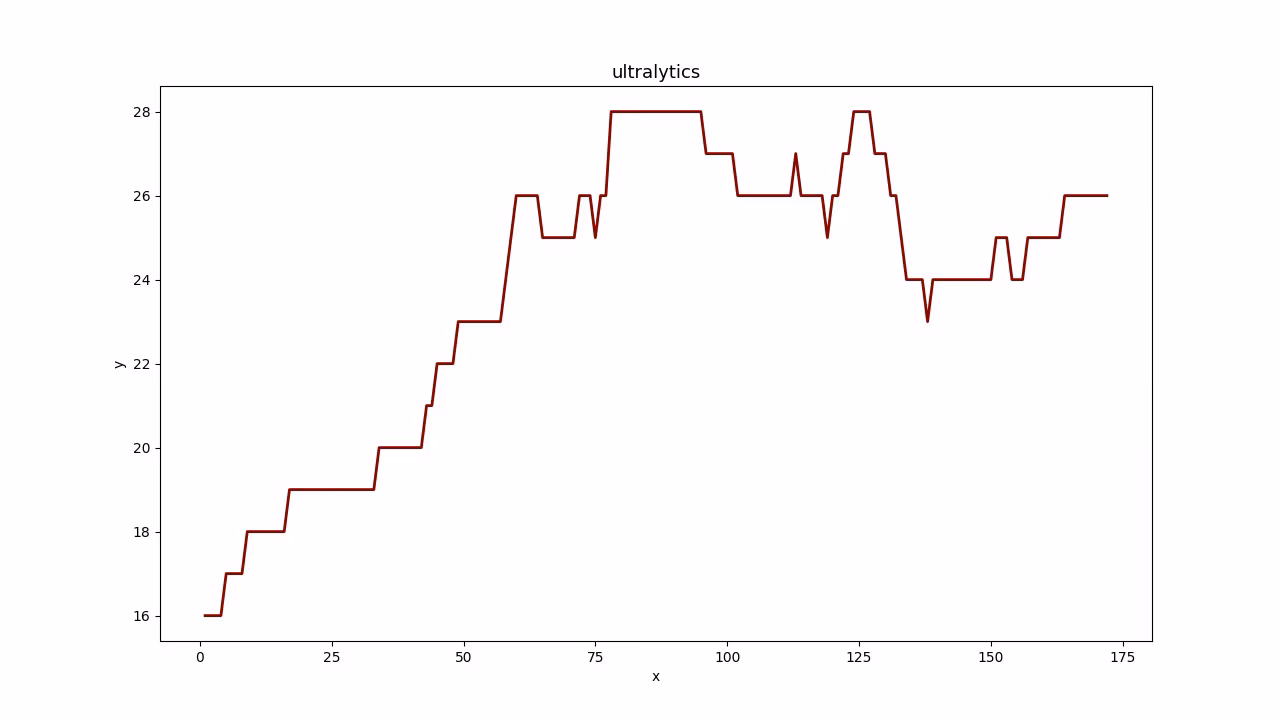 | 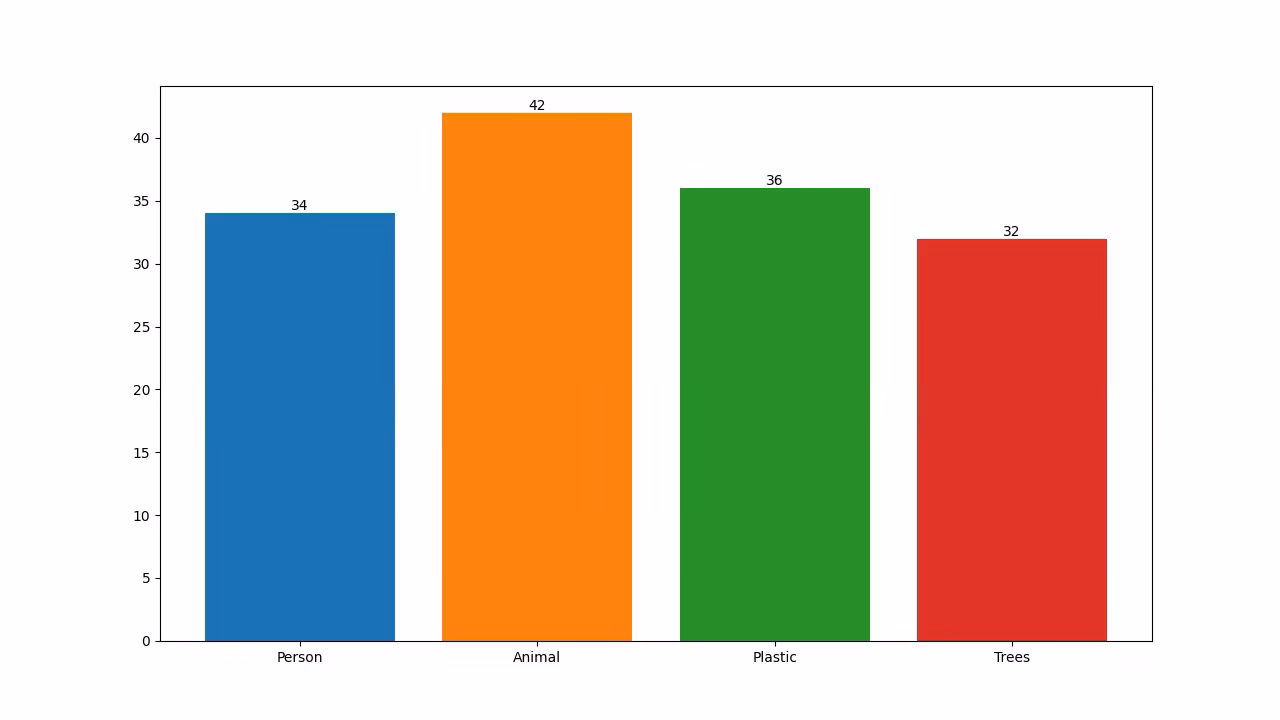 | 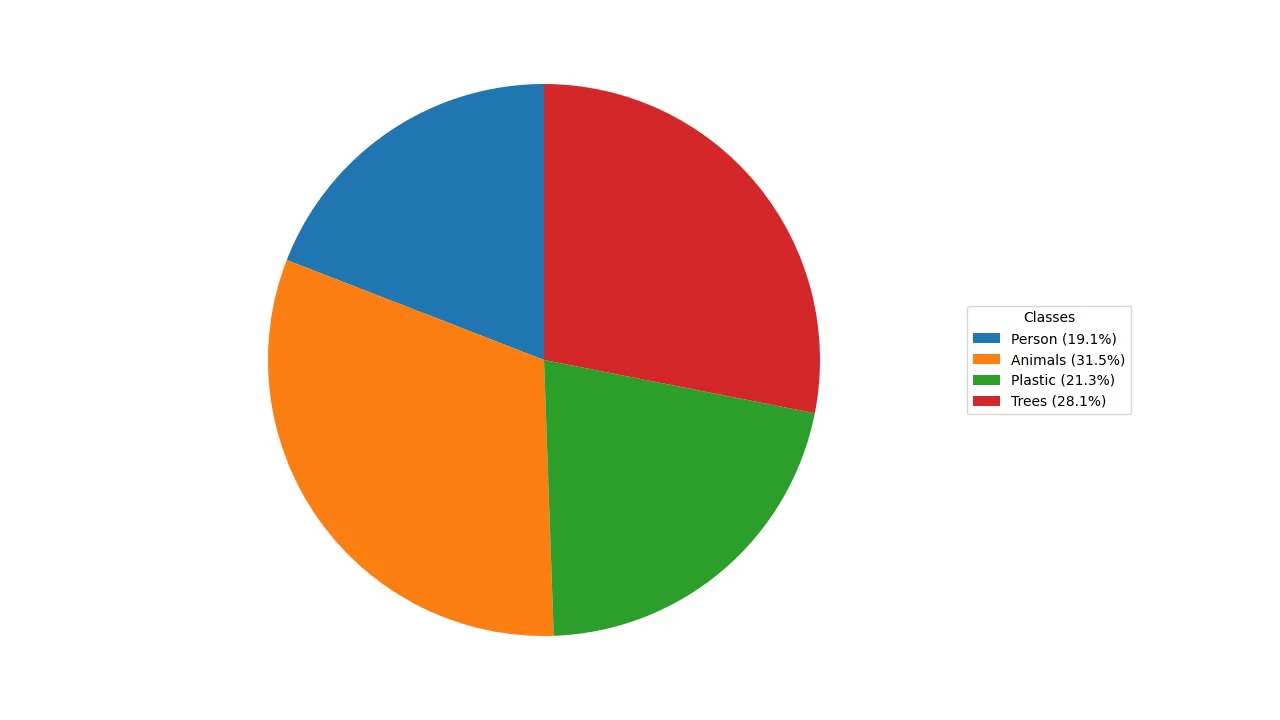 |
Warum Graphen wichtig sind
- Liniendiagramme eignen sich ideal, um Veränderungen über kurze und lange Zeiträume zu verfolgen und um Veränderungen für mehrere Gruppen über den gleichen Zeitraum zu vergleichen.
- Balkendiagramme hingegen eignen sich, um Mengen über verschiedene Kategorien hinweg zu vergleichen und Beziehungen zwischen einer Kategorie und ihrem numerischen Wert darzustellen.
- Schließlich eignen sich Kreisdiagramme gut, um Proportionen zwischen Kategorien zu veranschaulichen und Teile eines Ganzen darzustellen.
Analysen mit Ultralytics YOLO
yolo solutions analytics show=True

# Pass the source
yolo solutions analytics source="path/to/video.mp4"

# Generate the pie chart
yolo solutions analytics analytics_type="pie" show=True

# Generate the bar plots
yolo solutions analytics analytics_type="bar" show=True

# Generate the area plots
yolo solutions analytics analytics_type="area" show=True
import cv2

from ultralytics import solutions

cap = cv2.VideoCapture("path/to/video.mp4")
assert cap.isOpened(), "Error reading video file"

# Video writer
w, h, fps = (int(cap.get(x)) for x in (cv2.CAP_PROP_FRAME_WIDTH, cv2.CAP_PROP_FRAME_HEIGHT, cv2.CAP_PROP_FPS))
out = cv2.VideoWriter(
    "analytics_output.avi",
    cv2.VideoWriter_fourcc(*"MJPG"),
    fps,
    (1280, 720),  # this is fixed
)

# Initialize analytics object
analytics = solutions.Analytics(
    show=True,  # display the output
    analytics_type="line",  # pass the analytics type, could be "pie", "bar" or "area".
    model="yolo26n.pt",  # path to the YOLO26 model file
    # classes=[0, 2],  # display analytics for specific detection classes
)

# Process video
frame_count = 0
while cap.isOpened():
    success, im0 = cap.read()
    if success:
        frame_count += 1
        results = analytics(im0, frame_count)  # update analytics graph every frame

        # print(results)  # access the output

        out.write(results.plot_im)  # write the video file
    else:
        break

cap.release()
out.release()
cv2.destroyAllWindows()  # destroy all opened windows
Analytics Argumente
Hier ist eine Tabelle mit den Analytics-Argumenten:
| Argument | Typ | Standard | Beschreibung |
|---|---|---|---|
model | str | None | Pfad zu einer Ultralytics YOLO Modelldatei. |
analytics_type | str | 'line' | Art des Graphen, d.h. line, bar, area, oder pie. |
Sie können auch verschiedene nutzen track Argumente in der Analytics Lösung.
| Argument | Typ | Standard | Beschreibung |
|---|---|---|---|
tracker | str | 'botsort.yaml' | Gibt den zu verwendenden Tracking-Algorithmus an, z. B. bytetrack.yaml oder botsort.yaml. |
conf | float | 0.1 | Legt den Konfidenzschwellenwert für Erkennungen fest; niedrigere Werte ermöglichen die Verfolgung von mehr Objekten, können aber auch falsch positive Ergebnisse liefern. |
iou | float | 0.7 | Legt den Intersection over Union (IoU)-Schwellenwert für das Filtern überlappender Detektionen fest. |
classes | list | None | Filtert Ergebnisse nach Klassenindex. Zum Beispiel, classes=[0, 2, 3] verfolgt nur die angegebenen Klassen. |
verbose | bool | True | Steuert die Anzeige der Tracking-Ergebnisse und bietet eine visuelle Ausgabe der verfolgten Objekte. |
device | str | None | Gibt das Gerät für die Inferenz an (z. B. cpu, cuda:0 oder 0). Ermöglicht es Benutzern, zwischen CPU, einer bestimmten GPU oder anderen Rechengeräten für die Modellausführung zu wählen. |
Zusätzlich werden die folgenden Visualisierungsargumente unterstützt:
| Argument | Typ | Standard | Beschreibung |
|---|---|---|---|
show | bool | False | Wenn Trueaktiviert, werden die annotierten Bilder oder Videos in einem Fenster angezeigt. Nützlich für sofortiges visuelles Feedback während der Entwicklung oder des Testens. |
line_width | int or None | None | Gibt die Linienbreite der Begrenzungsrahmen an. Wenn None, wird die Linienbreite automatisch an die Bildgröße angepasst. Bietet eine visuelle Anpassung für mehr Klarheit. |
Fazit
Das Verständnis, wann und wie verschiedene Arten von Visualisierungen eingesetzt werden, ist entscheidend für eine effektive Datenanalyse. Liniendiagramme, Balkendiagramme und Kreisdiagramme sind grundlegende Werkzeuge, die Ihnen helfen können, die Geschichte Ihrer Daten klarer und effektiver zu vermitteln. Die Ultralytics YOLO26 Analytics-Lösung bietet eine optimierte Möglichkeit, diese Visualisierungen aus Ihren Objekterkennungs- und Tracking-Ergebnissen zu generieren, wodurch es einfacher wird, aussagekräftige Erkenntnisse aus Ihren visuellen Daten zu gewinnen.
FAQ
Wie erstelle ich ein Liniendiagramm mit Ultralytics YOLO26 Analytics?
Um ein Liniendiagramm mit Ultralytics YOLO26 Analytics zu erstellen, gehen Sie wie folgt vor:
- Laden Sie ein YOLO26-Modell und öffnen Sie Ihre Videodatei.
- Initialisieren Sie die
AnalyticsKlasse, bei der der Typ auf "line" gesetzt ist. - Iterieren Sie durch Videoframes und aktualisieren Sie das Liniendiagramm mit relevanten Daten, wie z. B. Objektanzahl pro Frame.
- Speichern Sie das Ausgabevideo, das den Liniengraphen anzeigt.
Beispiel:
import cv2

from ultralytics import solutions

cap = cv2.VideoCapture("path/to/video.mp4")
assert cap.isOpened(), "Error reading video file"

w, h, fps = (int(cap.get(x)) for x in (cv2.CAP_PROP_FRAME_WIDTH, cv2.CAP_PROP_FRAME_HEIGHT, cv2.CAP_PROP_FPS))

out = cv2.VideoWriter(
    "ultralytics_analytics.avi",
    cv2.VideoWriter_fourcc(*"MJPG"),
    fps,
    (1280, 720),  # this is fixed
)

analytics = solutions.Analytics(
    analytics_type="line",
    show=True,
)

frame_count = 0
while cap.isOpened():
    success, im0 = cap.read()
    if success:
        frame_count += 1
        results = analytics(im0, frame_count)  # update analytics graph every frame
        out.write(results.plot_im)  # write the video file
    else:
        break

cap.release()
out.release()
cv2.destroyAllWindows()
Weitere Informationen zur Konfiguration des Analytics Klasse finden Sie unter Analytics mit Ultralytics YOLO26 Abschnitt.
Welche Vorteile bietet die Verwendung von Ultralytics YOLO26 zur Erstellung von Balkendiagrammen?
Die Verwendung von Ultralytics YOLO26 zur Erstellung von Balkendiagrammen bietet mehrere Vorteile:
- Echtzeit-Datenvisualisierung: Integrieren Sie Objekterkennungsergebnisse nahtlos in Balkendiagramme für dynamische Aktualisierungen.
- Einfache Bedienung: Einfache API und Funktionen ermöglichen eine unkomplizierte Implementierung und Visualisierung von Daten.
- Anpassung: Passen Sie Titel, Beschriftungen, Farben und mehr an Ihre spezifischen Anforderungen an.
- Effizienz: Verarbeitet effizient große Datenmengen und aktualisiert Diagramme in Echtzeit während der Videoverarbeitung.
Verwenden Sie das folgende Beispiel, um ein Balkendiagramm zu erstellen:
import cv2

from ultralytics import solutions

cap = cv2.VideoCapture("path/to/video.mp4")
assert cap.isOpened(), "Error reading video file"

w, h, fps = (int(cap.get(x)) for x in (cv2.CAP_PROP_FRAME_WIDTH, cv2.CAP_PROP_FRAME_HEIGHT, cv2.CAP_PROP_FPS))

out = cv2.VideoWriter(
    "ultralytics_analytics.avi",
    cv2.VideoWriter_fourcc(*"MJPG"),
    fps,
    (1280, 720),  # this is fixed
)

analytics = solutions.Analytics(
    analytics_type="bar",
    show=True,
)

frame_count = 0
while cap.isOpened():
    success, im0 = cap.read()
    if success:
        frame_count += 1
        results = analytics(im0, frame_count)  # update analytics graph every frame
        out.write(results.plot_im)  # write the video file
    else:
        break

cap.release()
out.release()
cv2.destroyAllWindows()
Weitere Informationen findest du im Abschnitt Balkendiagramm im Leitfaden.
Warum sollte ich Ultralytics YOLO26 für die Erstellung von Kreisdiagrammen in meinen Datenvisualisierungsprojekten verwenden?
Ultralytics YOLO26 ist eine ausgezeichnete Wahl für die Erstellung von Kreisdiagrammen, weil:
- Integration mit Objekterkennung: Integrieren Sie Objekterkennungsergebnisse direkt in Kreisdiagramme, um sofortige Einblicke zu erhalten.
- Benutzerfreundliche API: Einfach einzurichten und mit minimalem Code zu verwenden.
- Anpassbar: Verschiedene Anpassungsoptionen für Farben, Beschriftungen und mehr.
- Echtzeit-Aktualisierungen: Verarbeiten und visualisieren Sie Daten in Echtzeit, was ideal für Videoanalyseprojekte ist.
Hier ist ein kurzes Beispiel:
import cv2

from ultralytics import solutions

cap = cv2.VideoCapture("path/to/video.mp4")
assert cap.isOpened(), "Error reading video file"

w, h, fps = (int(cap.get(x)) for x in (cv2.CAP_PROP_FRAME_WIDTH, cv2.CAP_PROP_FRAME_HEIGHT, cv2.CAP_PROP_FPS))

out = cv2.VideoWriter(
    "ultralytics_analytics.avi",
    cv2.VideoWriter_fourcc(*"MJPG"),
    fps,
    (1280, 720),  # this is fixed
)

analytics = solutions.Analytics(
    analytics_type="pie",
    show=True,
)

frame_count = 0
while cap.isOpened():
    success, im0 = cap.read()
    if success:
        frame_count += 1
        results = analytics(im0, frame_count)  # update analytics graph every frame
        out.write(results.plot_im)  # write the video file
    else:
        break

cap.release()
out.release()
cv2.destroyAllWindows()
Weitere Informationen finden Sie im Abschnitt Kreisdiagramm im Leitfaden.
Kann Ultralytics YOLO26 verwendet werden, um Objekte zu tracken und Visualisierungen dynamisch zu aktualisieren?
Ja, Ultralytics YOLO26 kann verwendet werden, um Objekte zu tracken und Visualisierungen dynamisch zu aktualisieren. Es unterstützt das Echtzeit-Tracking mehrerer Objekte und kann verschiedene Visualisierungen wie Liniendiagramme, Balkendiagramme und Kreisdiagramme basierend auf den Daten der getrackten Objekte aktualisieren.
Beispiel für das Verfolgen und Aktualisieren eines Liniendiagramms:
import cv2

from ultralytics import solutions

cap = cv2.VideoCapture("path/to/video.mp4")
assert cap.isOpened(), "Error reading video file"

w, h, fps = (int(cap.get(x)) for x in (cv2.CAP_PROP_FRAME_WIDTH, cv2.CAP_PROP_FRAME_HEIGHT, cv2.CAP_PROP_FPS))

out = cv2.VideoWriter(
    "ultralytics_analytics.avi",
    cv2.VideoWriter_fourcc(*"MJPG"),
    fps,
    (1280, 720),  # this is fixed
)

analytics = solutions.Analytics(
    analytics_type="line",
    show=True,
)

frame_count = 0
while cap.isOpened():
    success, im0 = cap.read()
    if success:
        frame_count += 1
        results = analytics(im0, frame_count)  # update analytics graph every frame
        out.write(results.plot_im)  # write the video file
    else:
        break

cap.release()
out.release()
cv2.destroyAllWindows()
Um mehr über die vollständige Funktionalität zu erfahren, lies bitte den Abschnitt Tracking.
Was unterscheidet Ultralytics YOLO26 von anderen Objekterkennungslösungen wie OpenCV und TensorFlow?
Ultralytics YOLO26 hebt sich aus mehreren Gründen von anderen Objekterkennungslösungen wie OpenCV und TensorFlow ab:
- Spitzenmäßige Genauigkeit: YOLO26 bietet überragende Genauigkeit bei Objekterkennungs-, Segmentierungs- und Klassifizierungsaufgaben.
- Einfache Bedienung: Die benutzerfreundliche API ermöglicht eine schnelle Implementierung und Integration ohne umfangreiche Programmierung.
- Echtzeit-Performance: Optimiert für High-Speed-Inferenz, geeignet für Echtzeit-Anwendungen.
- Vielfältige Anwendungen: Unterstützt verschiedene Aufgaben, einschließlich Multi-Objekt-Tracking, benutzerdefiniertem Modelltraining und Export in verschiedene Formate wie ONNX, TensorRT und CoreML.
- Umfassende Dokumentation: Ausführliche Dokumentation und Blog-Ressourcen, die Benutzer durch jeden Schritt führen.
Für detailliertere Vergleiche und Anwendungsfälle erkunden Sie unseren Ultralytics Blog.


