Analytics using Ultralytics YOLO26
Introduction
This guide provides a comprehensive overview of three fundamental types of data visualizations: line graphs, bar plots, and pie charts. Each section includes step-by-step instructions and code snippets on how to create these visualizations using Python.
Watch: How to generate Analytical Graphs using Ultralytics | Line Graphs, Bar Plots, Area and Pie Charts
Visual Samples
| Line Graph | Bar Plot | Pie Chart |
|---|---|---|
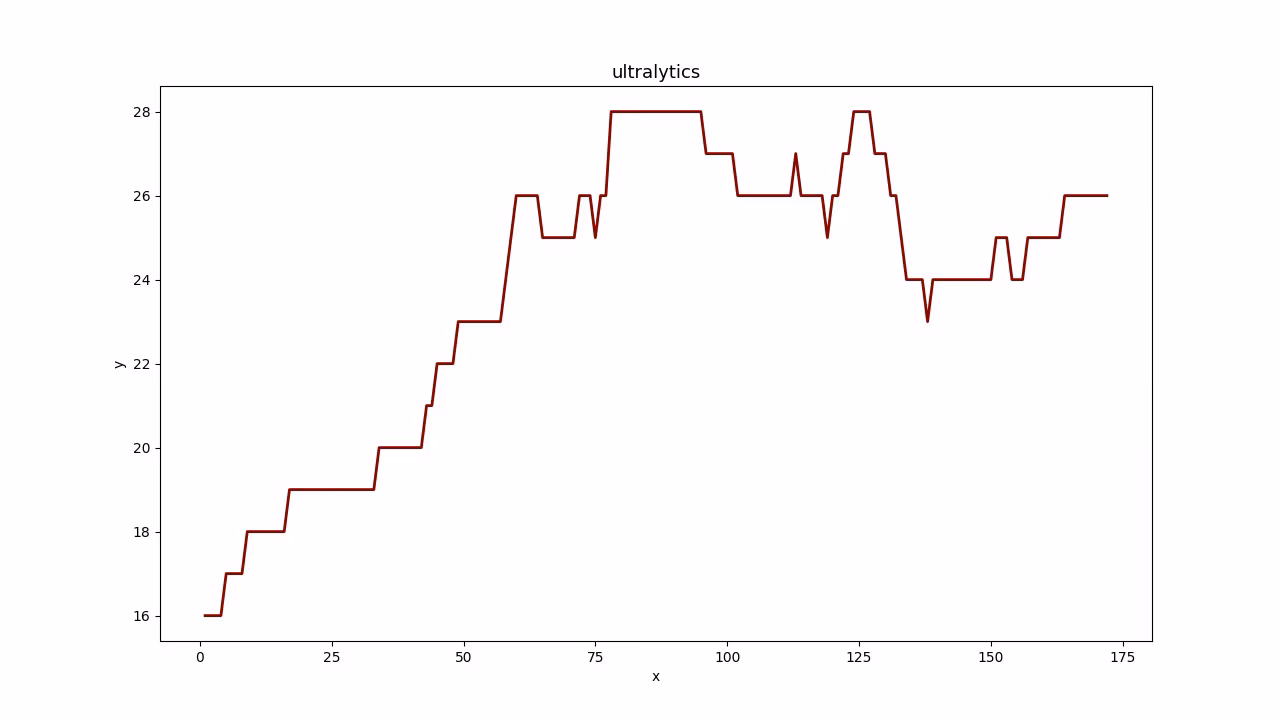 | 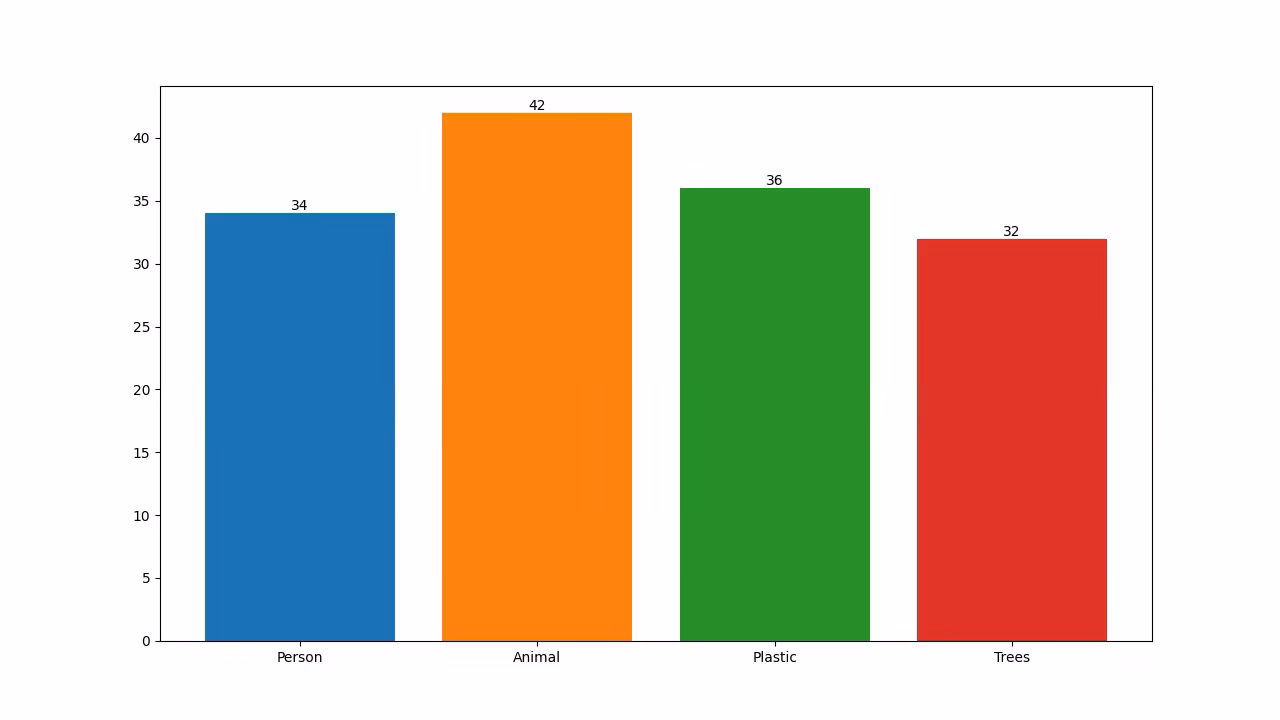 | 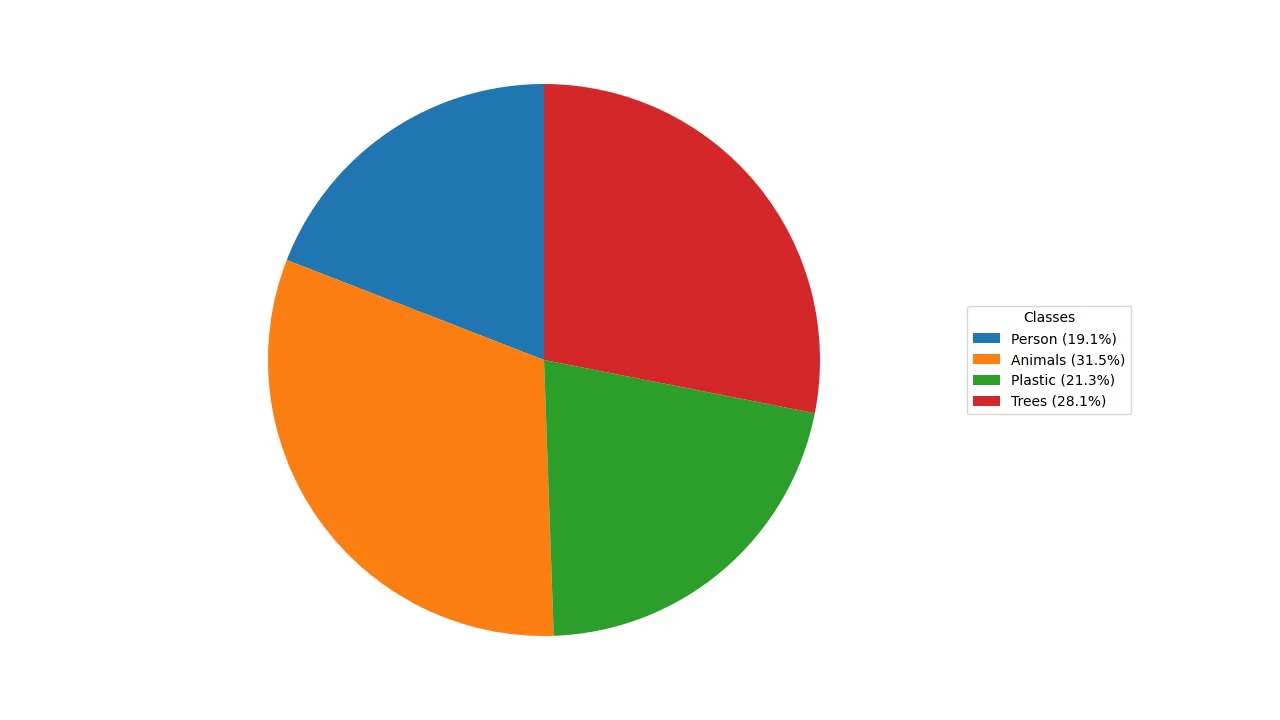 |
Why Graphs are Important
- Line graphs are ideal for tracking changes over short and long periods and for comparing changes for multiple groups over the same period.
- Bar plots, on the other hand, are suitable for comparing quantities across different categories and showing relationships between a category and its numerical value.
- Lastly, pie charts are effective for illustrating proportions among categories and showing parts of a whole.
Analytics using Ultralytics YOLO
yolo solutions analytics show=True

# Pass the source
yolo solutions analytics source="path/to/video.mp4"

# Generate the pie chart
yolo solutions analytics analytics_type="pie" show=True

# Generate the bar plots
yolo solutions analytics analytics_type="bar" show=True

# Generate the area plots
yolo solutions analytics analytics_type="area" show=True
import cv2

from ultralytics import solutions

cap = cv2.VideoCapture("path/to/video.mp4")
assert cap.isOpened(), "Error reading video file"

# Video writer
w, h, fps = (int(cap.get(x)) for x in (cv2.CAP_PROP_FRAME_WIDTH, cv2.CAP_PROP_FRAME_HEIGHT, cv2.CAP_PROP_FPS))
out = cv2.VideoWriter(
    "analytics_output.avi",
    cv2.VideoWriter_fourcc(*"MJPG"),
    fps,
    (1280, 720),  # this is fixed
)

# Initialize analytics object
analytics = solutions.Analytics(
    show=True,  # display the output
    analytics_type="line",  # pass the analytics type, could be "pie", "bar" or "area".
    model="yolo26n.pt",  # path to the YOLO26 model file
    # classes=[0, 2],  # display analytics for specific detection classes
)

# Process video
frame_count = 0
while cap.isOpened():
    success, im0 = cap.read()
    if success:
        frame_count += 1
        results = analytics(im0, frame_count)  # update analytics graph every frame

        # print(results)  # access the output

        out.write(results.plot_im)  # write the video file
    else:
        break

cap.release()
out.release()
cv2.destroyAllWindows()  # destroy all opened windows
Analytics Arguments
Here's a table outlining the Analytics arguments:
| Argument | Type | Default | Description |
|---|---|---|---|
model | str | None | Path to an Ultralytics YOLO model file. |
analytics_type | str | 'line' | Type of graph, i.e., line, bar, area, or pie. |
You can also leverage different track arguments in the Analytics solution.
| Argument | Type | Default | Description |
|---|---|---|---|
tracker | str | 'botsort.yaml' | Specifies the tracking algorithm to use, e.g., bytetrack.yaml or botsort.yaml. |
conf | float | 0.1 | Sets the confidence threshold for detections; lower values allow more objects to be tracked but may include false positives. |
iou | float | 0.7 | Sets the Intersection over Union (IoU) threshold for filtering overlapping detections. |
classes | list | None | Filters results by class index. For example, classes=[0, 2, 3] only tracks the specified classes. |
verbose | bool | True | Controls the display of tracking results, providing a visual output of tracked objects. |
device | str | None | Specifies the device for inference (e.g., cpu, cuda:0 or 0). Allows users to select between CPU, a specific GPU, or other compute devices for model execution. |
Additionally, the following visualization arguments are supported:
| Argument | Type | Default | Description |
|---|---|---|---|
show | bool | False | If True, displays the annotated images or videos in a window. Useful for immediate visual feedback during development or testing. |
line_width | int or None | None | Specifies the line width of bounding boxes. If None, the line width is automatically adjusted based on the image size. Provides visual customization for clarity. |
Conclusion
Understanding when and how to use different types of visualizations is crucial for effective data analysis. Line graphs, bar plots, and pie charts are fundamental tools that can help you convey your data's story more clearly and effectively. The Ultralytics YOLO26 Analytics solution provides a streamlined way to generate these visualizations from your object detection and tracking results, making it easier to extract meaningful insights from your visual data.
FAQ
How do I create a line graph using Ultralytics YOLO26 Analytics?
To create a line graph using Ultralytics YOLO26 Analytics, follow these steps:
- Load a YOLO26 model and open your video file.
- Initialize the
Analyticsclass with the type set to "line." - Iterate through video frames, updating the line graph with relevant data, such as object counts per frame.
- Save the output video displaying the line graph.
Example:
import cv2

from ultralytics import solutions

cap = cv2.VideoCapture("path/to/video.mp4")
assert cap.isOpened(), "Error reading video file"

w, h, fps = (int(cap.get(x)) for x in (cv2.CAP_PROP_FRAME_WIDTH, cv2.CAP_PROP_FRAME_HEIGHT, cv2.CAP_PROP_FPS))

out = cv2.VideoWriter(
    "ultralytics_analytics.avi",
    cv2.VideoWriter_fourcc(*"MJPG"),
    fps,
    (1280, 720),  # this is fixed
)

analytics = solutions.Analytics(
    analytics_type="line",
    show=True,
)

frame_count = 0
while cap.isOpened():
    success, im0 = cap.read()
    if success:
        frame_count += 1
        results = analytics(im0, frame_count)  # update analytics graph every frame
        out.write(results.plot_im)  # write the video file
    else:
        break

cap.release()
out.release()
cv2.destroyAllWindows()
For further details on configuring the Analytics class, visit the Analytics using Ultralytics YOLO26 section.
What are the benefits of using Ultralytics YOLO26 for creating bar plots?
Using Ultralytics YOLO26 for creating bar plots offers several benefits:
- Real-time Data Visualization: Seamlessly integrate object detection results into bar plots for dynamic updates.
- Ease of Use: Simple API and functions make it straightforward to implement and visualize data.
- Customization: Customize titles, labels, colors, and more to fit your specific requirements.
- Efficiency: Efficiently handle large amounts of data and update plots in real-time during video processing.
Use the following example to generate a bar plot:
import cv2

from ultralytics import solutions

cap = cv2.VideoCapture("path/to/video.mp4")
assert cap.isOpened(), "Error reading video file"

w, h, fps = (int(cap.get(x)) for x in (cv2.CAP_PROP_FRAME_WIDTH, cv2.CAP_PROP_FRAME_HEIGHT, cv2.CAP_PROP_FPS))

out = cv2.VideoWriter(
    "ultralytics_analytics.avi",
    cv2.VideoWriter_fourcc(*"MJPG"),
    fps,
    (1280, 720),  # this is fixed
)

analytics = solutions.Analytics(
    analytics_type="bar",
    show=True,
)

frame_count = 0
while cap.isOpened():
    success, im0 = cap.read()
    if success:
        frame_count += 1
        results = analytics(im0, frame_count)  # update analytics graph every frame
        out.write(results.plot_im)  # write the video file
    else:
        break

cap.release()
out.release()
cv2.destroyAllWindows()
To learn more, visit the Bar Plot section in the guide.
Why should I use Ultralytics YOLO26 for creating pie charts in my data visualization projects?
Ultralytics YOLO26 is an excellent choice for creating pie charts because:
- Integration with Object Detection: Directly integrate object detection results into pie charts for immediate insights.
- User-Friendly API: Simple to set up and use with minimal code.
- Customizable: Various customization options for colors, labels, and more.
- Real-time Updates: Handle and visualize data in real-time, which is ideal for video analytics projects.
Here's a quick example:
import cv2

from ultralytics import solutions

cap = cv2.VideoCapture("path/to/video.mp4")
assert cap.isOpened(), "Error reading video file"

w, h, fps = (int(cap.get(x)) for x in (cv2.CAP_PROP_FRAME_WIDTH, cv2.CAP_PROP_FRAME_HEIGHT, cv2.CAP_PROP_FPS))

out = cv2.VideoWriter(
    "ultralytics_analytics.avi",
    cv2.VideoWriter_fourcc(*"MJPG"),
    fps,
    (1280, 720),  # this is fixed
)

analytics = solutions.Analytics(
    analytics_type="pie",
    show=True,
)

frame_count = 0
while cap.isOpened():
    success, im0 = cap.read()
    if success:
        frame_count += 1
        results = analytics(im0, frame_count)  # update analytics graph every frame
        out.write(results.plot_im)  # write the video file
    else:
        break

cap.release()
out.release()
cv2.destroyAllWindows()
For more information, refer to the Pie Chart section in the guide.
Can Ultralytics YOLO26 be used to track objects and dynamically update visualizations?
Yes, Ultralytics YOLO26 can be used to track objects and dynamically update visualizations. It supports tracking multiple objects in real-time and can update various visualizations like line graphs, bar plots, and pie charts based on the tracked objects' data.
Example for tracking and updating a line graph:
import cv2

from ultralytics import solutions

cap = cv2.VideoCapture("path/to/video.mp4")
assert cap.isOpened(), "Error reading video file"

w, h, fps = (int(cap.get(x)) for x in (cv2.CAP_PROP_FRAME_WIDTH, cv2.CAP_PROP_FRAME_HEIGHT, cv2.CAP_PROP_FPS))

out = cv2.VideoWriter(
    "ultralytics_analytics.avi",
    cv2.VideoWriter_fourcc(*"MJPG"),
    fps,
    (1280, 720),  # this is fixed
)

analytics = solutions.Analytics(
    analytics_type="line",
    show=True,
)

frame_count = 0
while cap.isOpened():
    success, im0 = cap.read()
    if success:
        frame_count += 1
        results = analytics(im0, frame_count)  # update analytics graph every frame
        out.write(results.plot_im)  # write the video file
    else:
        break

cap.release()
out.release()
cv2.destroyAllWindows()
To learn about the complete functionality, see the Tracking section.
What makes Ultralytics YOLO26 different from other object detection solutions like OpenCV and TensorFlow?
Ultralytics YOLO26 stands out from other object detection solutions like OpenCV and TensorFlow for multiple reasons:
- State-of-the-art Accuracy: YOLO26 provides superior accuracy in object detection, segmentation, and classification tasks.
- Ease of Use: User-friendly API allows for quick implementation and integration without extensive coding.
- Real-time Performance: Optimized for high-speed inference, suitable for real-time applications.
- Diverse Applications: Supports various tasks including multi-object tracking, custom model training, and exporting to different formats like ONNX, TensorRT, and CoreML.
- Comprehensive Documentation: Extensive documentation and blog resources to guide users through every step.
For more detailed comparisons and use cases, explore our Ultralytics Blog.


