コンピュータービジョンのためのデータ収集とアノテーション戦略
データ収集とアノテーションは、あらゆるコンピュータービジョンプロジェクトの基盤となる2つのステップです。代表的な画像や動画を集め、モデルが学習できるようにラベルを付けます。このデータの品質はモデルの性能を直接左右するため、トレーニングを始める前に、クラスの定義、偏りのないデータソース、一貫したアノテーションが重要です。
視聴: コンピュータービジョン向けの効果的なデータ収集・アノテーション戦略を構築する方法 🚀
このガイドでは、クラスの設定とデータ収集、データアノテーションとは何か、選択可能なアノテーションの種類と形式、そして効率的なラベリング戦略について解説し、すべての判断をプロジェクトの目標に沿ったものにします。
クラスの設定とデータ収集#
コンピュータービジョンプロジェクト用の画像や動画を収集する際は、定義するクラスの数、データの収集元、データセットの偏りを防ぐ方法という3つの点を決めます。
プロジェクトに適したクラスの選び方#
コンピュータービジョンプロジェクトを始める際、最初に検討する項目の1つがクラス数です。モデルに認識・識別させたいカテゴリーやラベルを含むクラスの構成を決める必要があります。クラス数は、プロジェクト固有の目標に基づいて決定します。
たとえば、交通状況を監視する場合、クラスには「自動車」「トラック」「バス」「オートバイ」「自転車」などが考えられます。一方、店舗の商品を追跡する場合は、「果物」「野菜」「飲料」「スナック」などがクラスになります。プロジェクトの目標に基づいてクラスを定義すると、データセットの関連性と焦点を保ちやすくなります。
クラスを定義する際は、粗い分類にするか、細かい分類にするかも重要な判断事項です。「分類の細かさ」とは、対象とする個別クラスの数を指します。この判断は、データの粒度とモデルの複雑さに影響します。それぞれの方法で考慮すべき点は次のとおりです。
- 粗いクラス分類: 「車両」「車両以外」など、範囲の広い包括的なカテゴリーです。アノテーションが簡単で、必要な計算リソースも少なくなりますが、得られる情報の詳細度が低く、複雑な状況ではモデルの有効性が制限される可能性があります。
- 細かいクラス分類: 「セダン」「SUV」「ピックアップトラック」「オートバイ」など、細かな違いを反映したカテゴリーを設けます。より詳細な情報を捉えられるため、モデルの精度と性能が向上します。ただし、アノテーションに多くの時間と労力がかかり、より多くの計算リソースが必要です。
特に詳細が重要となる複雑なプロジェクトでは、最初から具体的なクラスを設定すると非常に役立ちます。クラスを具体化することで、より詳細なデータを収集し、深い知見を得て、カテゴリー間の違いを明確にできます。モデルの精度が向上するだけでなく、必要に応じて後からモデルを調整しやすくなり、時間とリソースの節約にもつながります。
データソース#
公開データセットを利用するか、独自のカスタムデータを収集できます。KaggleやGoogle Dataset Search Engineなどの公開データセットには、適切にアノテーションされた標準化データが用意されているため、モデルのトレーニングや検証を始めるのに適しています。
一方、カスタムデータを収集すれば、特定のニーズに合わせてデータセットを調整できます。カメラやドローンで画像や動画を撮影したり、Webから画像を収集したり、組織内の既存データを利用したりできます。カスタムデータを使うと、その品質と関連性をより細かく管理できます。公開データとカスタムデータを組み合わせることで、多様で包括的なデータセットを作成できます。
データ収集における偏りの回避#
データセット内で特定のグループや状況の割合が少なすぎたり、多すぎたりすると、偏りが生じます。その結果、あるデータでは高い性能を発揮しても、別のデータでは性能が低いモデルになります。コンピュータービジョンモデルがさまざまな状況で良好に機能するよう、AIにおける偏りを避けることが重要です。
データ収集時に偏りを避ける方法は次のとおりです。
- 多様なソース:さまざまな視点や状況を捉えられるよう、多くのソースからデータを収集します。
- バランスの取れた表現:関連するすべてのグループをバランスよく含めます。たとえば、年齢、性別、民族の違いを考慮します。
- 継続的なモニタリング:データセットを定期的に見直して更新し、新たに生じた偏りを特定して対処します。
- 偏りの軽減手法:少数クラスのオーバーサンプリング、データ拡張、公平性を考慮したアルゴリズムなどの手法を使用します。
こうした方法を実践することで、実環境のアプリケーションで適切に汎化できる、より堅牢で公平なモデルを作成できます。
データアノテーションとは何ですか?#
データアノテーションとは、機械学習モデルのトレーニングに使えるよう、データにラベルを付けるプロセスです。コンピュータービジョンでは、モデルの学習に必要な情報を画像や動画にラベルとして付与します。適切にアノテーションされたデータがなければ、モデルは入力と出力の関係を正確に学習できません。
データアノテーションの種類#
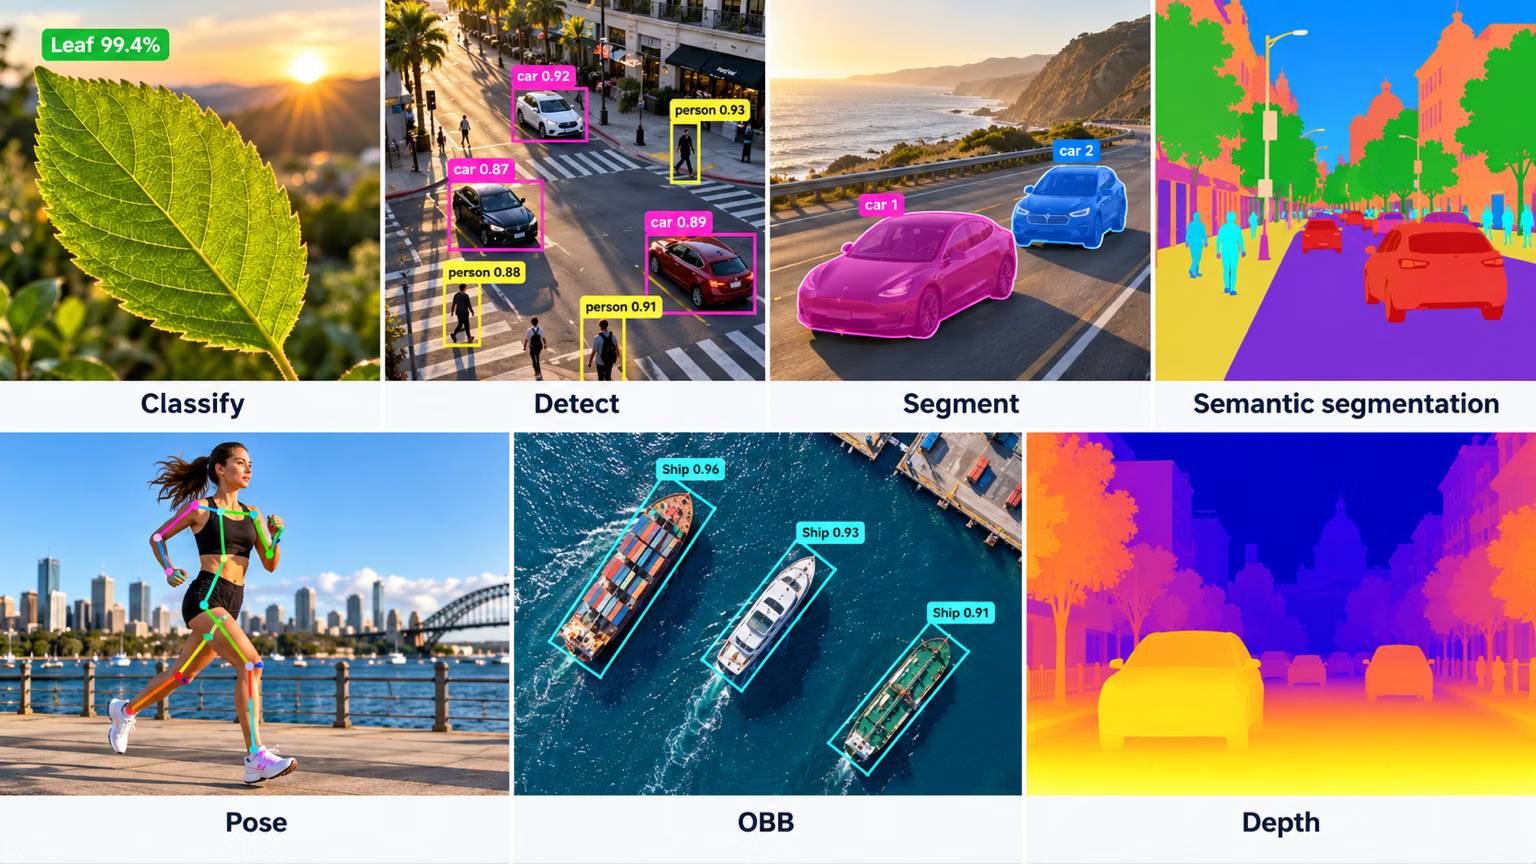
コンピュータービジョンタスクの要件に応じて、さまざまな種類のデータアノテーションがあります。例をいくつか紹介します。
- バウンディングボックス:画像内の物体を囲むように描画する長方形のボックスで、主に物体検出タスクで使用されます。ボックスは左上と右下の座標で定義されます。
- ポリゴン:物体の輪郭を詳細に示し、バウンディングボックスよりも精密なアノテーションを可能にします。物体の形状が重要となるインスタンスセグメンテーションなどのタスクで使用されます。
- マスク:各ピクセルが物体または背景のいずれかを示すバイナリマスクです。セマンティックセグメンテーションタスクで使用し、ピクセル単位の詳細情報を提供します。
- キーポイント:関心のある位置を特定するため、画像内の特定の点に付与します。姿勢推定や顔のランドマーク検出などのタスクで使用されます。
- 回転バウンディングボックス:回転角を持つ長方形です。航空画像のように物体が任意の向きで現れるOBBタスクで使用されます。
一般的なアノテーション形式#
アノテーションの種類を選んだ後は、アノテーションの保存や共有に適した形式を選ぶことが重要です。最も一般的な形式は次のとおりです。
| 形式 | ファイル構成 | 主な用途 |
|---|---|---|
| COCO | 単一のJSONファイル | 物体検出、インスタンスセグメンテーション、キーポイント検出、スタッフおよびパノプティックセグメンテーション、画像キャプション |
| Pascal VOC | 画像ごとに1つのXMLファイル | 物体検出 |
| YOLO | 画像ごとに1つの.txtファイル | 物体検出、セグメンテーション、姿勢推定、回転ボックス |
YOLO形式では、オブジェクトごとに1行を使用し、クラスインデックスは0から始まります。物体検出の場合、行は正規化された0~1の座標を含むclass x_center y_center width heightです。セグメンテーションの行では、バウンディングボックスの代わりに対象物の正規化ポリゴン点を記録します。姿勢の行では、バウンディングボックスを保持し、その後にキーポイント座標を追加します。データセットでkpt_shape: [n, 3]が宣言されている場合、各キーポイントに可視性フラグも付加されます。OBBの行では、正規化された角の座標を使ってclass x1 y1 x2 y2 x3 y3 x4 y4を記録します。
アノテーションツールからCOCO JSONをエクスポートする場合は、YOLOの.txtラベルに変換するか、カスタムデータセットクラスを使ってJSONを直接読み込んでトレーニングすることができます。
アノテーションガイドラインの設定#
アノテーションの種類と形式を選んだら、明確で客観的なラベリングルールを定めます。このルールは、アノテーションプロセス全体の一貫性と精度を保つための指針になります。ルールで重要な点は次のとおりです。
- 明確さと詳細さ:指示が明確であることを確認します。期待する内容を示すため、例や図を使います。
- 一貫性:アノテーションに一貫性を持たせます。データの種類ごとに標準的な基準を定め、すべてのアノテーションで同じルールに従うようにします。
- 偏りの軽減:中立性を保ちます。公平なアノテーションを実現できるよう、客観性を意識し、個人的な偏りを最小限に抑えます。
- 効率性: 反復作業を自動化するツールやワークフローを活用し、アノテーション作業をより迅速かつ効率的に進めます。
ラベリングルールを定期的に見直して更新すると、アノテーションの正確さと一貫性を保ち、プロジェクトの目標に沿った状態を維持できます。
アノテーションツール#
優れたアノテーションツールは、タスクに必要なすべての種類のラベル付けに対応し、一貫したガイドラインを適用し、トレーニングにそのまま使える形式でラベルをエクスポートできます。Ultralytics Platformには、検出、インスタンスセグメンテーション、セマンティックセグメンテーション、分類、姿勢推定、OBBに対応するアノテーションエディターが組み込まれています。また、SAMを活用したスマートアノテーションを使うと、ワンクリックで、検出、インスタンスセグメンテーション、セマンティックセグメンテーション、OBBタスク用のマスクを作成できます。各タスクに必要な形式でアノテーションが保存されるため、空間タスク用のYOLO .txt行や分類用のクラスフォルダーから、変換手順を挟まずにそのままトレーニングへ進められます。
アノテーションの品質:正確さ、精度、外れ値#
大規模なアノテーションを始める前に、精度、適合率、外れ値、品質管理について理解しておくと、データに逆効果となるラベルを付けずに済みます。
正確さと精度を理解する#
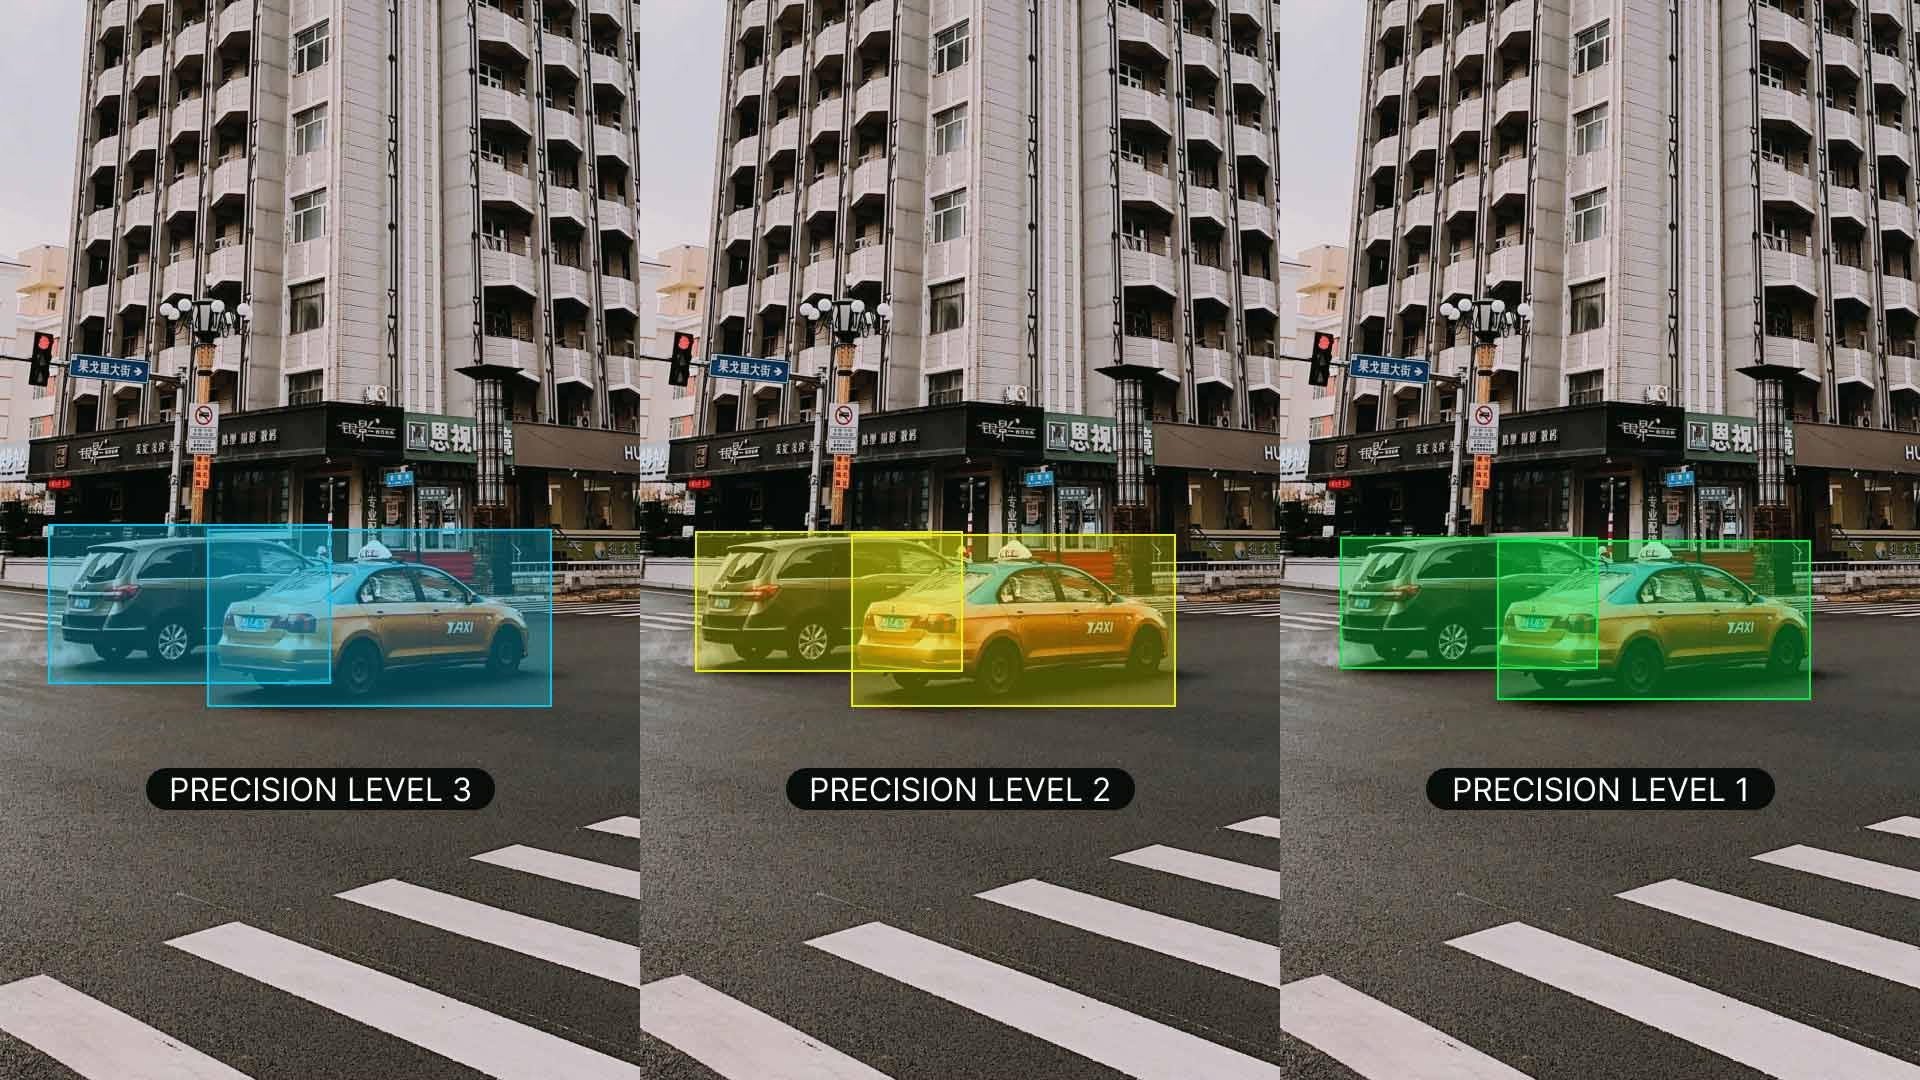
正確さと精度の違い、およびアノテーションとの関係を理解することが重要です。正確さは、アノテーションされたデータが真の値にどれだけ近いかを表し、ラベルが実世界の状況をどの程度反映しているかを測る指標です。精度は、アノテーションの一貫性を示します。同じ物体や特徴に、データセット全体を通して同じラベルを付けているかを確認します。正確さと精度が高いと、ノイズが減り、モデルがトレーニングデータから汎化する能力が向上するため、より優れたモデルをトレーニングできます。
外れ値の特定#
外れ値とは、データセット内の他の観測値から大きく外れたデータポイントです。アノテーションの場合、誤ったラベルが付いた画像や、データセット内の他のデータと整合しないアノテーションが外れ値に当たります。外れ値はモデルの学習プロセスを歪め、予測精度の低下や汎化性能の悪化につながる可能性があるため、注意が必要です。
外れ値の検出と修正には、さまざまな方法を使用できます。
- 統計的手法:ピクセル値、バウンディングボックスの座標、物体のサイズなどの数値特徴における外れ値の検出には、箱ひげ図、ヒストグラム、Zスコアなどの手法を使用できます。
- 視覚的手法:物体クラス、色、形状などのカテゴリ特徴の異常を見つけるには、画像、ラベル、ヒートマップをプロットするなどの視覚的な方法を使用します。
- アルゴリズム手法: クラスタリング(例: K-meansクラスタリング、DBSCAN)や異常検知アルゴリズムなどのツールを使い、データ分布のパターンに基づいて外れ値を特定します。
アノテーション済みデータの品質管理#
他の技術プロジェクトと同様、アノテーション済みデータの品質管理は欠かせません。アノテーションの正確さと一貫性を確保するため、定期的に確認することをお勧めします。確認方法はいくつかあります。
- アノテーション済みデータのサンプルを確認する
- 自動ツールを使ってよくあるエラーを見つける
- 別の担当者にアノテーションを再確認してもらう
複数人で作業する場合、アノテーター間の一貫性が重要です。アノテーター間一致度が高いということは、ガイドラインが明確で、全員が同じ方法で従っていることを意味します。これにより、全員の認識が揃い、アノテーションの一貫性が保たれます。
確認中にエラーを見つけた場合は修正し、同じミスを繰り返さないようガイドラインを更新します。アノテーターにフィードバックを提供し、エラーを減らすための定期的なトレーニングも行います。エラーへの対応プロセスを確立することで、データセットの正確さと信頼性を維持できます。
効率的なデータラベリング戦略#
データラベリングのプロセスをよりスムーズかつ効果的に進めるには、次の戦略を取り入れることを検討してください。
- 明確なアノテーションガイドライン: すべてのアノテーターがタスクを一貫して解釈できるよう、例を含む詳細な手順を提示します。たとえば、鳥をラベリングする場合は、鳥全体を含めるのか、特定の部位だけを含めるのかを明確にします。
- 定期的な品質チェック: ベンチマークを設定し、具体的な指標を使って作業をレビューします。継続的なフィードバックを通じて、高い基準を維持します。
- 事前アノテーションツールの活用: 多くの最新のアノテーションプラットフォームには、AI支援による事前アノテーション機能があり、人間が後から修正できる初期アノテーションを自動生成することで、プロセスを大幅に高速化できます。
- アクティブラーニングの導入: この手法では、情報量の多いサンプルから優先的にラベル付けするため、モデルの性能を維持しながら、必要なアノテーションの総数を削減できます。
- バッチ処理: 類似した画像をまとめてアノテーションすることで、一貫性を保ち、効率を高めます。
これらの戦略は、ラベリングに必要な時間とリソースを削減しながら、高品質なアノテーションを維持するのに役立ちます。
結論#
多様で偏りのないデータを収集し、適切なツールを使って一貫性のあるアノテーションを行うことは、信頼性の高いコンピュータービジョンモデルの基盤です。データセットの収集とラベリングが完了したら、コンピュータービジョンプロジェクトの手順ガイドに進み、トレーニングと評価を始めましょう。途中で疑問が生じた場合は、Ultralytics GitHubリポジトリまたはUltralytics Discordサーバーでコミュニティに質問してください。
よくある質問#
偏りを最小限に抑えるには、多様なソースからデータを収集し、関連するすべてのグループ(年齢、性別、民族など)がバランスよく含まれていることを確認します。また、新たに生じる偏りを検出できるよう、データセットを定期的にレビューして更新し、過少代表クラスのオーバーサンプリング、データ拡張、公平性を考慮したアルゴリズムなどの緩和手法を適用します。この方法で偏りを避けると、さまざまな実環境の状況でコンピュータービジョンモデルが良好に動作し、汎化能力も向上します。
詳細な手順、例、図解を含む、明確で客観的なラベリングガイドラインを確立し、すべてのデータタイプに一律に適用して、すべてのアノテーションが同じルールに従うようにします。個人的な偏りを減らすためにアノテーターをトレーニングして中立性を保たせ、ガイドラインを定期的にレビューして更新します。また、自動一貫性チェックとアノテーター間のフィードバックを活用し、プロジェクトの目標に沿った高い精度を維持します。
転移学習を試すには、クラスごとに数百個のアノテーション済みオブジェクトがあれば十分ですが、信頼性の高い実環境での性能を得るには、Ultralyticsはクラスごとに少なくとも1,500枚の画像と10,000個のラベル付きインスタンスを推奨しています。十分な規模のデータセットと妥当なトレーニングスケジュールを組み合わせてください。一般的な開始点は約300エポックですが、モデルが早期に過学習する場合はエポック数を減らします。また、アノテーションの厳密さを保ち、プロジェクト固有の目標に合わせてください。詳しいトレーニング戦略については、YOLO26トレーニングガイドをご覧ください。
はい。Ultralytics Platformには、バウンディングボックス、ポリゴン、キーポイント、回転ボックス、分類ラベルに対応するアノテーションエディターが組み込まれており、単一のワークスペースで作業できます。SAMを活用したスマートアノテーションでは、ワンクリックでマスクを生成し、物体検出、インスタンスセグメンテーション、セマンティックセグメンテーション、OBBタスクのラベリングを高速化できます。ポーズデータセットではYOLO poseモデルをスマートアノテーションに使用でき、分類は手動でアノテーションします。アノテーションは各タスクに必要な形式で保存されます。空間タスクではYOLO
.txt形式の行、分類ではクラスフォルダーに保存され、トレーニングにすぐ使えます。トレーニングするタスクに合わせてアノテーションタイプを選びます。バウンディングボックスは最もすばやく描画でき、物体検出に必要なのはバウンディングボックスだけです。ポリゴンとマスクはオブジェクトごとにかなり多くの時間がかかりますが、オブジェクトの正確な形状が重要なインスタンスセグメンテーションには必要です。キーポイントは姿勢推定やランドマーク検出に適しており、回転ボックスは、軸に平行な長方形では背景を広く囲みすぎる航空画像などのOBBタスクに適しています。実際に必要なタスクに合わせてアノテーションの粒度を選ぶことで、成果に見合った作業量にできます。


コメント16
質問したり、結果を共有したり、ほかの人をサポートしたりできます。
 Letícia Rama
Hello,
Has anyone worked with oriented object detection using a multisource dataset that combines satellite and UAV imagery?
I am currently developing a scientific project focused on oriented detection of fishing vessels. As part of this work, I conducted two systematic reviews: one covering existing oriented detection models and another covering publicly available datasets. So far, I have identified multisource datasets that combine imagery from multiple satellite platforms; however, I have not found datasets that explicitly integrate both satellite and UAV images.
I understand the importance of source diversity to mitigate dataset bias and improve model generalization. That said, I would appreciate insights from the community on whether combining UAV and satellite imagery might introduce excessive domain variability (e.g., differences in spatial resolution, viewing angles, and sensor characteristics), potentially hindering model training and convergence.
Any experiences, references, or best practices related to this type of multisource setup would be highly appreciated.
 Glenn JocherUltralytics
Great question—mixing UAV + satellite can increase domain shift (GSD/resolution, look-angle, sensor PSF), but it’s usually manageable if you control the dataset and evaluation: keep one unified, very explicit labeling policy (same object extent/rotation rules) and balanced sampling as described in our Data Collection and Annotation guide, then train with per-source “slice” validation (sat-only/UAV-only) and consider staged training (pretrain on the larger domain, then fine-tune on the smaller) rather than a single fully-mixed run; if you’re using Ultralytics YOLO for oriented detection, the OBB task docs cover the expected label format and training flow—feel free to share your planned split strategy and a couple example tiles (UAV + satellite) here and the team/community can sanity-check the setup.
1- Letícia Rama
Hi Glenn,
To be more specific,
I am using a pretrained yolo26 m obb to perform detection of a single class: ships of a particular type (fishing boats).
I have a dataset with satellite optical images collected from google earth pro counting 331 pairs of images/labels. The total number of instances is 5974. Images size are fixed at 4823 height x 8192 width. The bounding boxes have 0.075 height x 0.04 width (according to yolo train results). Resolution varies from very-low to very-high. The images were captured with an altitude between 200-400 meters.
I also have 21 very-high resolution images collected from UAV. Images size are fixed at 3072 height x 4096 width. The images were captured with an altitude of 120 meters.
I would like to test if incorporating UAV images in training data would improved the models hability to detect the objects.
From what you proposed, please confirm if I understood correctly:
- Should the train set be mixed (sat+UAV) and the validation set be separate (sat-only/UAV-only)?
- If so, is this separation configured the staged training you are refering? That is, pretrain with sat+UAV as the train set and sat-only as validation subset, and further fine-tune with the same train subset (sat+UAV) but now using the uav-only as the validation set?
Thanks
- Letícia Rama
OBS.: sorry, sometimes I wrote 'train subset', and 'validation subset' but all of them was supposed to be written as 'train set', and 'validation set'.
- Glenn JocherUltralytics
Your first interpretation is correct: compare a satellite-only baseline against mixed satellite+UAV training while keeping fixed, disjoint satellite-only and UAV-only evaluation sets. This is not staged training—changing only the validation set does not fine-tune the model. Staged training would first train on satellite data, then continue from that checkpoint using only the UAV training split with a lower learning rate, evaluating both domains afterward. With only 21 UAV images, split by original scene before tiling to prevent leakage, and consider grouped k-fold validation because a single UAV split will be unstable.
1 - Letícia Rama
Understood, thanks.
Sudharsanam-1
hello ! For detecting 31 Chinese symbols (16 true and 15 fake), how many classes should be used in the model? Is it more efficient to detect the true symbols using only true class , or should we also include the fake symbols as separate classes?
Team-Q-Botix
I’m working on Robocon 2026 (Kung Fu Quest) and using YOLO-seg for detecting KFS symbols — ancient Chinese oracle bone characters. There are 15 true symbols, 15 fake ones (random patterns mimicking the real ones), plus 1 “other” class → total 31 classes.
Do you think instance segmentation (YOLOv8-seg / YOLOv11-seg) is the right approach for these detailed 2D symbols, or would box detection + contour refinement be better? Also, any advice on which model to start with and how large a dataset (per class) you’d recommend for good mask performance on Jetson Orin?
robert-hardman
Hello In object recognition with YOLO11 If we label images by drawing polygons: When training, does YOLO11 convert polygon coordinates to boxes? How does Inference handle polygon coordinates?
- Glenn JocherUltralytics
@robert-hardman yOLO11 does not inherently convert polygon annotations to bounding boxes during training. Polygons are used directly for tasks like instance segmentation, while bounding boxes are utilized for object detection. During inference, polygon annotations are retained for segmentation tasks, ensuring accurate object shape representation. For more on annotation types, refer to Data Annotation Guide.
1
ghost
Hello, thanks for the info ! I would like to know how to perform active learning, specifically what are the metrics to choose the most informative images when the task is multi-instance multi-class object detection ?
 Paula DerrengerUltralytics(編集済み)
@cawilchesp hello! Great question on active learning for multi-instance multi-class object detection. Active learning can significantly enhance your model by iteratively selecting the most informative samples for annotation. Here are some key metrics and strategies to consider:
Metrics for Selecting Informative Images:
-
Uncertainty Sampling: Choose images where the model is least confident. This can be measured using:
- Entropy: High entropy indicates uncertainty in predictions.
- Margin Sampling: Select samples where the difference between the top two class probabilities is smallest.
- Least Confidence: Select samples with the lowest maximum class probability.
-
Diversity Sampling: Ensure a diverse set of samples to avoid redundancy.
- Core-Set Selection: Use clustering techniques to select a diverse subset of data points.
- Representative Sampling: Choose samples that represent the overall data distribution.
-
Error-Based Sampling: Focus on samples where the model previously made errors.
- Misclassified Samples: Select images where the model's predictions were incorrect.
- High Loss Samples: Choose samples with high loss values during training.
Implementing Active Learning:
Here's a basic example using least-confidence uncertainty sampling for detection, based on each image's mean box confidence (
result.probsis only available for classification models):import numpy as np from ultralytics import YOLO # Load your model model = YOLO('yolo26n.pt') # Predict on a batch of images results = model(['image1.jpg', 'image2.jpg', 'image3.jpg']) # Mean box confidence per image (0 if nothing was detected) scores = [r.boxes.conf.mean().item() if len(r.boxes) else 0.0 for r in results] # Select the image with the lowest confidence most_informative_image = results[int(np.argmin(scores))]Additional Resources:
For more detailed strategies and examples, you can refer to our Data Collection and Annotation Strategies.
Feel free to experiment with these methods and see which works best for your specific use case. If you have any further questions or need more examples, don't hesitate to ask! 😊
-
MoAbbasid
Hello, Im looking for an open source annotation tool similar to labelme that exports directly to YOLOv8 format, something other than labelme?
- Glenn JocherUltralytics
@MoAbbasid hello! For an open-source annotation tool that exports directly to YOLOv8 format, you might want to try CVAT. It's quite versatile and supports exporting annotations directly into YOLO format among others. Another good option could be Label Studio, which offers flexibility in configuring export formats, including YOLO. Both tools provide robust features for efficient data labeling and are well-suited for various annotation tasks. Happy annotating! 😊
1 @glenn-jocher do they offer polygon annotations for instance segmentation?
- Glenn JocherUltralytics(編集済み)
Hello @MoAbbasid,
Yes, Ultralytics YOLO does support polygon annotations for instance segmentation. This allows for more precise labeling of objects compared to traditional bounding boxes, which can be particularly useful for complex shapes and detailed segmentation tasks.
To create polygon annotations, you can use tools like Roboflow Annotate or CVAT. Both of these tools support polygon annotations and can export the data in a format compatible with Ultralytics YOLO.
Here's a brief overview of how you can use Roboflow for this purpose:
- Create a Project: Start by creating a new project in Roboflow.
- Upload Images: Upload your images to the project.
- Annotate Images: Use the polygon tool to draw detailed outlines around objects. Roboflow also offers a SAM-based label assistant to speed up the annotation process.
- Export Annotations: Once your annotations are complete, you can export the dataset in YOLO format.
For more detailed steps on using Roboflow for data annotation and management, you can refer to the Roboflow documentation.
Here's a quick example of how to load and use a dataset with polygon annotations:
from ultralytics import YOLO

# Load a YOLO26 segmentation model
model = YOLO('yolo26n-seg.pt')

# Train the model on your custom dataset
model.train(data='path/to/your/dataset.yaml', epochs=100, imgsz=640)

# Validate the model
metrics = model.val()

# Make predictions
results = model.predict(source='path/to/your/images')

# Visualize results
results[0].show()
Feel free to reach out if you have any more questions or need further assistance. Happy annotating! 😊
1