Visuelle Einblicke gewinnen durch die Integration von YOLO26 mit TensorBoard
Das Verständnis und die Feinabstimmung von Computer Vision-Modellen wie Ultralytics' YOLO26 werden einfacher, wenn man ihre Trainingsprozesse genauer betrachtet. Die Visualisierung des Modelltrainings hilft dabei, Einblicke in die Lernmuster, Leistungsmetriken und das Gesamtverhalten des Modells zu gewinnen. Die Integration von YOLO26 mit TensorBoard erleichtert diesen Visualisierungs- und Analyseprozess und ermöglicht effizientere und fundiertere Anpassungen am Modell.
Dieser Leitfaden behandelt die Verwendung von TensorBoard mit YOLO26. Sie erfahren mehr über verschiedene Visualisierungen, vom tracken von Metriken bis zur Analyse von Modellgraphen. Diese Tools helfen Ihnen, die Leistung Ihres YOLO26-Modells besser zu verstehen.
TensorBoard
TensorBoard, das Visualisierungs-Toolkit von TensorFlow, ist unerlässlich für Machine-Learning-Experimente. TensorBoard bietet eine Reihe von Visualisierungstools, die für die Überwachung von Machine-Learning-Modellen entscheidend sind. Zu diesen Tools gehören die Verfolgung wichtiger Metriken wie Verlust und Genauigkeit, die Visualisierung von Modellgraphen und die Anzeige von Histogrammen von Gewichten und Verzerrungen im Zeitverlauf. Es bietet auch Funktionen zur Projektierung von Einbettungen in niedrigere dimensionale Räume und zur Anzeige von Multimediadaten.
YOLO26-Training mit TensorBoard
Die Verwendung von TensorBoard während des Trainings von YOLO26-Modellen ist unkompliziert und bietet erhebliche Vorteile.
Installation
Um das erforderliche Paket zu installieren, führen Sie Folgendes aus:
Installation
# Install the required package for YOLO26 and Tensorboard
pip install ultralytics
TensorBoard ist praktischerweise mit YOLO26 vorinstalliert, wodurch keine zusätzliche Einrichtung für Visualisierungszwecke erforderlich ist.
Für detaillierte Anweisungen und Best Practices bezüglich des Installationsprozesses sehen Sie sich unbedingt unseren YOLO26-Installationsleitfaden an. Sollten Sie bei der Installation der erforderlichen Pakete für YOLO26 auf Schwierigkeiten stoßen, konsultieren Sie unseren Leitfaden für häufige Probleme für Lösungen und Tipps.
Konfigurieren von TensorBoard für Google Colab
Bei der Verwendung von Google Colab ist es wichtig, TensorBoard einzurichten, bevor Sie mit Ihrem Trainingscode beginnen:
Konfigurieren von TensorBoard für Google Colab
%load_ext tensorboard
%tensorboard --logdir path/to/runs
Nutzung
Bevor Sie sich mit den Nutzungsanweisungen befassen, sehen Sie sich unbedingt die Palette der von Ultralytics angebotenen YOLO26-Modelle an. Dies hilft Ihnen, das am besten geeignete Modell für Ihre Projektanforderungen auszuwählen.
TensorBoard aktivieren oder deaktivieren
Standardmäßig ist die TensorBoard-Protokollierung deaktiviert. Sie können die Protokollierung aktivieren oder deaktivieren, indem Sie die Option yolo settings Befehl ausführen.
# Enable TensorBoard logging
yolo settings tensorboard=True

# Disable TensorBoard logging
yolo settings tensorboard=False
Nutzung
from ultralytics import YOLO

# Load a pretrained model
model = YOLO("yolo26n.pt")

# Train the model
results = model.train(data="coco8.yaml", epochs=100, imgsz=640)
Bei Ausführung des obigen Code-Snippets können Sie die folgende Ausgabe erwarten:
TensorBoard: Start with 'tensorboard --logdir path_to_your_tensorboard_logs', view at http://localhost:6006/
Diese Ausgabe zeigt an, dass TensorBoard Ihre YOLO26-Trainingssitzung nun aktiv überwacht. Sie können das TensorBoard-Dashboard über die angegebene URL (http://localhost:6006/) aufrufen, um Trainingsmetriken und die Modellleistung in Echtzeit anzuzeigen. Für Benutzer, die in Google Colab arbeiten, wird das TensorBoard in derselben Zelle angezeigt, in der Sie die TensorBoard-Konfigurationsbefehle ausgeführt haben.
Weitere Informationen zum Modelltrainingsprozess finden Sie in unserem YOLO26 Modell-Trainingsleitfaden. Wenn Sie mehr über Logging, Checkpoints, Plotting und Dateiverwaltung erfahren möchten, lesen Sie unseren Nutzungsleitfaden zur Konfiguration.
TensorBoard für das YOLO26-Training verstehen
Konzentrieren wir uns nun darauf, die verschiedenen Funktionen und Komponenten von TensorBoard im Kontext des YOLO26-Trainings zu verstehen. Die drei Hauptbereiche von TensorBoard sind Zeitreihen, Skalare und Graphen.
Zeitreihen
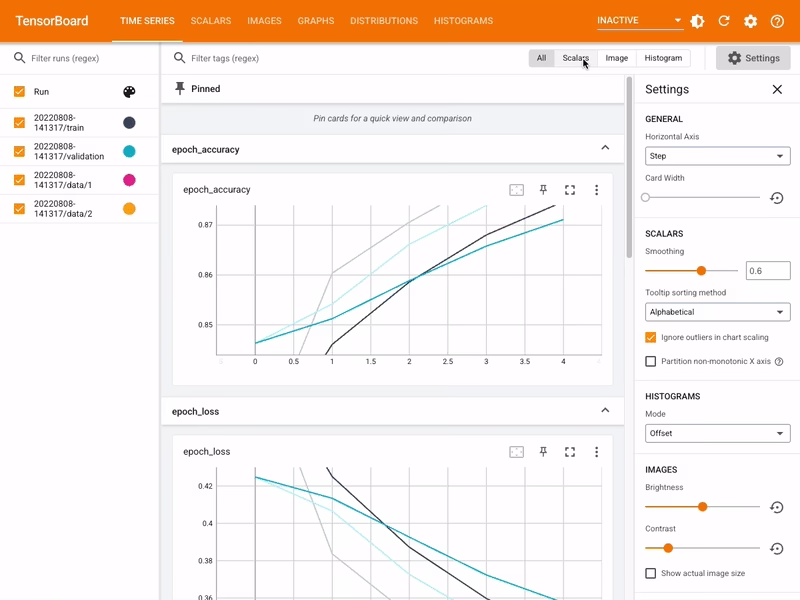
Die Zeitreihenfunktion in TensorBoard bietet eine dynamische und detaillierte Perspektive verschiedener Trainingsmetriken über die Zeit für YOLO26-Modelle. Sie konzentriert sich auf den Verlauf und die Trends der Metriken über die Trainings-Epochen hinweg. Hier ist ein Beispiel dafür, was Sie erwarten können.
Hauptmerkmale von Zeitreihen in TensorBoard
Filter-Tags und angeheftete Karten: Diese Funktionalität ermöglicht es Benutzern, bestimmte Metriken zu filtern und Karten für einen schnellen Vergleich und Zugriff anzuheften. Dies ist besonders nützlich, um sich auf bestimmte Aspekte des Trainingsprozesses zu konzentrieren.
Detaillierte Metrikkarten: Zeitreihen unterteilt Metriken in verschiedene Kategorien wie Lernrate (lr), Training (train) und Validierungsmetriken (val), die jeweils durch einzelne Karten dargestellt werden.
Grafische Anzeige: Jede Karte im Zeitreihenabschnitt zeigt ein detailliertes Diagramm einer bestimmten Metrik im Laufe des Trainings. Diese visuelle Darstellung hilft bei der Identifizierung von Trends, Mustern oder Anomalien im Trainingsprozess.
Tiefgehende Analyse: Zeitreihen bietet eine tiefgehende Analyse jeder Metrik. Beispielsweise werden verschiedene Lernratensegmente angezeigt, die Einblicke geben, wie sich Anpassungen der Lernrate auf die Lernkurve des Modells auswirken.
Bedeutung von Zeitreihen im YOLO26-Training
Der Zeitreihenbereich ist unerlässlich für eine gründliche Analyse des Trainingsfortschritts des YOLO26-Modells. Er ermöglicht es Ihnen, die Metriken in Echtzeit zu verfolgen, um Probleme schnell zu identifizieren und zu lösen. Er bietet auch eine detaillierte Ansicht des Verlaufs jeder Metrik, was entscheidend für die Feinabstimmung des Modells und die Verbesserung seiner Leistung ist.
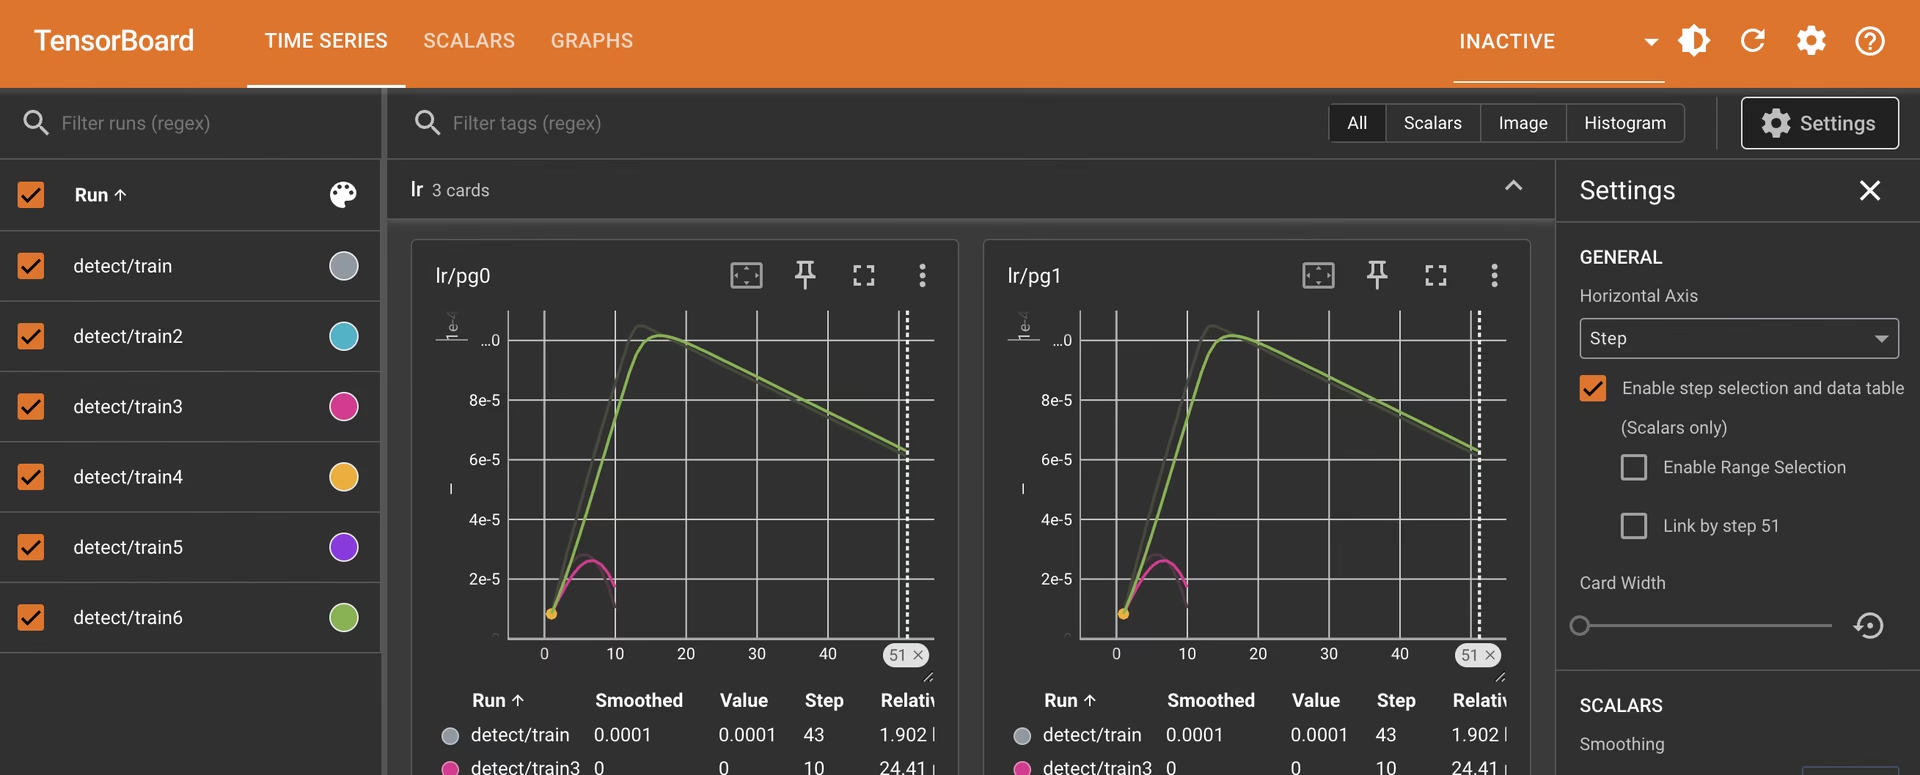
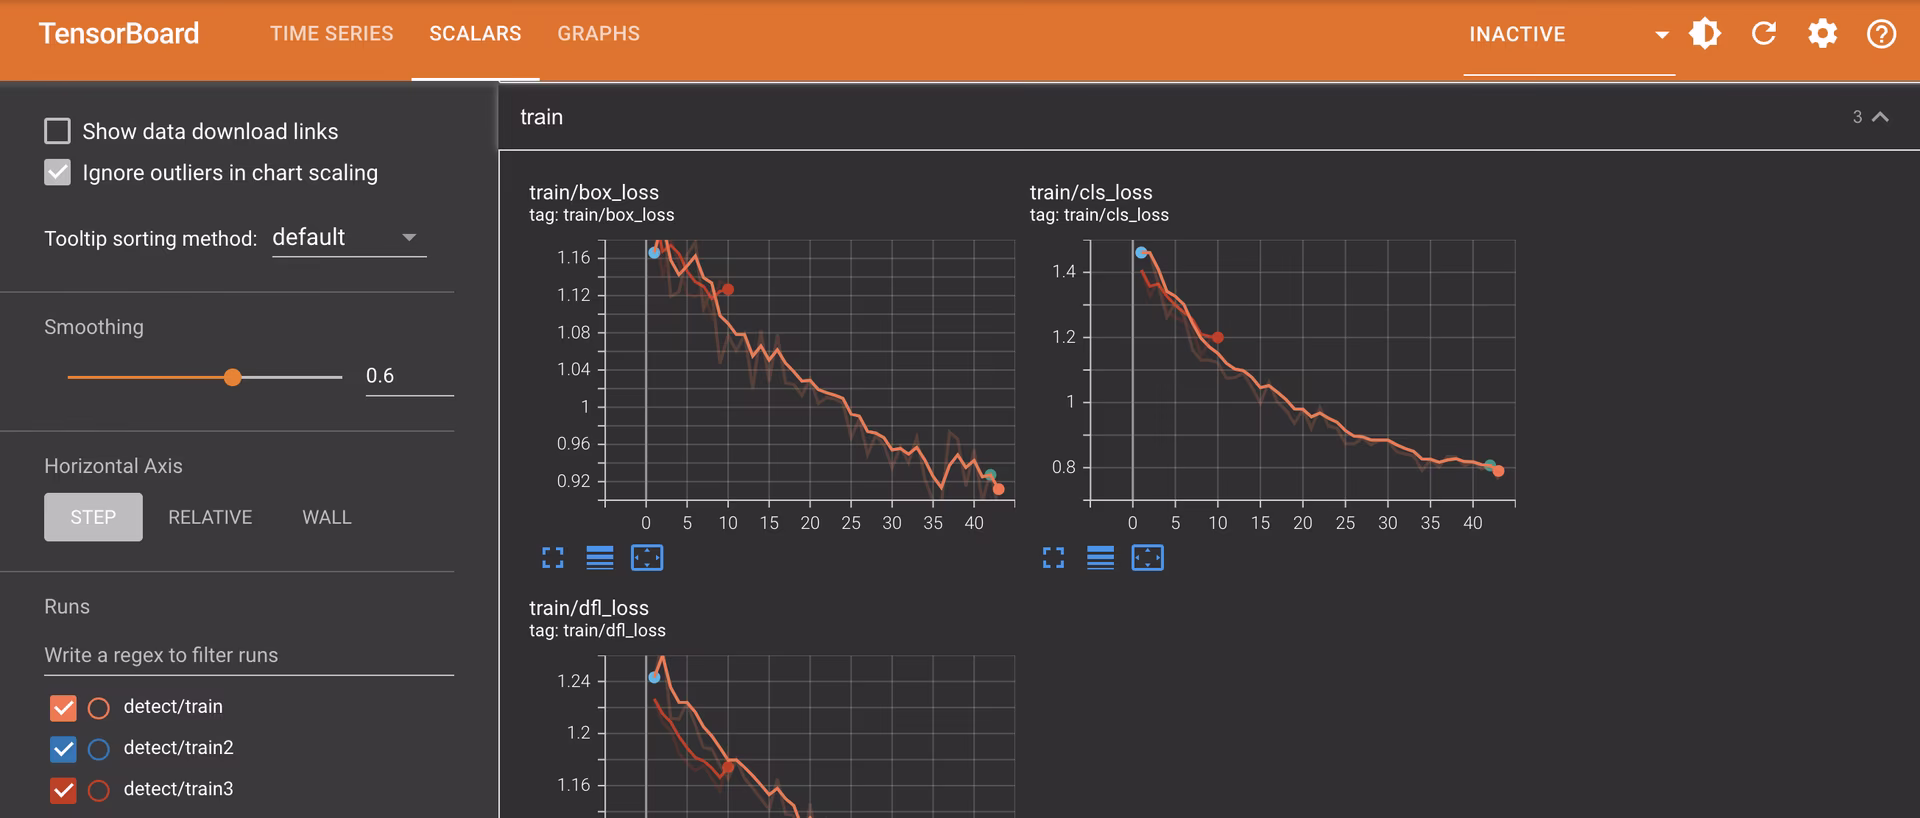
Skalare
Skalare in TensorBoard sind entscheidend für die Darstellung und Analyse einfacher Metriken wie Verlust (loss) und Genauigkeit (accuracy) während des Trainings von YOLO26-Modellen. Sie bieten eine klare und prägnante Ansicht, wie sich diese Metriken mit jeder Trainings-Epoche entwickeln, und geben Einblicke in die Lerneffektivität und Stabilität des Modells. Hier ist ein Beispiel dafür, was Sie erwarten können.
Hauptmerkmale von Skalaren in TensorBoard
Lernrate (lr) Tags: Diese Tags zeigen die Variationen der Lernrate über verschiedene Segmente hinweg (z. B.
pg0,pg1,pg2). Dies hilft uns, die Auswirkungen von Anpassungen der Lernrate auf den Trainingsprozess zu verstehen.Metrik-Tags: Skalare umfassen Leistungsindikatoren wie:
mAP50 (B): Mittlerer Durchschnitt Präzision bei 50% Intersection over Union (Schnittmenge über Vereinigung) (IoU), entscheidend für die Bewertung der Genauigkeit der Objekterkennung.mAP50-95 (B): Mittlere durchschnittliche Präzision berechnet über einen Bereich von IoU-Schwellenwerten, was eine umfassendere Bewertung der Genauigkeit ermöglicht.Precision (B): Gibt das Verhältnis der korrekt vorhergesagten positiven Beobachtungen an, was für das Verständnis der Vorhersage wichtig ist Genauigkeit.Recall (B): Diese Metrik ist wichtig für Modelle, bei denen das Übersehen einer Detektion von Bedeutung ist. Sie misst die Fähigkeit, alle relevanten Instanzen zu detect.Um mehr über die verschiedenen Metriken zu erfahren, lesen Sie unseren Leitfaden zu Leistungsmetriken.
Training- und Validierungs-Tags (
train,val): Diese Tags zeigen Metriken speziell für die Trainings- und Validierungsdatensätze an und ermöglichen so eine vergleichende Analyse der Modellleistung über verschiedene Datensätze hinweg.
Bedeutung der Überwachung von Skalaren
Die Beobachtung skalarer Metriken ist entscheidend für die Feinabstimmung des YOLO26-Modells. Variationen in diesen Metriken, wie Spitzen oder unregelmäßige Muster in Verlustgraphen, können potenzielle Probleme wie Overfitting, Underfitting oder ungeeignete Lernrateneinstellungen aufzeigen. Durch die genaue Überwachung dieser Skalare können Sie fundierte Entscheidungen treffen, um den Trainingsprozess zu optimieren und sicherzustellen, dass das Modell effektiv lernt und die gewünschte Leistung erzielt.
Unterschied zwischen Skalaren und Zeitreihen
Während sowohl Skalare als auch Zeitreihen in TensorBoard zum Verfolgen von Metriken verwendet werden, dienen sie leicht unterschiedlichen Zwecken. Skalare konzentrieren sich auf das Plotten einfacher Metriken wie Verlust und Genauigkeit als Skalarwerte. Sie bieten einen allgemeinen Überblick darüber, wie sich diese Metriken mit jeder Trainingsepoche ändern. In der Zwischenzeit bietet der Zeitreihenabschnitt des TensorBoard eine detailliertere Zeitleistenansicht verschiedener Metriken. Es ist besonders nützlich, um den Fortschritt und die Trends von Metriken im Zeitverlauf zu überwachen und einen tieferen Einblick in die Besonderheiten des Trainingsprozesses zu erhalten.
Graphen
Der Graphen-Bereich von TensorBoard visualisiert den Berechnungs-Graphen des YOLO26-Modells und zeigt, wie Operationen und Daten innerhalb des Modells fließen. Es ist ein leistungsstarkes Werkzeug, um die Struktur des Modells zu verstehen, sicherzustellen, dass alle Schichten korrekt verbunden sind, und um potenzielle Engpässe im Datenfluss zu identifizieren. Hier ist ein Beispiel dafür, was Sie erwarten können.
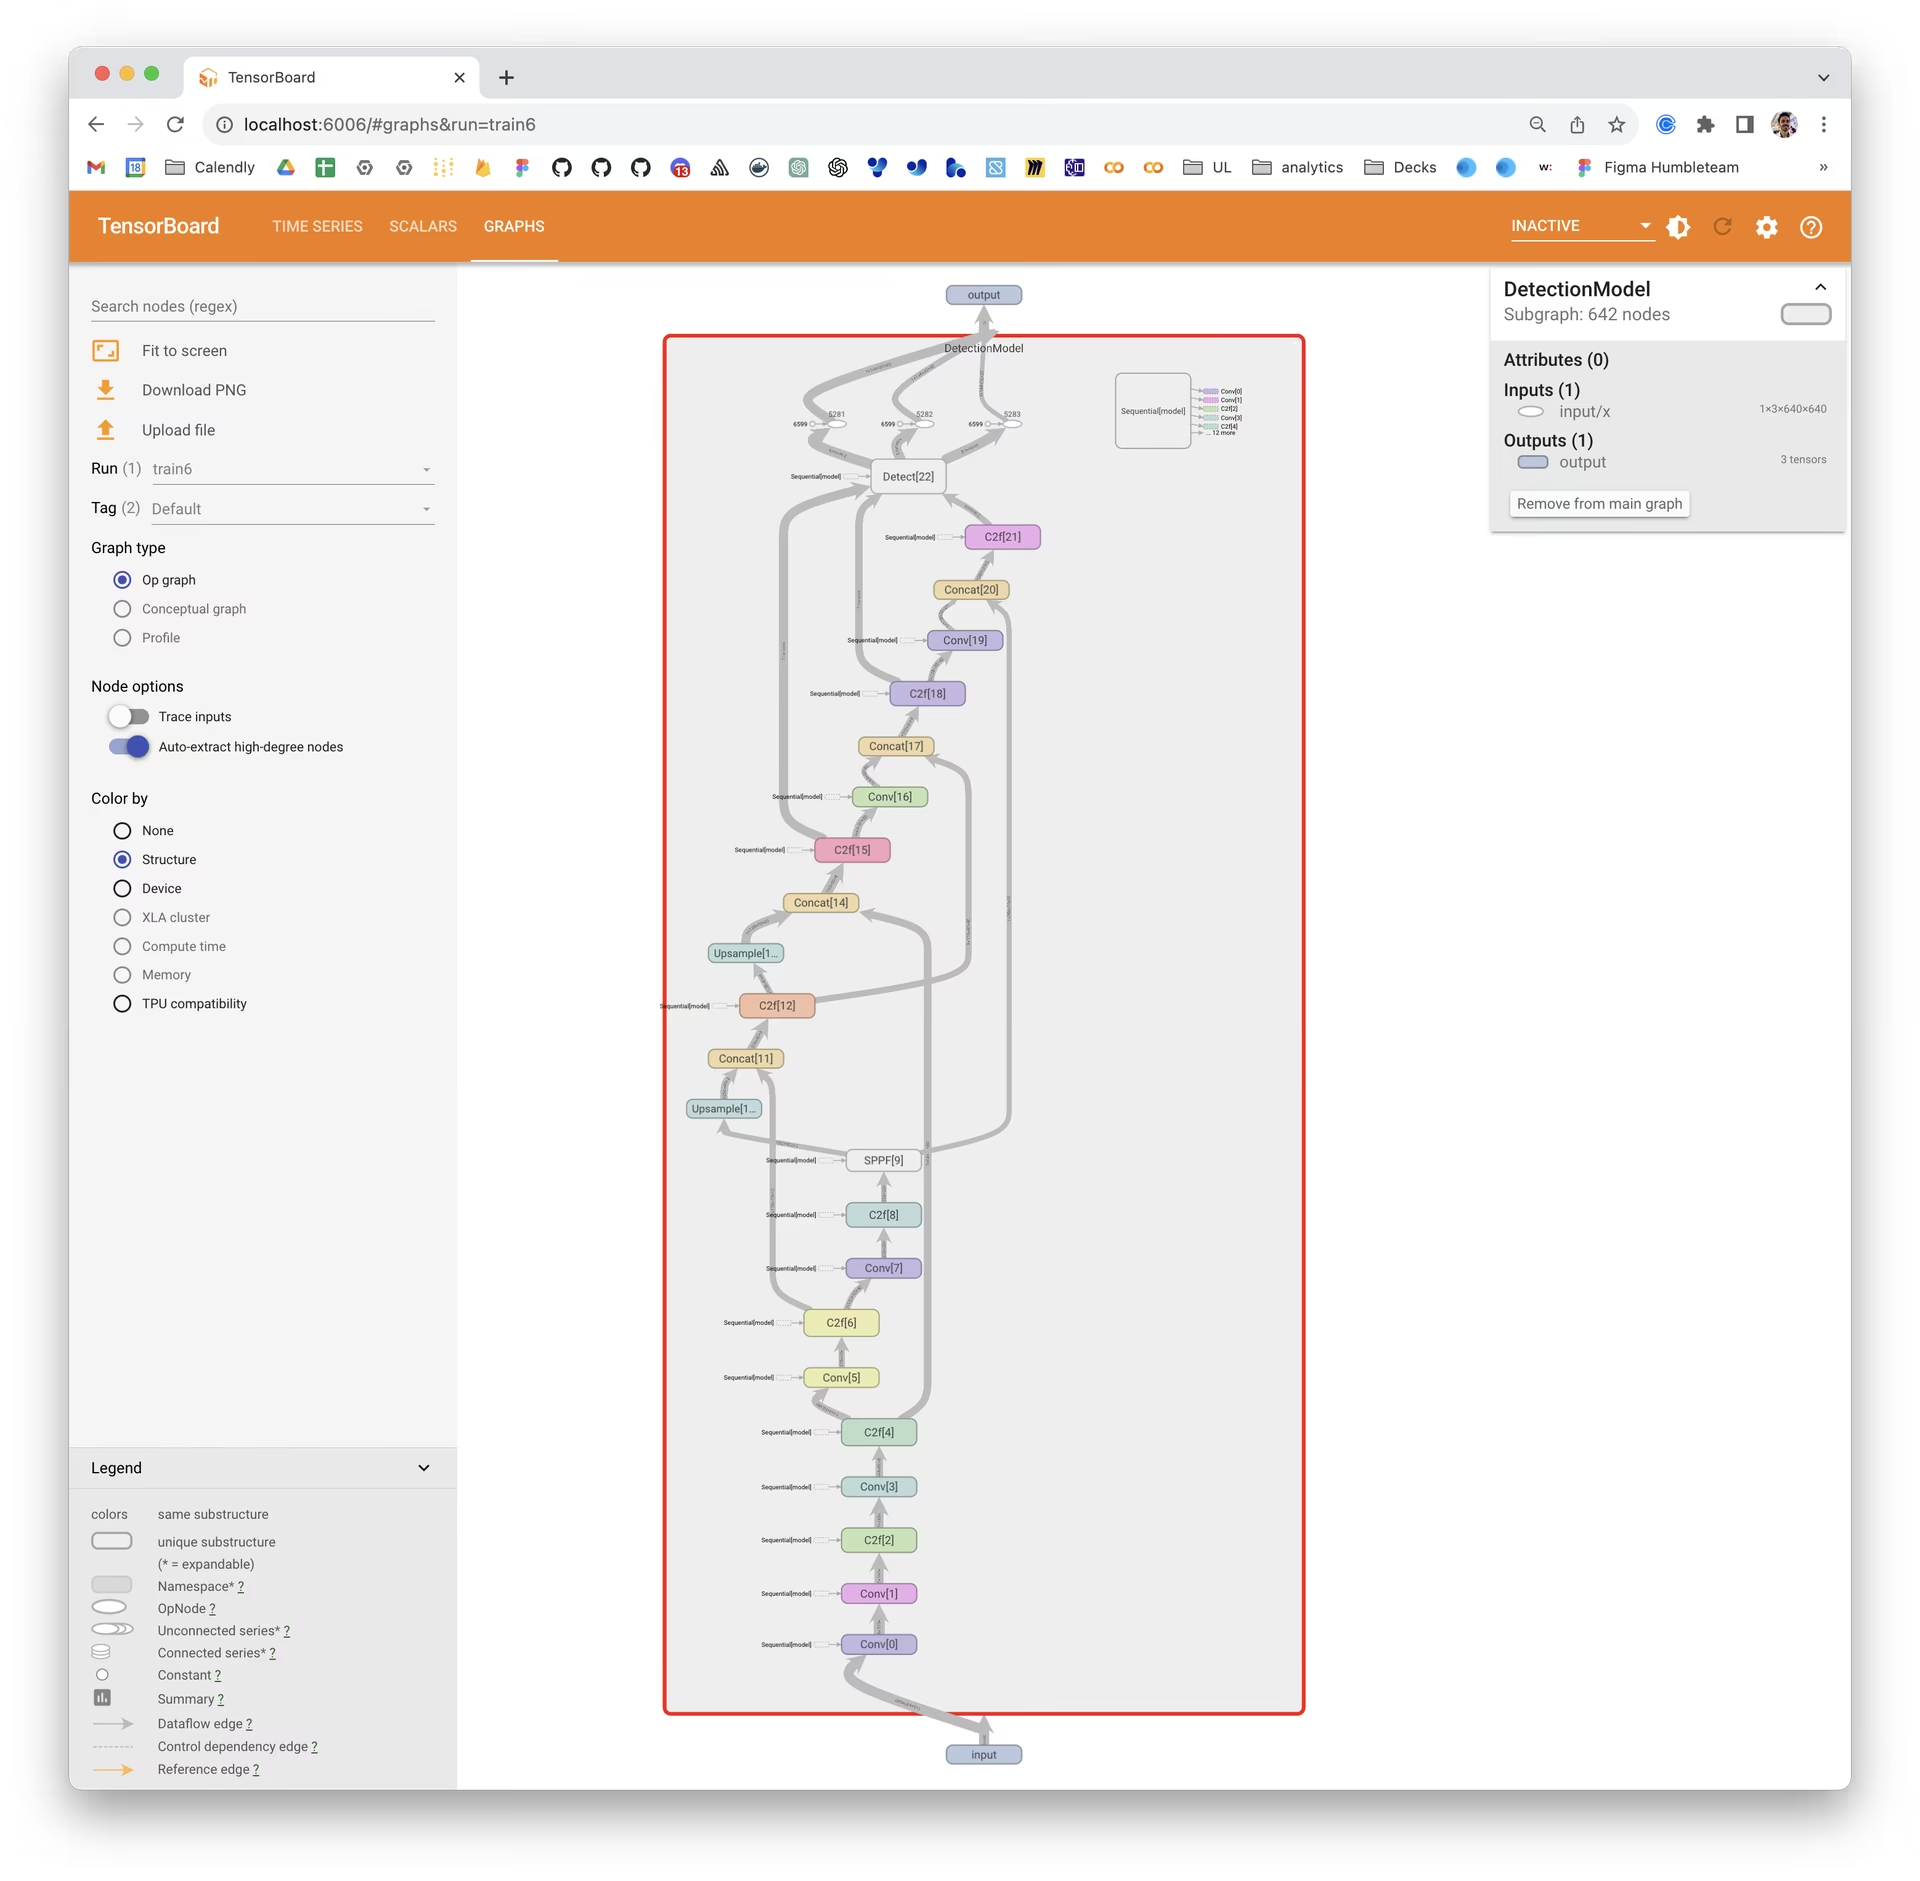
Graphen sind besonders nützlich für das Debugging des Modells, insbesondere bei komplexen Architekturen, die typisch für Deep Learning-Modelle wie YOLO26 sind. Sie helfen bei der Überprüfung von Schichtverbindungen und dem Gesamtdesign des Modells.
Zusammenfassung
Dieser Leitfaden soll Ihnen helfen, TensorBoard mit YOLO26 zur Visualisierung und Analyse des Trainings von Machine-Learning-Modellen zu verwenden. Er konzentriert sich darauf zu erklären, wie wichtige TensorBoard-Funktionen Einblicke in Trainingsmetriken und die Modellleistung während YOLO26-Trainingssitzungen liefern können.
Für eine detailliertere Untersuchung dieser Funktionen und effektive Nutzungsstrategien können Sie die offizielle TensorBoard-Dokumentation von TensorFlow und deren GitHub-Repository konsultieren.
Möchten Sie mehr über die verschiedenen Integrationen von Ultralytics erfahren? Sehen Sie sich die Ultralytics-Integrationsleitfadenseite an, um zu sehen, welche anderen aufregenden Funktionen darauf warten, entdeckt zu werden!
FAQ
Welche Vorteile bietet die Verwendung von TensorBoard mit YOLO26?
Die Verwendung von TensorBoard mit YOLO26 bietet mehrere Visualisierungstools, die für ein effizientes Modelltraining unerlässlich sind:
- Echtzeit-Metrikverfolgung: Verfolgen Sie wichtige Metriken wie Verlust, Genauigkeit, Präzision und Recall live.
- Modellgraph-Visualisierung: Verstehen und debuggen Sie die Modellarchitektur, indem Sie Berechnungsgraphen visualisieren.
- Embedding-Visualisierung: Projizieren Sie Embeddings in niedrigere dimensionale Räume, um bessere Einblicke zu erhalten.
Diese Tools ermöglichen es Ihnen, fundierte Anpassungen vorzunehmen, um die Leistung Ihres YOLO26-Modells zu verbessern. Weitere Details zu den TensorBoard-Funktionen finden Sie im TensorFlow TensorBoard-Leitfaden.
Wie kann ich Trainingsmetriken mit TensorBoard überwachen, wenn ich ein YOLO26-Modell trainiere?
Um Trainingsmetriken während des Trainings eines YOLO26-Modells mit TensorBoard zu überwachen, befolgen Sie diese Schritte:
- Installieren Sie TensorBoard und YOLO26: Ausführen
pip install ultralyticseinschließlich TensorBoard. - TensorBoard-Logging konfigurieren: Während des Trainingsprozesses protokolliert YOLO26 Metriken in einem angegebenen Log-Verzeichnis.
- Starten Sie TensorBoard: Starten Sie TensorBoard mit dem Befehl
tensorboard --logdir path/to/your/tensorboard/logs.
Das TensorBoard-Dashboard, zugänglich über http://localhost:6006/, bietet Echtzeit-Einblicke in verschiedene Trainingsmetriken. Für einen tieferen Einblick in die Trainingskonfigurationen besuchen Sie unseren YOLO26 Konfigurationsleitfaden.
Welche Arten von Metriken kann ich mit TensorBoard visualisieren, wenn ich YOLO26-Modelle trainiere?
Beim Training von YOLO26-Modellen ermöglicht TensorBoard die Visualisierung einer Reihe wichtiger Metriken, darunter:
- Loss (Training und Validierung): Gibt an, wie gut das Modell während des Trainings und der Validierung funktioniert.
- Genauigkeit/Präzision/Recall: Wichtige Leistungsmetriken zur Bewertung der Erkennungsgenauigkeit.
- Lernrate: Verfolgen Sie Änderungen der Lernrate, um deren Auswirkungen auf die Trainingsdynamik zu verstehen.
- mAP (mean Average Precision): Für eine umfassende Bewertung der object detection-Genauigkeit bei verschiedenen IoU-Schwellenwerten.
Diese Visualisierungen sind unerlässlich, um die Modellleistung zu verfolgen und notwendige Optimierungen vorzunehmen. Weitere Informationen zu diesen Metriken finden Sie in unserem Leitfaden zu Leistungsmetriken.
Kann ich TensorBoard in einer Google Colab-Umgebung für das Training von YOLO26 verwenden?
Ja, Sie können TensorBoard in einer Google Colab-Umgebung verwenden, um YOLO26-Modelle zu trainieren. Hier ist eine schnelle Einrichtung:
Konfigurieren von TensorBoard für Google Colab
%load_ext tensorboard
%tensorboard --logdir path/to/runs
Führen Sie dann das YOLO26-Trainingsskript aus:
from ultralytics import YOLO

# Load a pretrained model
model = YOLO("yolo26n.pt")

# Train the model
results = model.train(data="coco8.yaml", epochs=100, imgsz=640)
TensorBoard visualisiert den Trainingsfortschritt innerhalb von Colab und liefert Echtzeit-Einblicke in Metriken wie Verlust (loss) und Genauigkeit (accuracy). Weitere Details zur Konfiguration des YOLO26-Trainings finden Sie in unserem detaillierten YOLO26 Installationsleitfaden.


