Gain Visual Insights with YOLO26's Integration with TensorBoard
Understanding and fine-tuning computer vision models like Ultralytics' YOLO26 becomes more straightforward when you take a closer look at their training processes. Model training visualization helps with getting insights into the model's learning patterns, performance metrics, and overall behavior. YOLO26's integration with TensorBoard makes this process of visualization and analysis easier and enables more efficient and informed adjustments to the model.
This guide covers how to use TensorBoard with YOLO26. You'll learn about various visualizations, from tracking metrics to analyzing model graphs. These tools will help you understand your YOLO26 model's performance better.
TensorBoard
TensorBoard, TensorFlow's visualization toolkit, is essential for machine learning experimentation. TensorBoard features a range of visualization tools, crucial for monitoring machine learning models. These tools include tracking key metrics like loss and accuracy, visualizing model graphs, and viewing histograms of weights and biases over time. It also provides capabilities for projecting embeddings to lower-dimensional spaces and displaying multimedia data.
YOLO26 Training with TensorBoard
Using TensorBoard while training YOLO26 models is straightforward and offers significant benefits.
Installation
To install the required package, run:
Installation
# Install the required package for YOLO26 and Tensorboard
pip install ultralytics
TensorBoard is conveniently pre-installed with YOLO26, eliminating the need for additional setup for visualization purposes.
For detailed instructions and best practices related to the installation process, be sure to check our YOLO26 Installation guide. While installing the required packages for YOLO26, if you encounter any difficulties, consult our Common Issues guide for solutions and tips.
Configuring TensorBoard for Google Colab
When using Google Colab, it's important to set up TensorBoard before starting your training code:
Configure TensorBoard for Google Colab
%load_ext tensorboard
%tensorboard --logdir path/to/runs
Usage
Before diving into the usage instructions, be sure to check out the range of YOLO26 models offered by Ultralytics. This will help you choose the most appropriate model for your project requirements.
Enable or Disable TensorBoard
By default, TensorBoard logging is disabled. You can enable or disable the logging by using the yolo settings command.
# Enable TensorBoard logging
yolo settings tensorboard=True

# Disable TensorBoard logging
yolo settings tensorboard=False
Usage
from ultralytics import YOLO

# Load a pretrained model
model = YOLO("yolo26n.pt")

# Train the model
results = model.train(data="coco8.yaml", epochs=100, imgsz=640)
Upon running the usage code snippet above, you can expect the following output:
TensorBoard: Start with 'tensorboard --logdir path_to_your_tensorboard_logs', view at http://localhost:6006/
This output indicates that TensorBoard is now actively monitoring your YOLO26 training session. You can access the TensorBoard dashboard by visiting the provided URL (http://localhost:6006/) to view real-time training metrics and model performance. For users working in Google Colab, the TensorBoard will be displayed in the same cell where you executed the TensorBoard configuration commands.
For more information related to the model training process, be sure to check our YOLO26 Model Training guide. If you are interested in learning more about logging, checkpoints, plotting, and file management, read our usage guide on configuration.
Understanding Your TensorBoard for YOLO26 Training
Now, let's focus on understanding the various features and components of TensorBoard in the context of YOLO26 training. The three key sections of the TensorBoard are Time Series, Scalars, and Graphs.
Time Series
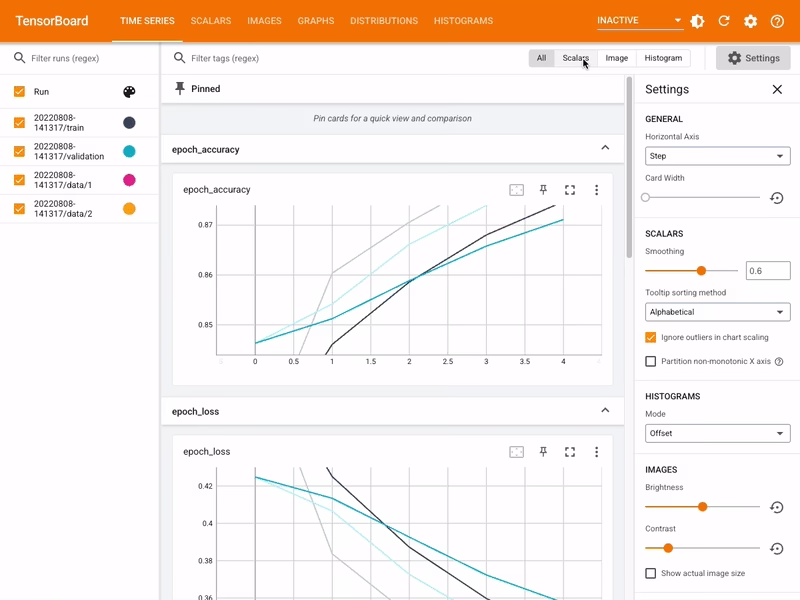
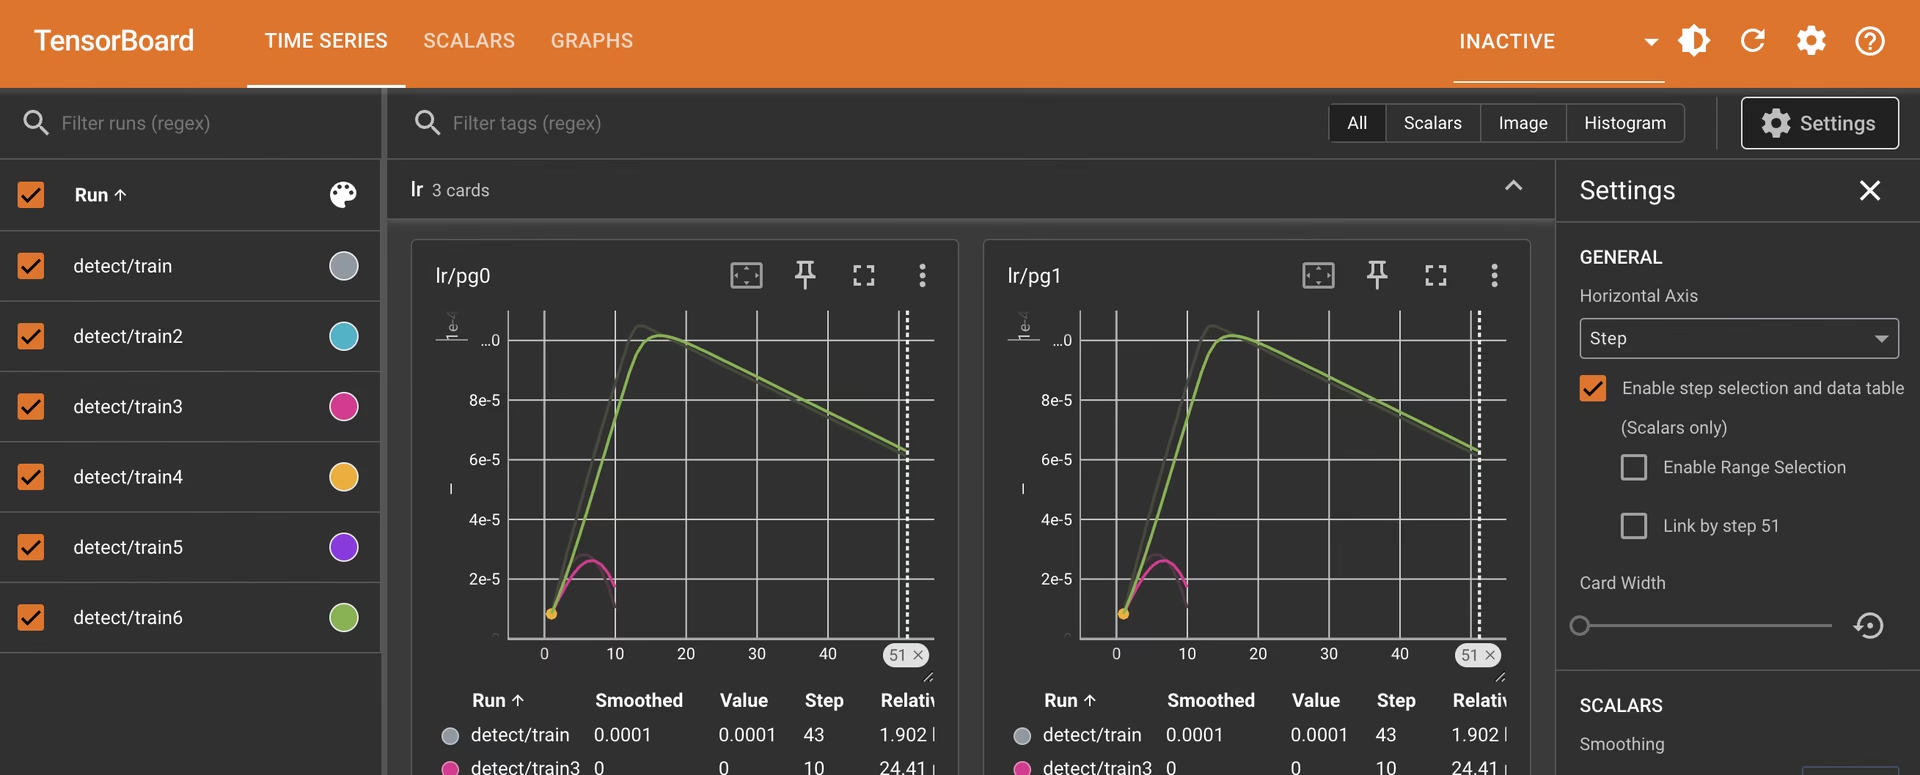
The Time Series feature in the TensorBoard offers a dynamic and detailed perspective of various training metrics over time for YOLO26 models. It focuses on the progression and trends of metrics across training epochs. Here's an example of what you can expect to see.
Key Features of Time Series in TensorBoard
Filter Tags and Pinned Cards: This functionality allows users to filter specific metrics and pin cards for quick comparison and access. It's particularly useful for focusing on specific aspects of the training process.
Detailed Metric Cards: Time Series divides metrics into different categories like learning rate (lr), training (train), and validation (val) metrics, each represented by individual cards.
Graphical Display: Each card in the Time Series section shows a detailed graph of a specific metric over the course of training. This visual representation aids in identifying trends, patterns, or anomalies in the training process.
In-Depth Analysis: Time Series provides an in-depth analysis of each metric. For instance, different learning rate segments are shown, offering insights into how adjustments in learning rate impact the model's learning curve.
Importance of Time Series in YOLO26 Training
The Time Series section is essential for a thorough analysis of the YOLO26 model's training progress. It lets you track the metrics in real time to promptly identify and solve issues. It also offers a detailed view of each metric's progression, which is crucial for fine-tuning the model and enhancing its performance.
Scalars
Scalars in the TensorBoard are crucial for plotting and analyzing simple metrics like loss and accuracy during the training of YOLO26 models. They offer a clear and concise view of how these metrics evolve with each training epoch, providing insights into the model's learning effectiveness and stability. Here's an example of what you can expect to see.
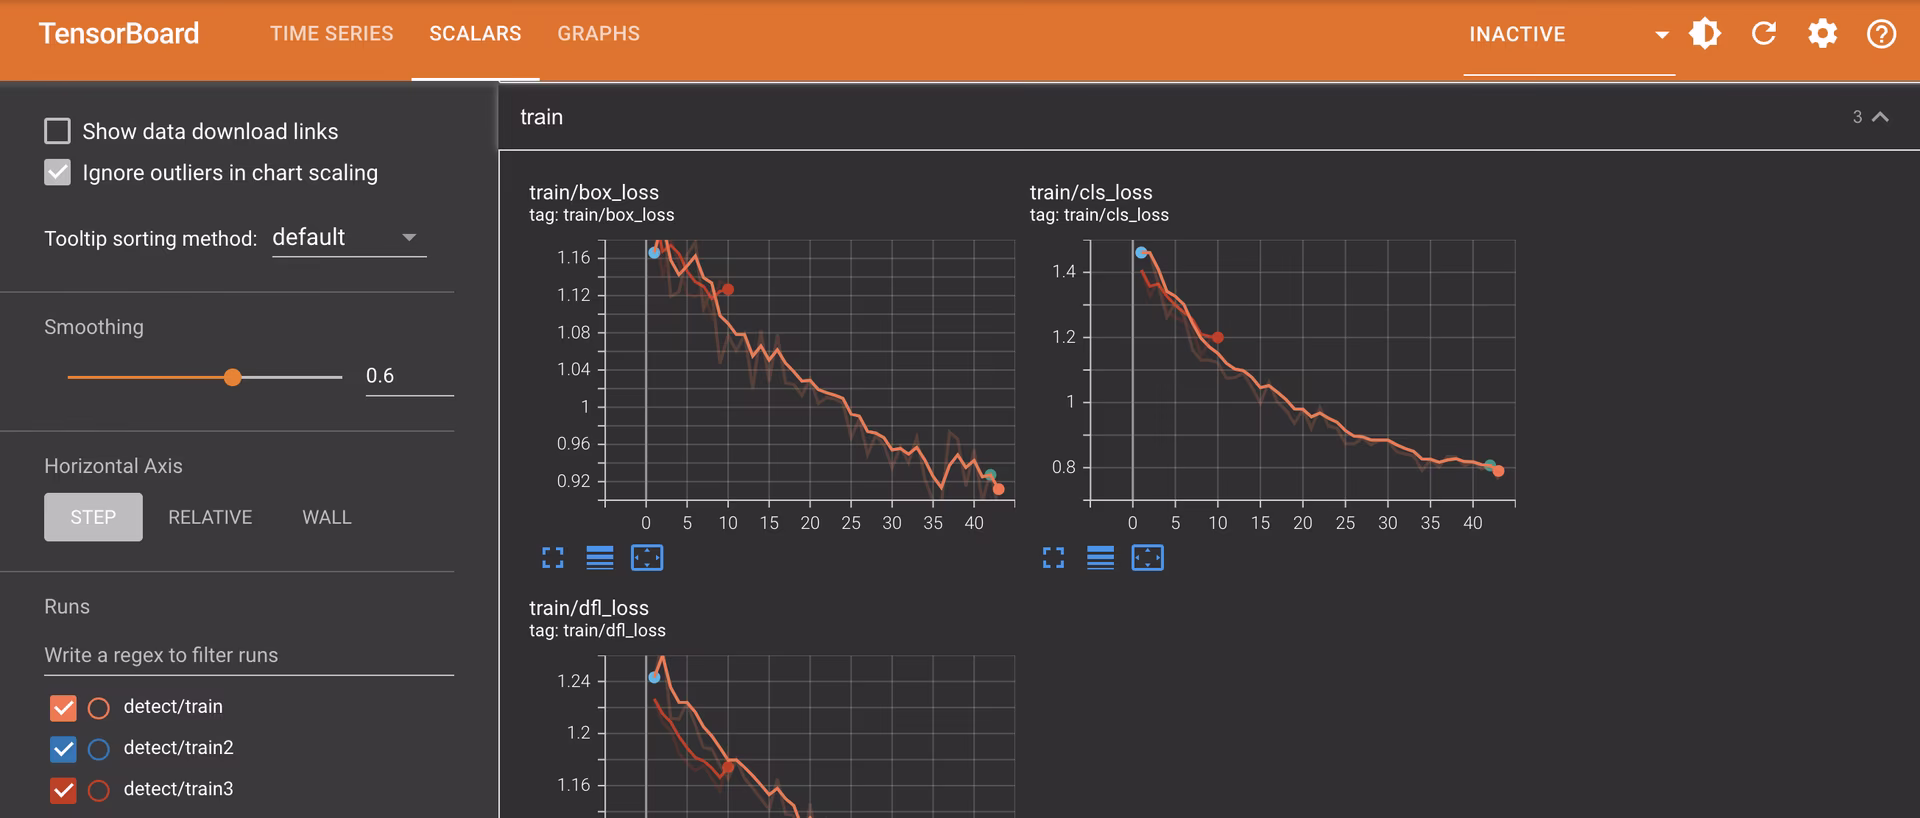
Key Features of Scalars in TensorBoard
Learning Rate (lr) Tags: These tags show the variations in the learning rate across different segments (e.g.,
pg0,pg1,pg2). This helps us understand the impact of learning rate adjustments on the training process.Metrics Tags: Scalars include performance indicators such as:
mAP50 (B): Mean Average Precision at 50% Intersection over Union (IoU), crucial for assessing object detection accuracy.mAP50-95 (B): Mean Average Precision calculated over a range of IoU thresholds, offering a more comprehensive evaluation of accuracy.Precision (B): Indicates the ratio of correctly predicted positive observations, key to understanding prediction accuracy.Recall (B): Important for models where missing a detection is significant, this metric measures the ability to detect all relevant instances.To learn more about the different metrics, read our guide on performance metrics.
Training and Validation Tags (
train,val): These tags display metrics specifically for the training and validation datasets, allowing for a comparative analysis of model performance across different data sets.
Importance of Monitoring Scalars
Observing scalar metrics is crucial for fine-tuning the YOLO26 model. Variations in these metrics, such as spikes or irregular patterns in loss graphs, can highlight potential issues such as overfitting, underfitting, or inappropriate learning rate settings. By closely monitoring these scalars, you can make informed decisions to optimize the training process, ensuring that the model learns effectively and achieves the desired performance.
Difference Between Scalars and Time Series
While both Scalars and Time Series in TensorBoard are used for tracking metrics, they serve slightly different purposes. Scalars focus on plotting simple metrics such as loss and accuracy as scalar values. They provide a high-level overview of how these metrics change with each training epoch. Meanwhile, the time-series section of the TensorBoard offers a more detailed timeline view of various metrics. It is particularly useful for monitoring the progression and trends of metrics over time, providing a deeper dive into the specifics of the training process.
Graphs
The Graphs section of the TensorBoard visualizes the computational graph of the YOLO26 model, showing how operations and data flow within the model. It's a powerful tool for understanding the model's structure, ensuring that all layers are connected correctly, and for identifying any potential bottlenecks in data flow. Here's an example of what you can expect to see.
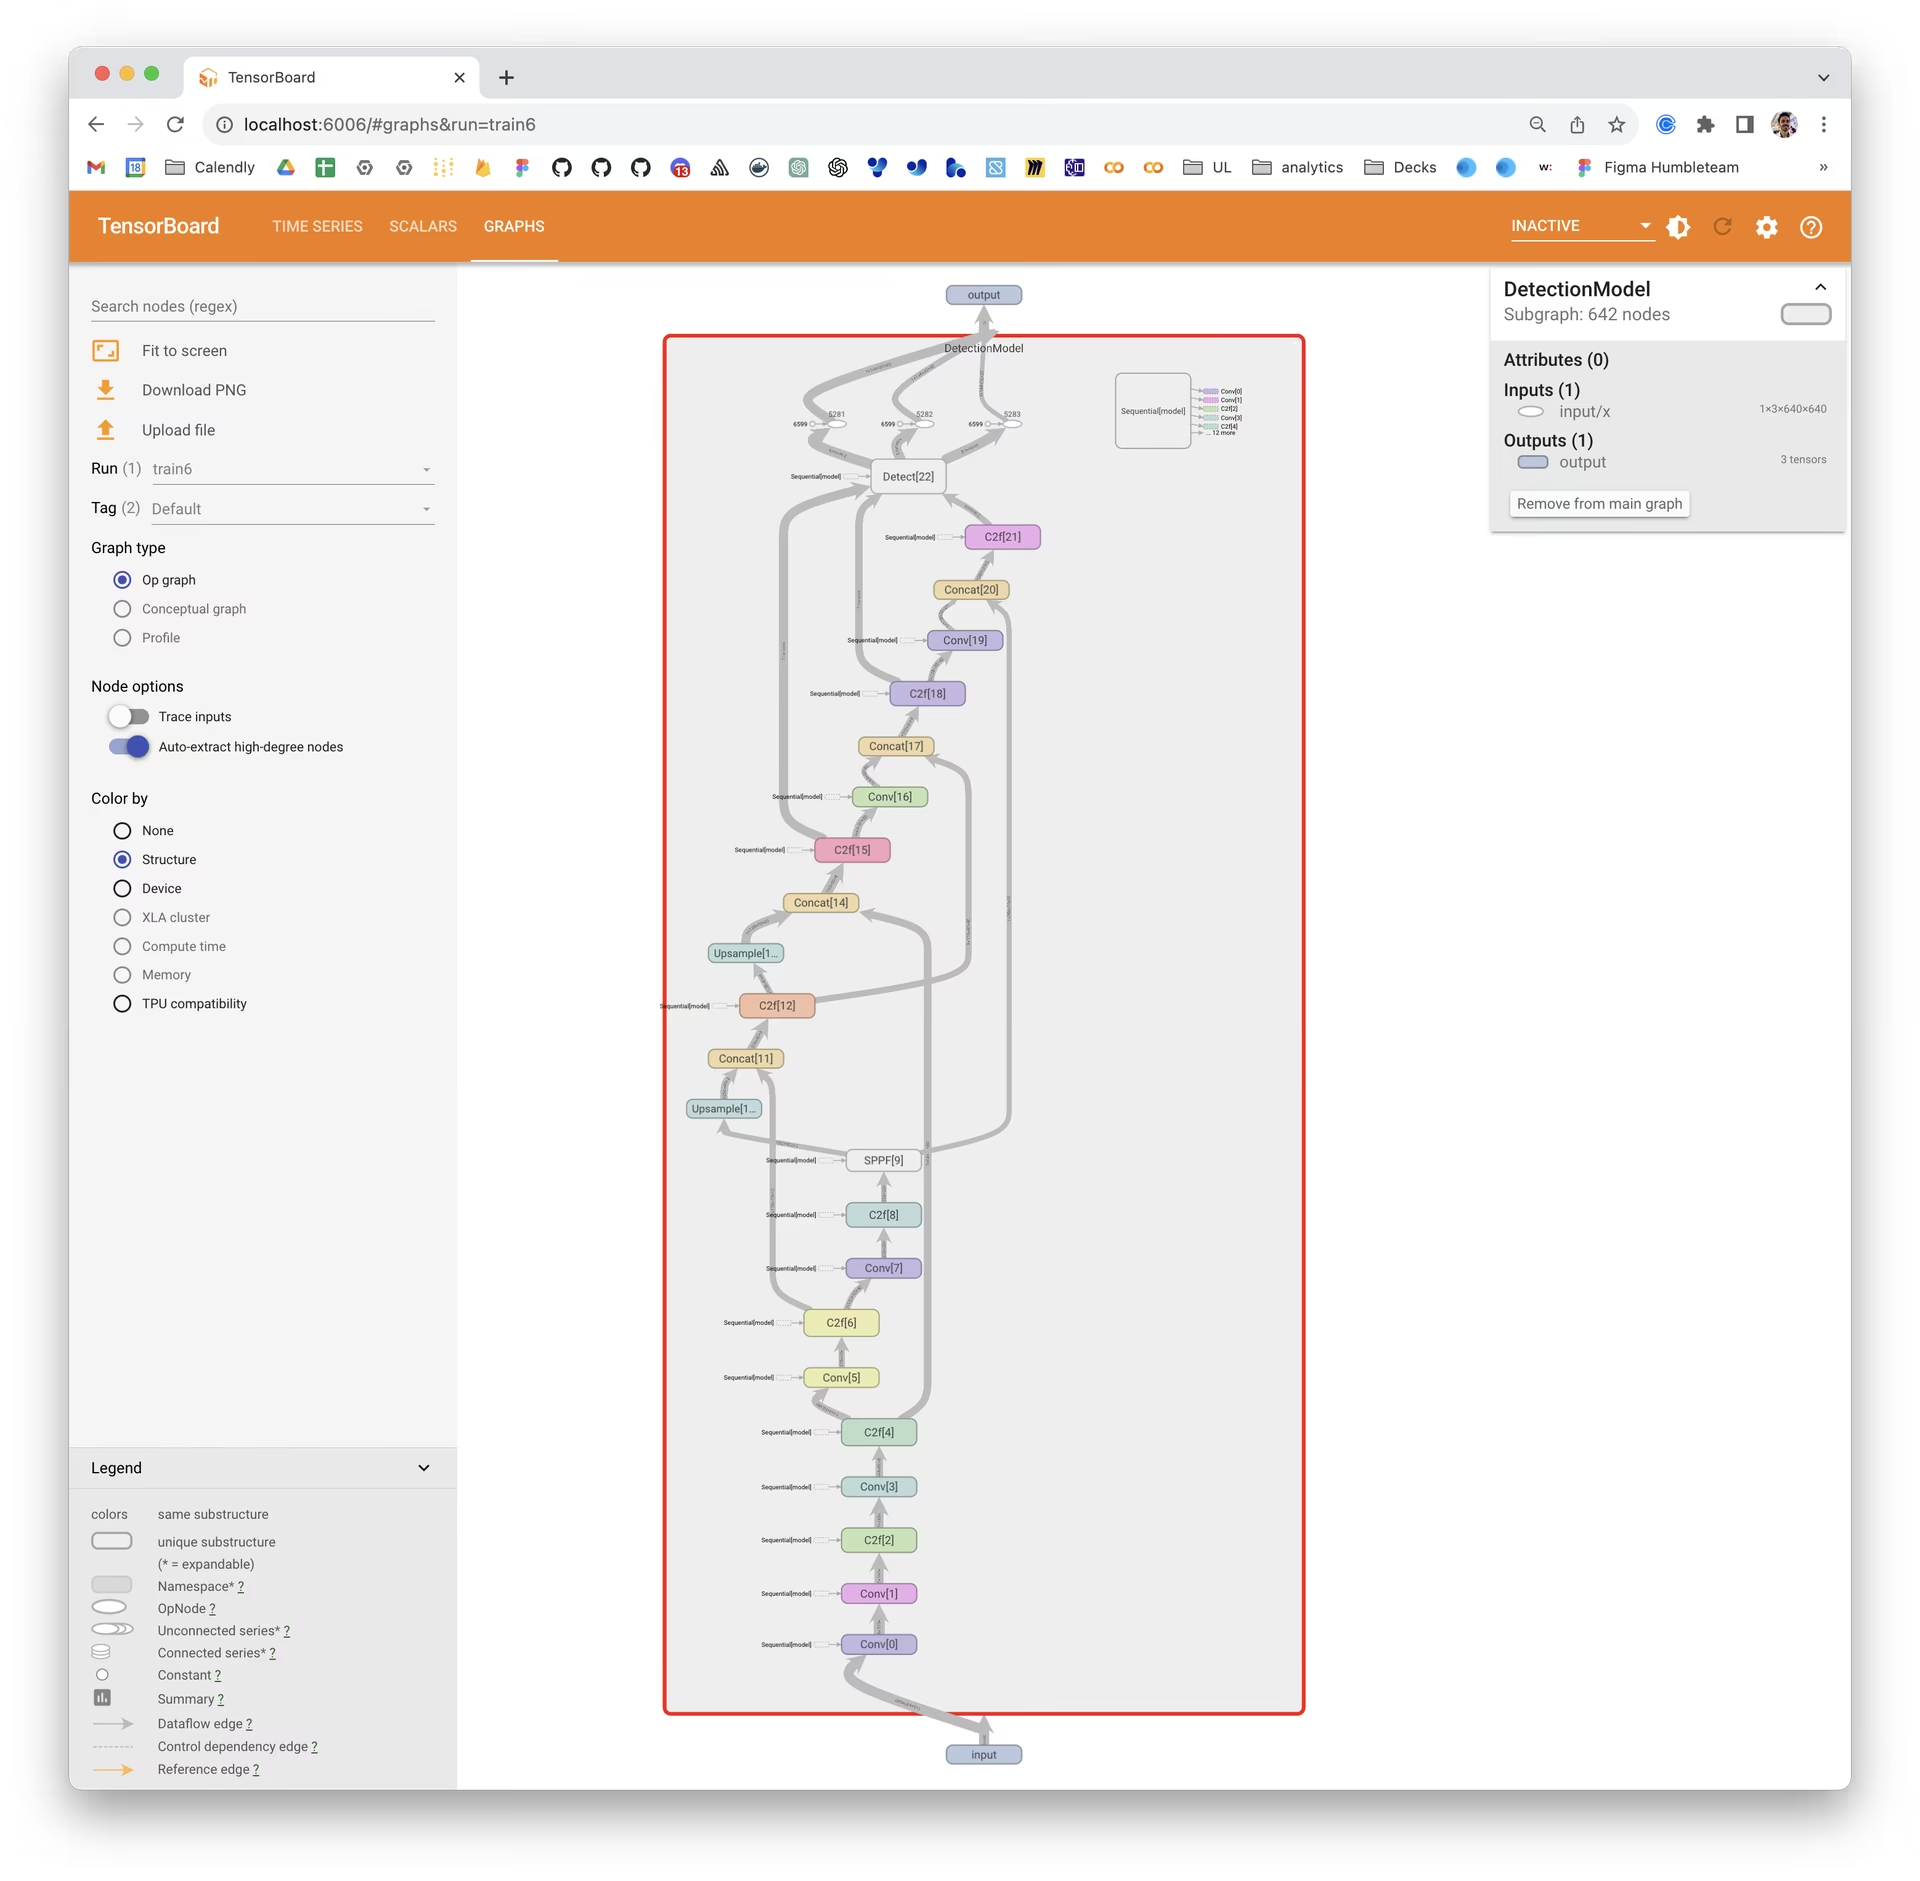
Graphs are particularly useful for debugging the model, especially in complex architectures typical in deep learning models like YOLO26. They help in verifying layer connections and the overall design of the model.
Summary
This guide aims to help you use TensorBoard with YOLO26 for visualization and analysis of machine learning model training. It focuses on explaining how key TensorBoard features can provide insights into training metrics and model performance during YOLO26 training sessions.
For a more detailed exploration of these features and effective utilization strategies, you can refer to TensorFlow's official TensorBoard documentation and their GitHub repository.
Want to learn more about the various integrations of Ultralytics? Check out the Ultralytics integrations guide page to see what other exciting capabilities are waiting to be discovered!
FAQ
What benefits does using TensorBoard with YOLO26 offer?
Using TensorBoard with YOLO26 provides several visualization tools essential for efficient model training:
- Real-Time Metrics Tracking: Track key metrics such as loss, accuracy, precision, and recall live.
- Model Graph Visualization: Understand and debug the model architecture by visualizing computational graphs.
- Embedding Visualization: Project embeddings to lower-dimensional spaces for better insight.
These tools enable you to make informed adjustments to enhance your YOLO26 model's performance. For more details on TensorBoard features, check out the TensorFlow TensorBoard guide.
How can I monitor training metrics using TensorBoard when training a YOLO26 model?
To monitor training metrics while training a YOLO26 model with TensorBoard, follow these steps:
- Install TensorBoard and YOLO26: Run
pip install ultralyticswhich includes TensorBoard. - Configure TensorBoard Logging: During the training process, YOLO26 logs metrics to a specified log directory.
- Start TensorBoard: Launch TensorBoard using the command
tensorboard --logdir path/to/your/tensorboard/logs.
The TensorBoard dashboard, accessible via http://localhost:6006/, provides real-time insights into various training metrics. For a deeper dive into training configurations, visit our YOLO26 Configuration guide.
What kind of metrics can I visualize with TensorBoard when training YOLO26 models?
When training YOLO26 models, TensorBoard allows you to visualize an array of important metrics including:
- Loss (Training and Validation): Indicates how well the model is performing during training and validation.
- Accuracy/Precision/Recall: Key performance metrics to evaluate detection accuracy.
- Learning Rate: Track learning rate changes to understand its impact on training dynamics.
- mAP (mean Average Precision): For a comprehensive evaluation of object detection accuracy at various IoU thresholds.
These visualizations are essential for tracking model performance and making necessary optimizations. For more information on these metrics, refer to our Performance Metrics guide.
Can I use TensorBoard in a Google Colab environment for training YOLO26?
Yes, you can use TensorBoard in a Google Colab environment to train YOLO26 models. Here's a quick setup:
Configure TensorBoard for Google Colab
%load_ext tensorboard
%tensorboard --logdir path/to/runs
Then, run the YOLO26 training script:
from ultralytics import YOLO

# Load a pretrained model
model = YOLO("yolo26n.pt")

# Train the model
results = model.train(data="coco8.yaml", epochs=100, imgsz=640)
TensorBoard will visualize the training progress within Colab, providing real-time insights into metrics like loss and accuracy. For additional details on configuring YOLO26 training, see our detailed YOLO26 Installation guide.


