Approfondimenti sulla valutazione e la messa a punto del modello
Introduzione
Una volta addestrato il tuo modello di computer vision, è essenziale valutarlo e perfezionarlo per ottenere prestazioni ottimali. Non è sufficiente solo addestrare il tuo modello. Devi assicurarti che il tuo modello sia accurato, efficiente e soddisfi l'obiettivo del tuo progetto di computer vision. Valutando e ottimizzando il tuo modello, puoi identificare i punti deboli, migliorarne l'accuratezza e aumentare le prestazioni complessive.
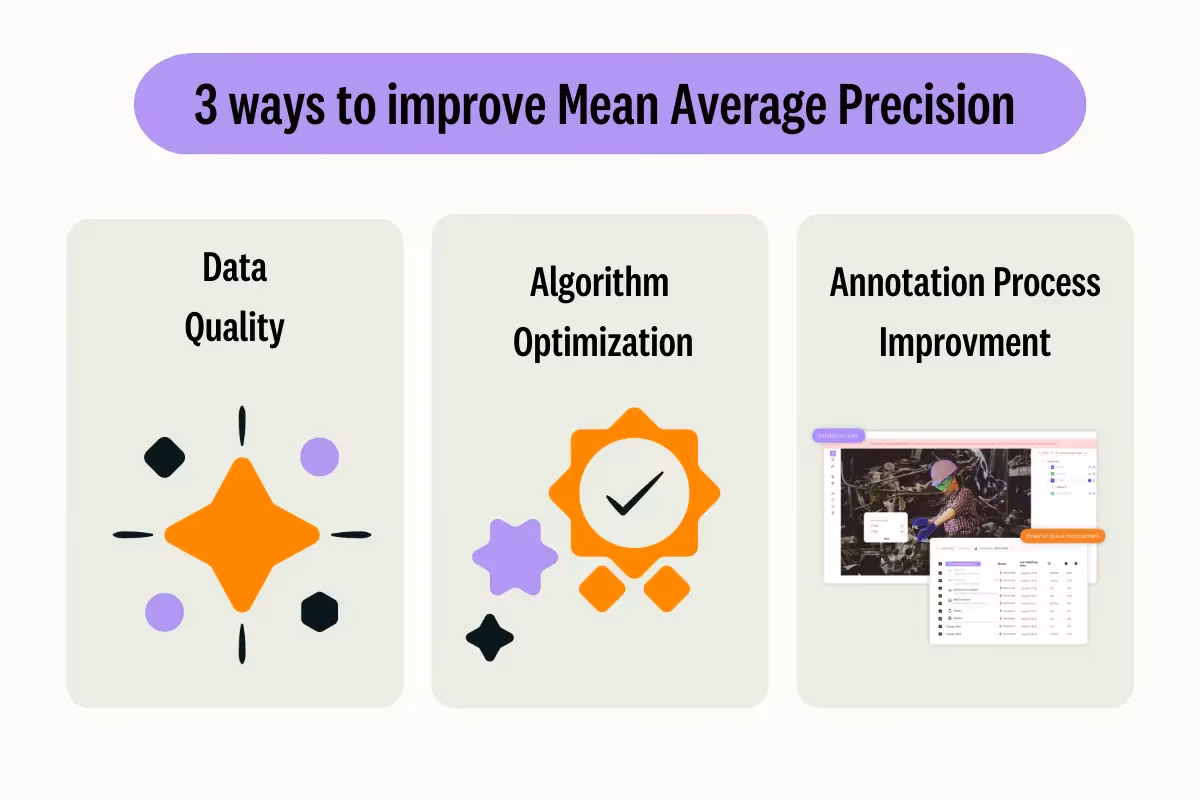
Guarda: Approfondimenti sulla valutazione e la messa a punto del modello | Suggerimenti per migliorare la precisione media media
In questa guida, condividiamo approfondimenti sulla valutazione del modello e sul fine-tuning per rendere questo passaggio di un progetto di visione artificiale più accessibile. Discutiamo come comprendere le metriche di valutazione e implementare tecniche di fine-tuning, fornendoti le conoscenze necessarie per elevare le capacità del tuo modello.
Valutazione delle prestazioni del modello tramite metriche
Valutare le prestazioni di un modello ci aiuta a capire quanto funziona efficacemente. Vengono utilizzate varie metriche per misurare le prestazioni. Queste metriche di performance forniscono informazioni chiare e numeriche che possono guidare i miglioramenti per garantire che il modello soddisfi i suoi obiettivi previsti. Diamo un'occhiata più da vicino ad alcune metriche chiave.
Punteggio di confidenza
Il punteggio di confidenza rappresenta la certezza del modello che un oggetto rilevato appartenga a una particolare classe. Varia da 0 a 1, con punteggi più alti che indicano una maggiore confidenza. Il punteggio di confidenza aiuta a filtrare le previsioni; vengono considerati validi solo i rilevamenti con punteggi di confidenza superiori a una soglia specificata.
Suggerimento rapido: Quando esegui inferenze, se non vedi alcuna previsione e hai controllato tutto il resto, prova a ridurre il punteggio di confidenza. A volte, la soglia è troppo alta, il che fa sì che il modello ignori le previsioni valide. Abbassare il punteggio consente al modello di considerare più possibilità. Questo potrebbe non soddisfare gli obiettivi del tuo progetto, ma è un buon modo per vedere cosa può fare il modello e decidere come metterlo a punto.
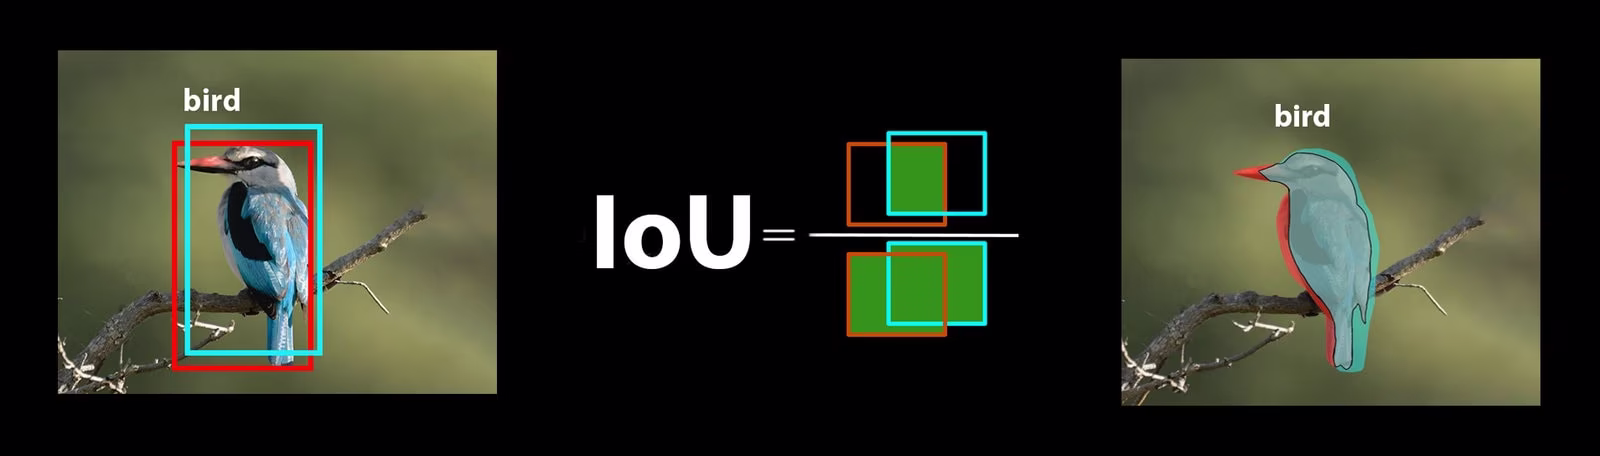
Intersezione sull'Unione
L'Intersection over Union (IoU) è una metrica nell'object detection che misura quanto bene il bounding box previsto si sovrappone al bounding box della verità di base. I valori di IoU variano da 0 a 1, dove uno rappresenta una corrispondenza perfetta. IoU è essenziale perché misura quanto strettamente i confini previsti corrispondono ai confini effettivi dell'oggetto.
Precisione Media Aritmetica Media
Precisione Media Media (mAP) è un modo per misurare le prestazioni di un modello di object detection. Considera la precisione nel rilevamento di ogni classe di oggetti, calcola la media di questi punteggi e fornisce un numero complessivo che indica con quanta accuratezza il modello è in grado di identificare e classify gli oggetti.
Concentriamoci su due metriche mAP specifiche:
- mAP@.5: Misura la precisione media a una singola soglia di IoU (Intersection over Union) di 0.5. Questa metrica verifica se il modello riesce a detect correttamente gli oggetti con un requisito di accuratezza meno stringente. Si concentra sul fatto che l'oggetto si trovi approssimativamente nel posto giusto, senza necessità di un posizionamento perfetto. Aiuta a capire se il modello è generalmente bravo a individuare gli oggetti.
- mAP@.5:.95: Calcola la media dei valori di mAP calcolati a diverse soglie di IoU, da 0.5 a 0.95 con incrementi di 0.05. Questa metrica è più dettagliata e rigorosa. Fornisce un quadro più completo di quanto accuratamente il modello riesca a detect gli oggetti a diversi livelli di rigore ed è particolarmente utile per le applicazioni che necessitano di una object detection precisa.
Altre metriche mAP includono mAP@0.75, che utilizza una soglia IoU più rigida di 0.75, e mAP@small, medium e large, che valutano la precisione su oggetti di diverse dimensioni.
Valutazione delle prestazioni del modello YOLO26
Per quanto riguarda YOLO26, puoi utilizzare la modalità di validazione per valutare il modello. Inoltre, assicurati di consultare la nostra guida che approfondisce le metriche di performance di YOLO26 e come possono essere interpretate.
Domande frequenti della community
Quando si valuta il modello YOLO26, potresti incontrare qualche intoppo. Basandosi su domande comuni della community, ecco alcuni suggerimenti per aiutarti a ottenere il massimo dal tuo modello YOLO26:
Gestione di dimensioni variabili delle immagini
Valutare il modello YOLO26 con immagini di diverse dimensioni può aiutarti a comprenderne le prestazioni su dataset diversi. Utilizzando il rect=true parametro validation, YOLO26 regola lo stride della rete per ogni batch in base alle dimensioni delle immagini, consentendo al modello di gestire immagini rettangolari senza forzarle a una singola dimensione.
Il imgsz Il parametro di validazione imposta la dimensione massima per il ridimensionamento delle immagini, che è di 640 per impostazione predefinita. È possibile regolarlo in base alle dimensioni massime del set di dati e alla memoria GPU disponibile. Anche con il imgsz imposta, rect=true consente al modello di gestire efficacemente le diverse dimensioni delle immagini regolando dinamicamente lo stride.
Accesso alle metriche di YOLO26
Se desideri una comprensione più approfondita delle prestazioni del tuo modello YOLO26, puoi accedere facilmente a metriche di valutazione specifiche con poche righe di codice python. Il frammento di codice seguente ti permetterà di caricare il modello, eseguire una valutazione e stampare varie metriche che mostrano quanto bene sta performando il modello.
Utilizzo
from ultralytics import YOLO

# Load the model
model = YOLO("yolo26n.pt")

# Run the evaluation
results = model.val(data="coco8.yaml")

# Print specific metrics
print("Class indices with average precision:", results.ap_class_index)
print("Average precision for all classes:", results.box.all_ap)
print("Average precision:", results.box.ap)
print("Average precision at IoU=0.50:", results.box.ap50)
print("Class indices for average precision:", results.box.ap_class_index)
print("Class-specific results:", results.box.class_result)
print("F1 score:", results.box.f1)
print("F1 score curve:", results.box.f1_curve)
print("Overall fitness score:", results.box.fitness)
print("Mean average precision:", results.box.map)
print("Mean average precision at IoU=0.50:", results.box.map50)
print("Mean average precision at IoU=0.75:", results.box.map75)
print("Mean average precision for different IoU thresholds:", results.box.maps)
print("Mean results for different metrics:", results.box.mean_results)
print("Mean precision:", results.box.mp)
print("Mean recall:", results.box.mr)
print("Per-image metrics:", results.box.image_metrics)
print("Precision:", results.box.p)
print("Precision curve:", results.box.p_curve)
print("Precision values:", results.box.prec_values)
print("Specific precision metrics:", results.box.px)
print("Recall:", results.box.r)
print("Recall curve:", results.box.r_curve)
L'oggetto dei risultati include inoltre image_metrics, un dizionario per immagine con chiave costituita dal nome del file dell'immagine e con precision,
recall, f1, tp, fp, e fn, oltre a metriche relative alla velocità quali il tempo di pre-elaborazione, il tempo di inferenza, la perdita e
il tempo di post-elaborazione. Analizzando queste metriche, è possibile mettere a punto e ottimizzare il modello YOLO26 per ottenere prestazioni migliori,
rendendolo più efficace per il proprio caso d'uso specifico.
Come funziona il Fine-Tuning?
Il fine-tuning implica l'utilizzo di un modello pre-addestrato e la regolazione dei suoi parametri per migliorarne le prestazioni su un compito o un dataset specifico. Il processo, noto anche come riaddestramento del modello, consente al modello di comprendere e prevedere meglio i risultati per i dati specifici che incontrerà nelle applicazioni del mondo reale. È possibile riaddestrare il modello basandosi sulla sua valutazione per ottenere risultati ottimali.
Suggerimenti per la messa a punto del modello
Il fine-tuning di un modello significa prestare molta attenzione a diversi parametri e tecniche vitali per ottenere prestazioni ottimali. Ecco alcuni suggerimenti essenziali per guidarti attraverso il processo.
Iniziare con un Learning Rate più alto
Solitamente, durante le epoche di addestramento iniziali, il learning rate inizia basso e aumenta gradualmente per stabilizzare il processo di addestramento. Tuttavia, poiché il tuo modello ha già appreso alcune caratteristiche dal set di dati precedente, iniziare subito con un learning rate più alto può essere più vantaggioso.
Quando si valuta il modello YOLO26, è possibile impostare il warmup_epochs parametro di validazione a warmup_epochs=0 per evitare che il tasso di apprendimento inizi troppo basso. Seguendo questo processo, l'addestramento continuerà dai pesi forniti, adattandosi alle sfumature dei nuovi dati.
Affiancamento delle immagini per oggetti di piccole dimensioni
La suddivisione delle immagini (image tiling) può migliorare l'accuratezza del detect per oggetti piccoli. Dividendo immagini più grandi in segmenti più piccoli, come suddividere immagini 1280x1280 in più segmenti 640x640, si mantiene la risoluzione originale e il modello può apprendere da frammenti ad alta risoluzione. Quando si utilizza YOLO26, assicurati di regolare correttamente le etichette per questi nuovi segmenti.
Interagisci con la Community
Condividere le tue idee e domande con altri appassionati di computer vision può ispirare soluzioni creative ai problemi nei tuoi progetti. Ecco alcuni modi eccellenti per imparare, risolvere problemi e connettersi.
Ricerca di Aiuto e Supporto
- Problemi GitHub: Esplora il repository GitHub di YOLO26 e utilizza la scheda Issues per porre domande, segnalare bug e suggerire funzionalità. La community e i manutentori sono disponibili per assisterti con qualsiasi problema tu possa incontrare.
- Server Discord di Ultralytics: unisciti al server Discord di Ultralytics per entrare in contatto con altri utenti e sviluppatori, ottenere supporto, condividere conoscenze e fare brainstorming di idee.
Documentazione ufficiale
- Documentazione Ultralytics YOLO26: Consulta la documentazione ufficiale di YOLO26 per guide complete e approfondimenti preziosi su vari compiti e progetti di visione artificiale.
Considerazioni finali
La valutazione e la messa a punto del tuo modello di computer vision sono passaggi importanti per una distribuzione del modello di successo. Questi passaggi aiutano a garantire che il tuo modello sia accurato, efficiente e adatto alla tua applicazione complessiva. La chiave per addestrare il miglior modello possibile è la sperimentazione e l'apprendimento continui. Non esitare a modificare i parametri, provare nuove tecniche ed esplorare diversi set di dati. Continua a sperimentare e a spingere i confini di ciò che è possibile!
FAQ
Quali sono le metriche chiave per valutare le prestazioni del modello YOLO26?
Per valutare le prestazioni del modello YOLO26, le metriche importanti includono il Punteggio di Confidenza (Confidence Score), l'Intersection over Union (IoU) e la Mean Average Precision (mAP). Il Punteggio di Confidenza misura la certezza del modello per ogni classe di oggetti detect. L'IoU valuta quanto bene il bounding box previsto si sovrappone al ground truth. La Mean Average Precision (mAP) aggrega i punteggi di precisione tra le classi, con mAP@.5 e mAP@.5:.95 che sono due tipi comuni per diverse soglie di IoU. Scopri di più su queste metriche nella nostra guida alle metriche di performance di YOLO26.
Come posso mettere a punto un modello YOLO26 pre-addestrato per il mio dataset specifico?
La messa a punto di un modello YOLO26 pre-addestrato comporta la regolazione dei suoi parametri per migliorare le prestazioni su un compito o un dataset specifico. Inizia valutando il tuo modello utilizzando le metriche, quindi imposta un tasso di apprendimento iniziale più elevato regolando il warmup_epochs parametro a 0 per una stabilità immediata. Utilizzare parametri come rect=true per gestire efficacemente dimensioni variabili delle immagini. Per una guida più dettagliata, fare riferimento alla nostra sezione su messa a punto dei modelli YOLO26.
Come posso gestire dimensioni di immagine variabili quando valuto il mio modello YOLO26?
Per gestire dimensioni variabili delle immagini durante la valutazione, usa il parametro rect=true parametro in YOLO26, che regola lo stride della rete per ogni batch in base alle dimensioni delle immagini. Il imgsz parametro imposta la dimensione massima per il ridimensionamento dell'immagine, di default a 640. Regola imgsz per adattarsi al tuo dataset e alla memoria della GPU. Per maggiori dettagli, visita la nostra sezione sezione sulla gestione di dimensioni variabili delle immagini.
Quali passaggi pratici posso intraprendere per migliorare la mean average precision per il mio modello YOLO26?
Migliorare la mean average precision (mAP) per un modello YOLO26 comporta diversi passaggi:
- Ottimizzazione degli iperparametri: Sperimenta con diversi tassi di apprendimento, dimensioni dei batch e aumenti delle immagini.
- Aumento dei dati: Utilizza tecniche come Mosaic e MixUp per creare diversi campioni di training.
- Image Tiling: Dividi le immagini più grandi in tile più piccoli per migliorare l'accuratezza della detect per oggetti piccoli. Consulta la nostra guida dettagliata sul fine-tuning del modello per strategie specifiche.
Come accedo alle metriche di valutazione del modello YOLO26 in python?
È possibile accedere alle metriche di valutazione del modello YOLO26 utilizzando Python seguendo questi passaggi:
Utilizzo
from ultralytics import YOLO

# Load the model
model = YOLO("yolo26n.pt")

# Run the evaluation
results = model.val(data="coco8.yaml")

# Print specific metrics
print("Class indices with average precision:", results.ap_class_index)
print("Average precision for all classes:", results.box.all_ap)
print("Mean average precision at IoU=0.50:", results.box.map50)
print("Mean recall:", results.box.mr)
L'analisi di queste metriche aiuta a mettere a punto e ottimizzare il modello YOLO26. Per un approfondimento, consulta la nostra guida sulle metriche di YOLO26.


