DVCLiveによる高度なYOLO26実験track
機械学習における実験の追跡は、モデルの開発と評価にとって非常に重要です。これには、多数のトレーニング実行からのさまざまなパラメータ、メトリクス、および結果の記録と分析が含まれます。このプロセスは、モデルのパフォーマンスを理解し、データに基づいた意思決定を行ってモデルを改良および最適化するために不可欠です。
DVCLiveとUltralytics YOLO26の統合は、実験のtrackと管理の方法を変革します。この統合により、主要な実験詳細の自動ログ記録、異なる実行間での結果比較、詳細な分析のためのデータ可視化をシームレスに行うことができます。このガイドでは、DVCLiveを使用してプロセスを効率化する方法を理解します。
DVCLive
DVCによって開発されたDVCLiveは、機械学習における実験追跡のための革新的なオープンソースツールです。GitおよびDVCとシームレスに統合し、モデルパラメータやトレーニングメトリクスなどの重要な実験データのロギングを自動化します。シンプルさを追求して設計されたDVCLiveは、複数の実行の容易な比較と分析を可能にし、直感的なデータ視覚化および分析ツールを使用して、機械学習プロジェクトの効率を高めます。
DVCLiveを使用したYOLO26学習
YOLO26のトレーニングセッションはDVCLiveで効果的に監視できます。さらに、DVCはこれらの実験を視覚化するための不可欠な機能を提供し、trackされたすべての実験にわたるメトリックプロットの比較を可能にするレポートの生成を含め、トレーニングプロセスを包括的に把握できます。
インストール
必要なパッケージをインストールするには、以下を実行します:
インストール
# Install the required packages for YOLO26 and DVCLive
pip install ultralytics dvclive
インストールプロセスに関する詳細な手順とベストプラクティスについては、弊社のYOLO26インストールガイドを必ずご確認ください。YOLO26に必要なパッケージをインストールする際に問題が発生した場合は、解決策とヒントについては、弊社のよくある問題ガイドを参照してください。
DVCLiveの設定
必要なパッケージをインストールしたら、次のステップは、必要な認証情報を使用して環境をセットアップおよび構成することです。このセットアップにより、DVCLiveが既存のワークフローにスムーズに統合されます。
Gitリポジトリを初期化することから始めましょう。Gitは、コードとDVCLive構成の両方のバージョン管理において重要な役割を果たします。
初期環境設定
# Initialize a Git repository
git init -q

# Configure Git with your details
git config --local user.email "you@example.com"
git config --local user.name "Your Name"

# Initialize DVCLive in your project
dvc init -q

# Commit the DVCLive setup to your Git repository
git commit -m "DVC init"
これらのコマンドでは、「you@example.com」をご自身のGitアカウントに関連付けられたメールアドレスに、「Your Name」はGitアカウントのユーザー名に必ず置き換えてください。
使用法
使用方法の説明に入る前に、Ultralyticsが提供するYOLO26モデルのラインナップを必ずご確認ください。これにより、プロジェクトの要件に最も適したモデルを選択できます。
DVCLiveを使用したYOLO26モデルの学習
まずYOLO26のトレーニングセッションを実行します。プロジェクトのニーズに合わせて、さまざまなモデル構成とトレーニングパラメータを使用できます。例:
# Example training commands for YOLO26 with varying configurations
yolo train model=yolo26n.pt data=coco8.yaml epochs=5 imgsz=512
yolo train model=yolo26n.pt data=coco8.yaml epochs=5 imgsz=640
モデル、データ、エポック、およびimgszパラメータを特定の要件に合わせて調整してください。モデルのトレーニングプロセスとベストプラクティスを詳細に理解するには、弊社のYOLO26モデルトレーニングガイドを参照してください。
DVCLiveを使用した実験の監視
DVCLiveは、主要なメトリックのtrackと視覚化を可能にすることで、トレーニングプロセスを強化します。インストールすると、Ultralytics YOLO26は実験のtrackのためにDVCLiveと自動的に統合され、これにより、後でパフォーマンスの洞察を得るために分析できます。トレーニング中に使用される特定のパフォーマンスメトリックを包括的に理解するには、パフォーマンスメトリックに関する詳細ガイドを必ずご確認ください。
結果の分析
YOLO26のトレーニングセッションが完了したら、DVCLiveの強力な視覚化ツールを活用して、結果を詳細に分析できます。DVCLiveの統合により、すべてのトレーニングメトリックが体系的にログに記録され、モデルのパフォーマンスの包括的な評価が容易になります。
分析を開始するには、DVCのAPIを使用して実験データを抽出し、Pandasで処理することで、より簡単に扱って視覚化できます:
import dvc.api
import pandas as pd

# Define the columns of interest
columns = ["Experiment", "epochs", "imgsz", "model", "metrics.mAP50-95(B)"]

# Retrieve experiment data
df = pd.DataFrame(dvc.api.exp_show(), columns=columns)

# Clean the data
df.dropna(inplace=True)
df.reset_index(drop=True, inplace=True)

# Display the DataFrame
print(df)
上記のコードスニペットの出力は、YOLO26モデルで実施されたさまざまな実験の明確な表形式ビューを提供します。各行は異なるトレーニング実行を表し、実験名、エポック数、画像サイズ (imgsz)、使用された特定のモデル、およびmAP50-95(B)メトリックを詳細に示します。このメトリックはモデルの精度を評価するために重要であり、値が高いほどパフォーマンスが優れていることを示します。
Plotlyによる結果の可視化
実験結果をよりインタラクティブかつ視覚的に分析するには、Plotlyの平行座標プロットを使用できます。このタイプのプロットは、異なるパラメータとメトリクスの関係やトレードオフを理解するのに特に役立ちます。
from plotly.express import parallel_coordinates

# Create a parallel coordinates plot
fig = parallel_coordinates(df, columns, color="metrics.mAP50-95(B)")

# Display the plot
fig.show()
上記のコードスニペットの出力は、エポック、画像サイズ、モデルタイプ、およびそれらに対応するmAP50-95(B)スコア間の関係を視覚的に表現するプロットを生成し、これにより、実験データ内の傾向やパターンを特定できます。
DVCを使用した比較視覚化の生成
DVCは、実験の比較プロットを生成するのに役立つコマンドを提供します。これは、さまざまなトレーニング実行における異なるモデルのパフォーマンスを比較するのに特に役立ちます。
# Generate DVC comparative plots
dvc plots diff $(dvc exp list --names-only)
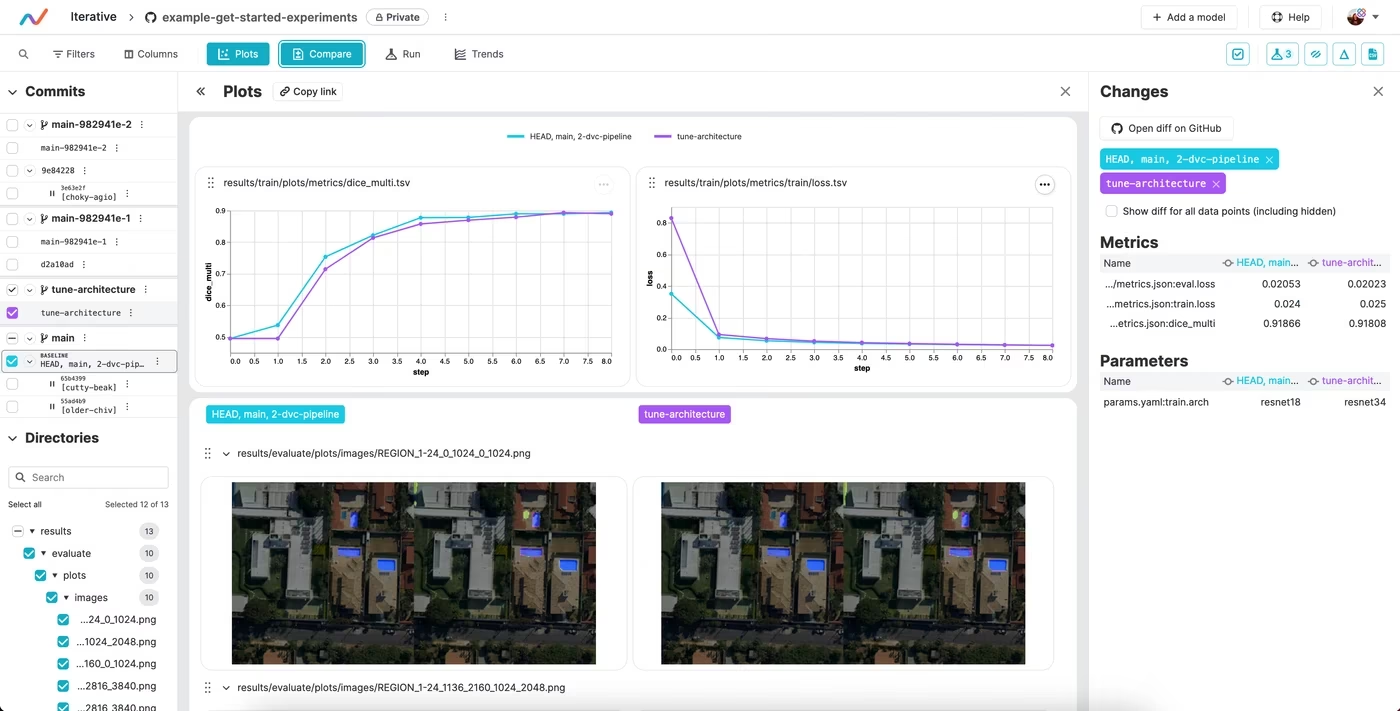
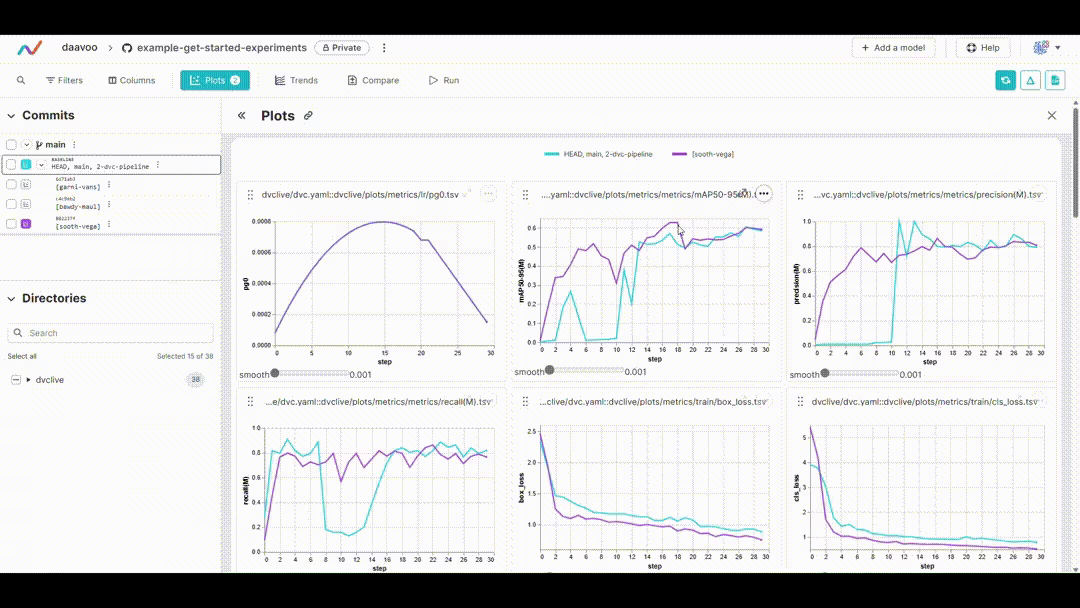
このコマンドを実行すると、DVCは異なる実験間のメトリックを比較するプロットを生成し、これらはHTMLファイルとして保存されます。以下に、このプロセスによって生成される典型的なプロットを示す画像例を示します。この画像は、mAP、リコール、精度、損失値などを表すさまざまなグラフを示しており、主要なパフォーマンスメトリックの視覚的な概要を提供します:
DVCプロットの表示
Jupyter Notebookを使用している場合に、生成されたDVCプロットを表示するには、IPythonの表示機能を使用できます。
from IPython.display import HTML

# Display the DVC plots as HTML
HTML(filename="./dvc_plots/index.html")
このコードは、DVCプロットを含むHTMLファイルをJupyter Notebookに直接レンダリングし、視覚化された実験データを簡単かつ便利に分析する方法を提供します。
データ駆動型の意思決定
これらの視覚化から得られた洞察を活用して、モデルの最適化、ハイパーパラメータ調整、およびモデルのパフォーマンスを向上させるためのその他の変更について、情報に基づいた意思決定を行います。
実験の反復
分析に基づいて、実験を繰り返します。モデル構成、トレーニングパラメータ、またはデータ入力を調整し、トレーニングと分析のプロセスを繰り返します。この反復的なアプローチは、可能な限り最高のパフォーマンスを得るためにモデルを改良するための鍵となります。
概要
このガイドでは、DVCLiveとUltralyticsのYOLO26を統合するプロセスを説明しました。機械学習の取り組みにおいて、DVCLiveの力を活用して詳細な実験監視、効果的な視覚化、および洞察に満ちた分析を行う方法を学びました。
使用方法の詳細については、DVCLiveの公式ドキュメントをご覧ください。
さらに、Ultralytics統合ガイドページにアクセスして、Ultralyticsのより多くの統合と機能を探求してください。これは、優れたリソースと洞察のコレクションです。
よくある質問
実験trackのためにDVCLiveをUltralytics YOLO26と統合するにはどうすればよいですか?
DVCLiveとUltralytics YOLO26の統合は簡単です。必要なパッケージをインストールすることから始めます:
インストール
pip install ultralytics dvclive
次に、Gitリポジトリを初期化し、プロジェクトでDVCLiveを構成します。
初期環境設定
git init -q
git config --local user.email "you@example.com"
git config --local user.name "Your Name"
dvc init -q
git commit -m "DVC init"
詳細なセットアップ手順については、弊社のYOLO26インストールガイドに従ってください。
YOLO26実験のtrackのためにDVCLiveを使用すべきなのはなぜですか?
YOLO26でDVCLiveを使用すると、次のような複数の利点があります:
- 自動ロギング: DVCLiveは、モデルパラメータやメトリクスなどの主要な実験の詳細を自動的に記録します。
- 簡単な比較: さまざまな実行にわたる結果の比較を容易にします。
- 可視化ツール: DVCLiveの堅牢なデータ可視化機能を活用して、詳細な分析を行います。
詳細については、弊社のYOLO26モデルトレーニングとYOLOパフォーマンスメトリックに関するガイドを参照して、実験のtrack効率を最大化してください。
DVCLiveはYOLO26学習セッションの結果分析をどのように改善できますか?
YOLO26のトレーニングセッションが完了した後、DVCLiveは結果を効果的に視覚化および分析するのに役立ちます。実験データをロードして表示するコード例:
import dvc.api
import pandas as pd

# Define columns of interest
columns = ["Experiment", "epochs", "imgsz", "model", "metrics.mAP50-95(B)"]

# Retrieve experiment data
df = pd.DataFrame(dvc.api.exp_show(), columns=columns)

# Clean data
df.dropna(inplace=True)
df.reset_index(drop=True, inplace=True)

# Display DataFrame
print(df)
結果をインタラクティブに可視化するには、Plotlyの平行座標プロットを使用します:
from plotly.express import parallel_coordinates

fig = parallel_coordinates(df, columns, color="metrics.mAP50-95(B)")
fig.show()
その他の例とベストプラクティスについては、弊社のDVCLiveを使用したYOLO26トレーニングに関するガイドを参照してください。
DVCLiveとYOLO26の統合のための環境を設定する手順は何ですか?
DVCLiveとYOLO26のスムーズな統合のために環境を構成するには、次の手順に従ってください:
- 必要なパッケージのインストール: 以下を使用
pip install ultralytics dvclive. - Gitリポジトリの初期化: 実行
git init -q. - DVCLiveのセットアップ: 実行
dvc init -q. - Gitにコミット: 以下を使用
git commit -m "DVC init".
これらの手順により、実験追跡のための適切なバージョン管理とセットアップが保証されます。詳細な構成の詳細については、構成ガイドをご覧ください。
DVCLiveを使用してYOLO26実験の結果を可視化するにはどうすればよいですか?
DVCLiveは、YOLO26実験の結果を視覚化するための強力なツールを提供します。比較プロットを生成する方法は次のとおりです:
比較プロットの生成
dvc plots diff $(dvc exp list --names-only)
これらのプロットをJupyter Notebookに表示するには、以下を使用します:
from IPython.display import HTML

# Display plots as HTML
HTML(filename="./dvc_plots/index.html")
これらの視覚化は、傾向を特定し、モデルのパフォーマンスを最適化するのに役立ちます。包括的な手順と例については、YOLO26実験分析に関する詳細ガイドをご確認ください。


