Link to this sectionEtiketlenmiş Bilgisayarlı Görü Verileri için Veri Ön İşleme Teknikleri#
Link to this sectionGiriş#
Bilgisayarlı görü projenin hedeflerini tanımlayıp verileri toplayıp etiketledikten sonra, bir sonraki adım etiketlenmiş verileri ön işleme tabi tutmak ve model eğitimine hazırlamaktır. Temiz ve tutarlı veriler, iyi performans gösteren bir model oluşturmak için hayati önem taşır.
Watch: How to Use Data Preprocessing and Augmentation to Improve Model Accuracy in Real-World Scenarios 🚀
Ön işleme, bilgisayarlı görü projesi iş akışındaki görüntüleri yeniden boyutlandırmayı, piksel değerlerini normalize etmeyi, veri setini artırmayı ve verileri eğitim, doğrulama ve test setlerine ayırmayı içeren bir adımdır. Verilerini temizlemek için gerekli teknikleri ve en iyi uygulamaları keşfedelim!
Link to this sectionVeri Ön İşlemenin Önemi#
Verilerimizi halihazırda birçok hususu göz önünde bulundurarak dikkatlice topluyor ve etiketliyoruz. Peki, veri ön işlemeyi bir bilgisayarlı görü projesi için bu kadar önemli kılan nedir? Veri ön işleme, verilerini eğitim için hesaplama yükünü azaltan ve model performansını artırmaya yardımcı olan uygun bir formata getirmekle ilgilidir. İşte ön işlemenin çözdüğü ham verilerdeki bazı yaygın sorunlar:
- Gürültü: Verilerdeki ilgisiz veya rastgele değişimler.
- Tutarsızlık: Görüntü boyutları, formatları ve kalitesindeki farklılıklar.
- Dengesizlik: Veri setindeki sınıf veya kategorilerin eşit olmayan dağılımı.
Link to this sectionVeri Ön İşleme Teknikleri#
Veri ön işlemedeki ilk ve en önemli adımlardan biri yeniden boyutlandırmadır. Bazı modeller değişken girdi boyutlarını işlemek üzere tasarlanmıştır, ancak birçok model tutarlı bir girdi boyutu gerektirir. Görüntüleri yeniden boyutlandırmak onları tek tip hale getirir ve hesaplama karmaşıklığını azaltır.
Link to this sectionGörüntüleri Yeniden Boyutlandırma#
Görüntülerini şu yöntemleri kullanarak yeniden boyutlandırabilirsin:
- Çift Doğrusal İnterpolasyon (Bilinear Interpolation): En yakın dört piksel değerinin ağırlıklı ortalamasını alarak piksel değerlerini yumuşatır.
- En Yakın Komşu (Nearest Neighbor): Ortalamasını almadan en yakın piksel değerini atar, bu da daha bloklu bir görüntüye ancak daha hızlı hesaplamaya yol açar.
Yeniden boyutlandırmayı daha basit bir görev haline getirmek için şu araçları kullanabilirsin:
- OpenCV: Görüntü işleme için geniş fonksiyonlara sahip popüler bir bilgisayarlı görü kütüphanesi.
- PIL (Pillow): Görüntü dosyalarını açmak, işlemek ve kaydetmek için kullanılan bir Python Görüntüleme Kütüphanesi.
YOLO26 ile ilgili olarak, model eğitimi sırasındaki 'imgsz' parametresi esnek girdi boyutlarına olanak tanır. 640 gibi belirli bir boyuta ayarlandığında, model girdi görüntülerini orijinal en-boy oranını korurken en büyük boyutları 640 piksel olacak şekilde yeniden boyutlandırır.
Modelinin ve veri setinin özel ihtiyaçlarını değerlendirerek, yeniden boyutlandırmanın gerekli bir ön işleme adımı olup olmadığına veya modelinin değişen boyutlardaki görüntüleri verimli bir şekilde işleyip işleyemeyeceğine karar verebilirsin.
Link to this sectionPiksel Değerlerini Normalize Etme#
Bir diğer ön işleme tekniği normalizasyondur. Normalizasyon, piksel değerlerini standart bir aralığa ölçekler; bu da eğitim sırasında daha hızlı yakınsamaya yardımcı olur ve model performansını artırır. İşte bazı yaygın normalizasyon teknikleri:
- Min-Max Ölçeklendirme: Piksel değerlerini 0 ile 1 arasındaki bir aralığa ölçekler.
- Z-Skoru Normalizasyonu: Piksel değerlerini ortalamalarına ve standart sapmalarına göre ölçekler.
YOLO26 ile ilgili olarak, normalizasyon model eğitimi sırasındaki ön işleme hattının bir parçası olarak sorunsuz bir şekilde ele alınır. YOLO26, RGB'ye dönüştürme, piksel değerlerini [0, 1] aralığına ölçeklendirme ve önceden tanımlanmış ortalama ve standart sapma değerlerini kullanarak normalizasyon dahil olmak üzere birçok ön işleme adımını otomatik olarak gerçekleştirir.
Link to this sectionVeri Setini Ayırma#
Verileri temizledikten sonra veri setini ayırmaya hazırsın. Verileri eğitim, doğrulama ve test setlerine ayırmak, modelin genelleme performansını değerlendirmek amacıyla görülmemiş veriler üzerinde test edilmesini sağlamak için yapılır. Yaygın bir ayrım; eğitim için %70, doğrulama için %20 ve test için %10'dur. Verilerini ayırmak için scikit-learn veya TensorFlow gibi kullanabileceğin çeşitli araçlar ve kütüphaneler mevcuttur.
Veri setini ayırırken şunları göz önünde bulundur:
- Veri Dağılımını Koruma: Sınıfların veri dağılımının eğitim, doğrulama ve test setleri arasında korunduğundan emin ol.
- Veri Sızıntısını Önleme: Genellikle, veri artırma veri seti ayrıldıktan sonra yapılır. Veri artırma ve diğer tüm ön işlemler, doğrulama veya test setlerinden gelen bilgilerin model eğitimini etkilemesini önlemek için yalnızca eğitim setine uygulanmalıdır.
- Sınıfları Dengeleme: Dengesiz veri setleri için, eğitim seti içinde azınlık sınıfını aşırı örnekleme veya çoğunluk sınıfını eksik örnekleme gibi teknikleri değerlendir.
Link to this sectionVeri Artırma Nedir?#
En sık konuşulan veri ön işleme adımı veri artırmadır. Veri artırma, görüntülerin değiştirilmiş versiyonlarını oluşturarak veri setinin boyutunu yapay olarak artırır. Verilerini artırarak aşırı uyumu azaltabilir ve model genellemesini iyileştirebilirsin.
İşte veri artırmanın diğer bazı faydaları:
- Daha Sağlam Bir Veri Seti Oluşturur: Veri artırma, modeli girdi verilerindeki varyasyonlara ve bozulmalara karşı daha sağlam hale getirebilir. Buna ışık, yönelim ve ölçek değişiklikleri dahildir.
- Maliyet Etkili: Veri artırma, yeni veriler toplamadan ve etiketlemeden eğitim verisi miktarını artırmanın maliyet etkili bir yoludur.
- Verilerin Daha İyi Kullanımı: Her mevcut veri noktası, yeni varyasyonlar oluşturularak maksimum potansiyeliyle kullanılır.
Link to this sectionVeri Artırma Yöntemleri#
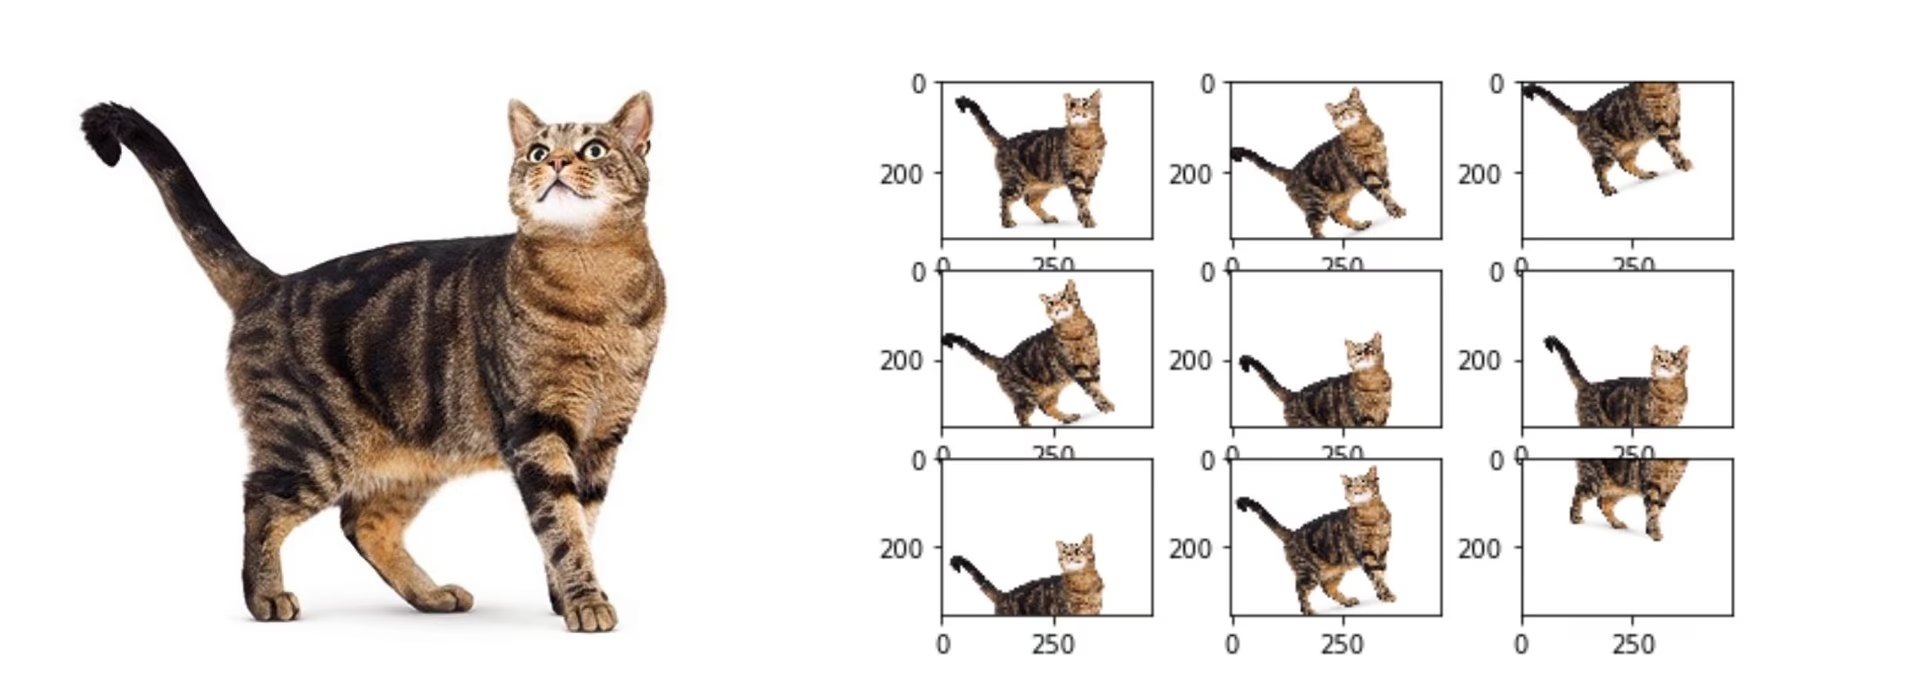
Yaygın artırma teknikleri arasında çevirme, döndürme, ölçeklendirme ve renk ayarlamaları bulunur. Albumentations, Imgaug ve TensorFlow'un ImageDataGenerator gibi çeşitli kütüphaneler bu artırmaları oluşturabilir.
YOLO26 ile ilgili olarak, veri seti yapılandırma dosyasını (.yaml dosyası) değiştirerek özel veri setini artırabilirsin. Bu dosyada, verilerini nasıl artırmak istediğini belirten parametrelerle bir artırma bölümü ekleyebilirsin.
Ultralytics YOLO26 deposu geniş bir veri artırma yelpazesini destekler. Şu gibi çeşitli dönüşümleri uygulayabilirsin:
- Rastgele Kırpmalar
- Çevirme: Görüntüler yatay veya dikey olarak çevrilebilir.
- Döndürme: Görüntüler belirli açılarla döndürülebilir.
- Bozulma
Ayrıca, daha fazla veri çeşitliliği oluşturmak için bu artırma tekniklerinin yoğunluğunu belirli parametreler aracılığıyla ayarlayabilirsin.
Link to this sectionÖn İşlemeye Dair Bir Vaka Çalışması#
YOLO26 kullanarak trafik görüntülerindeki farklı araç türlerini tespit etmek ve sınıflandırmak için bir model geliştirme projesini ele alalım. Trafik görüntülerini topladık ve bunları sınırlayıcı kutular (bounding boxes) ve etiketlerle işaretledik.
Bu proje için her bir ön işleme adımı şu şekilde görünecektir:
- Görüntüleri Yeniden Boyutlandırma: YOLO26 esnek girdi boyutlarını işlediği ve yeniden boyutlandırmayı otomatik olarak gerçekleştirdiği için manuel yeniden boyutlandırmaya gerek yoktur. Model, eğitim sırasında belirtilen 'imgsz' parametresine göre görüntü boyutunu ayarlayacaktır.
- Piksel Değerlerini Normalize Etme: YOLO26 ön işleme sırasında piksel değerlerini otomatik olarak 0 ile 1 aralığına normalize eder, bu nedenle buna gerek yoktur.
- Veri Setini Ayırma: scikit-learn gibi araçları kullanarak veri setini eğitim (%70), doğrulama (%20) ve test (%10) setlerine ayır.
- Veri Artırma: Rastgele kırpmalar, yatay çevirmeler ve parlaklık ayarlamaları gibi veri artırma tekniklerini dahil etmek için veri seti yapılandırma dosyasını (.yaml) düzenle.
Bu adımlar, veri setinin herhangi bir olası sorun olmadan hazırlandığından ve Keşifsel Veri Analizi (EDA) için hazır olduğundan emin olmanı sağlar.
Link to this sectionKeşifsel Veri Analizi Teknikleri#
Veri setini ön işledikten ve artırdıktan sonra bir sonraki adım, Keşifsel Veri Analizi yoluyla içgörüler elde etmektir. EDA, verilerindeki desenleri ve dağılımları anlamak için istatistiksel teknikler ve görselleştirme araçları kullanır. Sınıf dengesizlikleri veya aykırı değerler gibi sorunları belirleyebilir ve sonraki veri ön işleme veya model eğitimi ayarlamaları hakkında bilinçli kararlar verebilirsin.
Link to this sectionİstatistiksel EDA Teknikleri#
İstatistiksel teknikler genellikle ortalama, medyan, standart sapma ve aralık gibi temel metrikleri hesaplamakla başlar. Bu metrikler, görüntü veri setinin piksel yoğunluğu dağılımları gibi özellikleri hakkında hızlı bir genel bakış sağlar. Bu temel istatistikleri anlamak, verilerinin genel kalitesini ve özelliklerini kavramana yardımcı olur, böylece herhangi bir düzensizliği erkenden fark edebilirsin.
Link to this sectionGörsel EDA Teknikleri#
Görselleştirmeler, görüntü veri setleri için EDA'da anahtardır. Örneğin, sınıf dengesizliği analizi EDA'nın bir başka hayati yönüdür. Veri setinde belirli sınıfların yeterince temsil edilip edilmediğini belirlemeye yardımcı olur. Farklı görüntü sınıflarının veya kategorilerinin dağılımını çubuk grafikler kullanarak görselleştirmek, dengesizlikleri hızlı bir şekilde ortaya çıkarabilir. Benzer şekilde, aykırı değerler, piksel yoğunluğu veya özellik dağılımlarındaki anomalileri vurgulayan kutu grafikleri gibi görselleştirme araçları kullanılarak tanımlanabilir. Aykırı değer tespiti, olağandışı veri noktalarının sonuçlarını saptırmasını önler.
Görselleştirmeler için yaygın araçlar şunlardır:
- Histogramlar ve Kutu Grafikleri: Piksel değerlerinin dağılımını anlamak ve aykırı değerleri tanımlamak için yararlıdır.
- Dağılım Grafikleri (Scatter Plots): Görüntü özellikleri veya etiketler arasındaki ilişkileri keşfetmek için yardımcıdır.
- Isı Haritaları (Heatmaps): Piksel yoğunluklarının dağılımını veya görüntüler içindeki etiketli özelliklerin mekansal dağılımını görselleştirmek için etkilidir.
Link to this sectionEDA için Ultralytics Platformunu Kullanma#
Kodsuz bir EDA yaklaşımı için veri setini Ultralytics Platformuna yükle. Veri setinin Charts sekmesi yukarıda açıklanan görselleştirmeleri otomatik olarak oluşturur: bölünmüş dağılım, en üst sınıf sayıları, görüntü genişliği/yüksekliği histogramları ve etiket konumlarının ve görüntü boyutlarının 2D ısı haritaları. Images sekmesi, verilerine etiket katmanlarıyla ızgara, kompakt veya tablo görünümlerinde göz atmanı sağlar; bu da tek bir satır kod yazmadan yanlış etiketlenmiş örnekleri veya dengesiz sınıfları fark etmeyi kolaylaştırır.
Link to this sectionUlaş ve Bağlantı Kur#
Projen hakkında diğer bilgisayarlı görü meraklılarıyla tartışmalar yapmak, sana farklı bakış açılarından yeni fikirler verebilir. İşte öğrenmek, sorun gidermek ve ağ kurmak için bazı harika yollar:
Link to this sectionToplulukla Bağlantı Kurulacak Kanallar#
- GitHub Sorunları: YOLO26 GitHub deposunu ziyaret et ve soru sormak, hata bildirmek ve özellik önerilerinde bulunmak için Issues sekmesini kullan. Topluluk ve geliştiriciler, karşılaştığın tüm sorunlarda yardımcı olmak için oradalar.
- Ultralytics Discord Sunucusu: Diğer kullanıcılar ve geliştiricilerle bağlantı kurmak, destek almak, bilgi paylaşmak ve fikir alışverişinde bulunmak için Ultralytics Discord sunucusuna katıl.
Link to this sectionResmi Dokümantasyon#
- Ultralytics YOLO26 Dokümantasyonu: Çok sayıda bilgisayarlı görü görevi ve projesi hakkında kapsamlı kılavuzlar ve değerli içgörüler için resmi YOLO26 dokümantasyonuna başvur.
Link to this sectionVeri Setin Hazır!#
Düzgün bir şekilde yeniden boyutlandırılmış, normalize edilmiş ve artırılmış veriler, gürültüyü azaltarak ve genellemeyi iyileştirerek model performansını artırır. Bu kılavuzda belirtilen ön işleme tekniklerini ve en iyi uygulamaları izleyerek sağlam bir veri seti oluşturabilirsin. Ön işlenmiş veri setin hazır olduğunda, projenin sonraki adımlarına güvenle geçebilirsin.
Link to this sectionSSS#
Link to this sectionBilgisayarlı görü projelerinde veri ön işlemenin önemi nedir?#
Veri ön işleme, bilgisayarlı görü projelerinde verilerin temiz, tutarlı ve model eğitimi için optimal bir formatta olmasını sağladığı için esastır. Gürültü, tutarsızlık ve dengesizlik gibi ham verilerdeki sorunları ele alarak; yeniden boyutlandırma, normalizasyon, artırma ve veri seti ayırma gibi ön işleme adımları, hesaplama yükünü azaltmaya ve model performansını iyileştirmeye yardımcı olur. Daha fazla ayrıntı için bilgisayarlı görü projesi adımları sayfasını ziyaret et.
Link to this sectionVeri artırma için Ultralytics YOLO'yu nasıl kullanabilirim?#
Ultralytics YOLO26 ile veri artırma için veri seti yapılandırma dosyasını (.yaml) değiştirmen gerekir. Bu dosyada, rastgele kırpmalar, yatay çevirmeler ve parlaklık ayarlamaları gibi çeşitli artırma tekniklerini belirtebilirsin. Bu, burada açıklanan eğitim yapılandırmaları kullanılarak etkili bir şekilde yapılabilir. Veri artırma, daha sağlam bir veri seti oluşturmaya, aşırı uyumu azaltmaya ve model genellemesini iyileştirmeye yardımcı olur.
Link to this sectionBilgisayarlı görü verileri için en iyi veri normalizasyon teknikleri nelerdir?#
Normalizasyon, eğitim sırasında daha hızlı yakınsama ve iyileştirilmiş performans için piksel değerlerini standart bir aralığa ölçekler. Yaygın teknikler şunları içerir:
- Min-Max Ölçeklendirme: Piksel değerlerini 0 ile 1 arasındaki bir aralığa ölçekler.
- Z-Skoru Normalizasyonu: Piksel değerlerini ortalamalarına ve standart sapmalarına göre ölçekler.
YOLO26 için normalizasyon, RGB'ye dönüştürme ve piksel değeri ölçeklendirme dahil olmak üzere otomatik olarak halledilir. Bu konuda daha fazla bilgiyi model eğitimi bölümünde bulabilirsin.
Link to this sectionEtiketlenmiş veri setimi eğitim için nasıl ayırmalıyım?#
Veri setini ayırmak için yaygın bir uygulama, onu eğitim için %70, doğrulama için %20 ve test için %10 olarak bölmektir. Sınıfların veri dağılımını bu bölümler arasında korumak ve artırmayı yalnızca eğitim setine uygulayarak veri sızıntısını önlemek önemlidir. Verimli veri seti ayırma için scikit-learn veya TensorFlow gibi araçlar kullan. Veri seti hazırlama hakkındaki ayrıntılı kılavuza göz at.
Link to this sectionYOLO26'da manuel yeniden boyutlandırma yapmadan değişen görüntü boyutlarını işleyebilir miyim?#
Evet, Ultralytics YOLO26, model eğitimi sırasındaki 'imgsz' parametresi aracılığıyla değişen görüntü boyutlarını işleyebilir. Bu parametre, görüntülerin en-boy oranını korurken en büyük boyutlarının belirtilen boyuta (örneğin 640 piksel) uyacak şekilde yeniden boyutlandırılmasını sağlar. Daha esnek girdi işleme ve otomatik ayarlamalar için model eğitimi bölümünü kontrol et.