Link to this sectionData Preprocessing Techniques for Annotated Computer Vision Data#
Data preprocessing turns raw, annotated images into the clean and consistent inputs a computer vision model needs to train well. With Ultralytics YOLO26, the core pixel operations — RGB conversion, scaling to [0, 1], and resizing — run automatically inside the training pipeline, so the work that remains is splitting your dataset correctly, balancing classes, and choosing augmentations. This guide covers those essential techniques: resizing, normalization, dataset splitting, data augmentation, and exploratory data analysis (EDA).
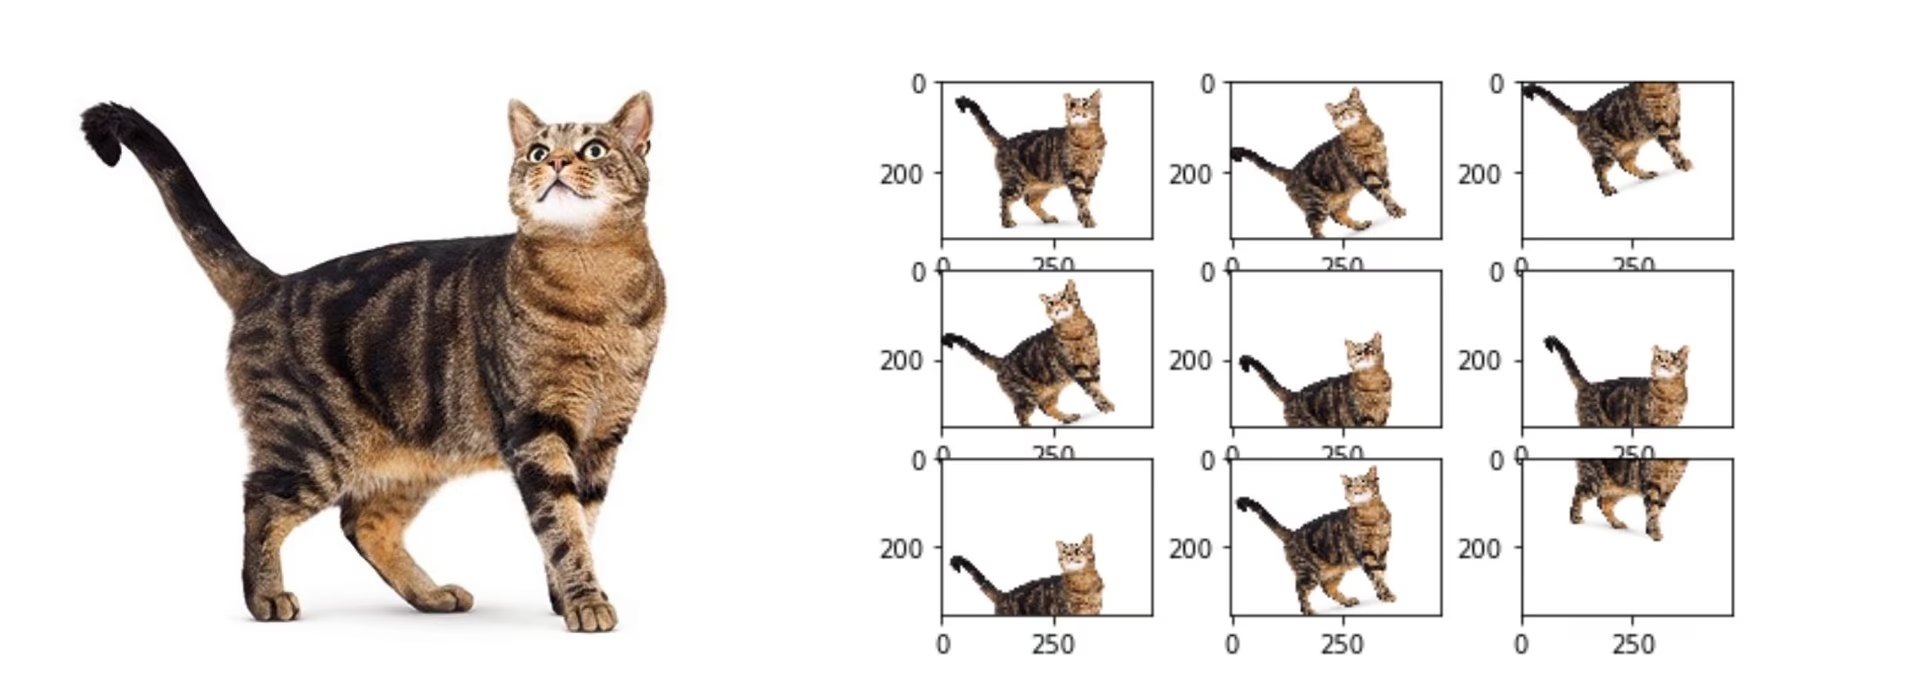
Watch: How to Use Data Preprocessing and Augmentation to Improve Model Accuracy in Real-World Scenarios 🚀
This step comes after you've defined your project's goals and collected and annotated your data, and it sits early in the computer vision project workflow.
Link to this sectionWhy Preprocessing Matters#
Preprocessing gets your data into a format that reduces computational load and improves model performance. It addresses three common issues in raw data:
- Noise: Irrelevant or random variations in the data.
- Inconsistency: Variations in image sizes, formats, and quality.
- Imbalance: Unequal distribution of classes or categories across the dataset.
Link to this sectionPreprocessing Techniques#
The main techniques are resizing, normalization, dataset splitting, and augmentation. With YOLO26 the first two are automatic, while splitting and augmentation are where your choices matter most.
Link to this sectionResizing Images#
Many models require a consistent input size, so resizing makes images uniform and reduces computational complexity. Two common interpolation methods are:
- Bilinear Interpolation: Smooths pixel values by taking a weighted average of the four nearest pixels.
- Nearest Neighbor: Copies the nearest pixel value without averaging — faster, but produces a blockier image.
Libraries like OpenCV and PIL (Pillow) provide these functions, but with YOLO26 you usually don't resize manually. The imgsz argument during model training handles it: when set to a value such as 640, YOLO scales each image so its largest dimension is 640 pixels while preserving the aspect ratio, then pads the shorter side (default gray, value 114) to reach a square 640 × 640 input.
Link to this sectionNormalizing Pixel Values#
Normalization scales pixel values to a standard range, which helps the model converge faster during training. Two common techniques are:
- Min-Max Scaling: Scales pixel values to a range of 0 to 1.
- Z-Score Normalization: Scales pixel values based on their mean and standard deviation.
YOLO26 handles normalization automatically as part of its preprocessing pipeline: it converts images to RGB and scales pixel values to the range [0, 1] by dividing by 255 (min-max scaling). YOLO does not apply ImageNet-style mean/standard-deviation (z-score) normalization by default, so no manual normalization step is required.
Link to this sectionSplitting the Dataset#
Splitting the data into training, validation, and test sets lets you evaluate the model on unseen data and measure its generalization. A common split is 70% for training, 20% for validation, and 10% for testing. Tools like scikit-learn or TensorFlow make this straightforward.
Keep these points in mind when splitting:
- Maintain class distribution: Ensure each class is represented proportionally across the training, validation, and test sets.
- Balance classes: For imbalanced datasets, consider oversampling the minority class or under-sampling the majority class — within the training set only.
Split the dataset before applying any augmentation or other preprocessing, and apply those transforms only to the training set. Augmenting before the split lets information from the validation or test images influence training, producing misleadingly high scores that collapse on real-world data.
Link to this sectionAugmenting the Dataset#
Data augmentation artificially increases the size of a dataset by creating modified versions of existing images. It helps reduce overfitting and improves generalization, with several benefits:
- More robust models: Variations in lighting, orientation, and scale make the model resilient to real-world distortions.
- Cost-effective: You expand the training set without collecting and labeling new data.
- Better use of data: Every annotated image yields multiple training variations.
With YOLO26, augmentation is controlled through training arguments passed to model.train() or the equivalent CLI flags — not by editing the dataset YAML, which defines dataset metadata such as paths, class names, and splits. The built-in augmentations include:
- Mosaic, MixUp, and CutMix (
mosaic,mixup,cutmix): Combine multiple images into one training sample. - Flips (
fliplr,flipud): Mirror images horizontally or vertically. - Geometric transforms (
degrees,translate,scale,shear,perspective): Rotate, shift, zoom, and warp images. - HSV color jitter (
hsv_h,hsv_s,hsv_v): Vary hue, saturation, and brightness. - Copy-paste (
copy_paste): Paste objects between images for segmentation.
from ultralytics import YOLO

model = YOLO("yolo26n.pt")

# Augmentation is configured with training arguments, not the dataset YAML
model.train(data="coco8.yaml", epochs=10, hsv_h=0.015, fliplr=0.5, mosaic=1.0, degrees=10.0)
For the full list of augmentation arguments and their default values, see the augmentation settings reference and the dedicated YOLO data augmentation guide. If the albumentations package is installed, YOLO also enables its built-in Albumentations-based augmentations automatically.
Link to this sectionA Case Study: Preprocessing for Vehicle Detection#
Consider a project to detect and classify vehicles in traffic images with YOLO26, starting from images annotated with bounding boxes and labels. Here is what each preprocessing decision looks like:
- Resizing: No manual work — YOLO26 resizes to
imgszduring training. - Normalization: No manual work — YOLO26 scales pixel values to
[0, 1]automatically. - Splitting: Divide the dataset into 70% training, 20% validation, and 10% testing, keeping the class distribution consistent across splits.
- Augmentation: Set training arguments suited to traffic scenes — for example
fliplrfor direction invariance,hsv_vfor day/night lighting, andmosaicfor varied object density.
With these decisions made, the dataset is ready for Exploratory Data Analysis (EDA).
Link to this sectionExploratory Data Analysis (EDA)#
EDA uses statistics and visualizations to reveal patterns and distributions in your data, helping you catch issues like class imbalance or outliers before training.
Link to this sectionStatistical EDA Techniques#
Statistical EDA starts with basic metrics — mean, median, standard deviation, and range — computed over properties such as pixel-intensity distributions. These give a quick overview of your dataset's quality and surface irregularities early.
Link to this sectionVisual EDA Techniques#
Visualizations reveal patterns that summary statistics miss, such as class imbalance and outliers. Common tools include:
- Histograms and box plots: Show the distribution of pixel values and flag outliers in intensity or feature distributions.
- Bar charts: Reveal class imbalance by comparing how many examples each class has.
- Scatter plots: Explore relationships between image features or annotations.
- Heatmaps: Visualize pixel-intensity distributions or the spatial distribution of annotations across images.
Link to this sectionUltralytics Platform for EDA#
For a no-code approach to EDA, upload your dataset to Ultralytics Platform. The dataset's Charts tab automatically generates key EDA visualizations: split distribution, top class counts, image width/height histograms, and 2D heatmaps of annotation positions and image dimensions. The Images tab lets you browse your data in grid, compact, or table views with annotation overlays, making it easy to spot mislabeled examples or unbalanced classes without writing any code.
Link to this sectionConclusion#
Properly split, normalized, and augmented data reduces noise and improves generalization, turning a raw collection of images into a dependable training set. With your dataset preprocessed, the next step is to train your model. If questions come up along the way, ask the community on the Ultralytics GitHub repository or the Ultralytics Discord server.
Link to this sectionFAQ#
Link to this sectionWhy is data preprocessing important in computer vision projects?#
Preprocessing ensures your data is clean, consistent, and in a format optimized for training. By addressing noise, inconsistency, and class imbalance in raw data, steps like resizing, normalization, augmentation, and dataset splitting reduce computational load and improve model performance. See the steps of a computer vision project for how it fits into the broader workflow.
Link to this sectionHow do I use Ultralytics YOLO for data augmentation?#
Configure augmentation through training arguments, not the dataset YAML. Pass arguments such as fliplr, mosaic, hsv_h, and degrees to model.train() (or the equivalent CLI flags) to set the probability and strength of each transform. These are defined in the augmentation settings and explained in the YOLO data augmentation guide.
Link to this sectionWhat are the best normalization techniques for computer vision data?#
The two most common techniques are min-max scaling (rescaling pixels to a range of 0 to 1) and z-score normalization (rescaling based on mean and standard deviation). YOLO26 applies min-max scaling automatically — converting images to RGB and dividing pixel values by 255 — so you don't need a manual normalization step. It does not apply z-score normalization by default.
Link to this sectionHow should I split my annotated dataset for training?#
A common practice is 70% for training, 20% for validation, and 10% for testing. Maintain the class distribution across all three splits, and avoid data leakage by applying augmentation only to the training set after the split. Tools like scikit-learn or TensorFlow handle the split efficiently. See the data collection and annotation guide for upstream dataset preparation.
Link to this sectionCan YOLO26 handle varying image sizes without manual resizing?#
Yes. The imgsz argument resizes images during training and inference so their largest dimension matches the specified size (e.g., 640 pixels) while preserving the aspect ratio, then pads the shorter side. You don't need to resize images yourself — see the model training documentation for details.