Link to this sectionK-Fold Cross Validation with Ultralytics#
Link to this sectionIntroduction#
This comprehensive guide illustrates the implementation of K-Fold Cross Validation for object detection datasets within the Ultralytics ecosystem. We'll leverage the YOLO detection format and key Python libraries such as sklearn, pandas, and PyYAML to guide you through the necessary setup, the process of generating feature vectors, and the execution of a K-Fold dataset split.
Whether your project involves the Fruit Detection dataset or a custom data source, this tutorial aims to help you comprehend and apply K-Fold Cross Validation to bolster the reliability and robustness of your machine learning models. While we're applying k=5 folds for this tutorial, keep in mind that the optimal number of folds can vary depending on your dataset and the specifics of your project.
Let's get started.
Link to this sectionSetup#
-
Your annotations should be in the YOLO detection format.
-
This guide assumes that annotation files are locally available.
-
For our demonstration, we use the Fruit Detection dataset.
- This dataset contains a total of 8479 images.
- It includes 6 class labels, each with its total instance counts listed below.
| Class Label | Instance Count |
|---|---|
| Apple | 7049 |
| Grapes | 7202 |
| Pineapple | 1613 |
| Orange | 15549 |
| Banana | 3536 |
| Watermelon | 1976 |
-
Necessary Python packages include:
ultralyticssklearnpandaspyyaml
-
This tutorial operates with
k=5folds. However, you should determine the best number of folds for your specific dataset.
-
Initiate a new Python virtual environment (
venv) for your project and activate it. Usepip(or your preferred package manager) to install:- The Ultralytics library:
pip install -U ultralytics. Alternatively, you can clone the official repo. - Scikit-learn, pandas, and PyYAML:
pip install -U scikit-learn pandas pyyaml.
- The Ultralytics library:
-
Verify that your annotations are in the YOLO detection format.
- For this tutorial, all annotation files are found in the
Fruit-Detection/labelsdirectory.
- For this tutorial, all annotation files are found in the
Link to this sectionGenerating Feature Vectors for Object Detection Dataset#
-
Start by creating a new
example.pyPython file for the steps below. -
Proceed to retrieve all label files for your dataset.
from pathlib import Path dataset_path = Path("./Fruit-detection") # replace with 'path/to/dataset' for your custom data labels = sorted(dataset_path.rglob("*labels/*.txt")) # all data in 'labels' -
Now, read the contents of the dataset YAML file and extract the indices of the class labels.
import yaml yaml_file = "path/to/data.yaml" # your data YAML with data directories and names dictionary with open(yaml_file, encoding="utf8") as y: classes = yaml.safe_load(y)["names"] cls_idx = sorted(classes.keys()) -
Initialize an empty
pandasDataFrame.import pandas as pd index = [label.stem for label in labels] # uses base filename as ID (no extension) labels_df = pd.DataFrame([], columns=cls_idx, index=index) -
Count the instances of each class-label present in the annotation files.
from collections import Counter for label in labels: lbl_counter = Counter() with open(label) as lf: lines = lf.readlines() for line in lines: # classes for YOLO label uses integer at first position of each line lbl_counter[int(line.split(" ", 1)[0])] += 1 labels_df.loc[label.stem] = lbl_counter labels_df = labels_df.fillna(0.0) # replace `nan` values with `0.0` -
The following is a sample view of the populated DataFrame:
                                                       0    1    2    3    4    5
'0000a16e4b057580_jpg.rf.00ab48988370f64f5ca8ea4...'  0.0  0.0  0.0  0.0  0.0  7.0
'0000a16e4b057580_jpg.rf.7e6dce029fb67f01eb19aa7...'  0.0  0.0  0.0  0.0  0.0  7.0
'0000a16e4b057580_jpg.rf.bc4d31cdcbe229dd022957a...'  0.0  0.0  0.0  0.0  0.0  7.0
'00020ebf74c4881c_jpg.rf.508192a0a97aa6c4a3b6882...'  0.0  0.0  0.0  1.0  0.0  0.0
'00020ebf74c4881c_jpg.rf.5af192a2254c8ecc4188a25...'  0.0  0.0  0.0  1.0  0.0  0.0
 ...                                                  ...  ...  ...  ...  ...  ...
'ff4cd45896de38be_jpg.rf.c4b5e967ca10c7ced3b9e97...'  0.0  0.0  0.0  0.0  0.0  2.0
'ff4cd45896de38be_jpg.rf.ea4c1d37d2884b3e3cbce08...'  0.0  0.0  0.0  0.0  0.0  2.0
'ff5fd9c3c624b7dc_jpg.rf.bb519feaa36fc4bf630a033...'  1.0  0.0  0.0  0.0  0.0  0.0
'ff5fd9c3c624b7dc_jpg.rf.f0751c9c3aa4519ea3c9d6a...'  1.0  0.0  0.0  0.0  0.0  0.0
'fffe28b31f2a70d4_jpg.rf.7ea16bd637ba0711c53b540...'  0.0  6.0  0.0  0.0  0.0  0.0
The rows index the label files, each corresponding to an image in your dataset, and the columns correspond to your class-label indices. Each row represents a pseudo feature-vector, with the count of each class-label present in your dataset. This data structure enables the application of K-Fold Cross Validation to an object detection dataset.
Link to this sectionK-Fold Dataset Split#
-
Now we will use the
KFoldclass fromsklearn.model_selectionto generateksplits of the dataset.- Important:
- Setting
shuffle=Trueensures a randomized distribution of classes in your splits. - By setting
random_state=MwhereMis a chosen integer, you can obtain repeatable results.
- Setting
import random from sklearn.model_selection import KFold random.seed(0) # for reproducibility ksplit = 5 kf = KFold(n_splits=ksplit, shuffle=True, random_state=20) # setting random_state for repeatable results kfolds = list(kf.split(labels_df)) - Important:
-
The dataset has now been split into
kfolds, each having a list oftrainandvalindices. We will construct a DataFrame to display these results more clearly.folds = [f"split_{n}" for n in range(1, ksplit + 1)] folds_df = pd.DataFrame(index=index, columns=folds) for i, (train, val) in enumerate(kfolds, start=1): folds_df[f"split_{i}"].loc[labels_df.iloc[train].index] = "train" folds_df[f"split_{i}"].loc[labels_df.iloc[val].index] = "val" -
Now we will calculate the distribution of class labels for each fold as a ratio of the classes present in
valto those present intrain.fold_lbl_distrb = pd.DataFrame(index=folds, columns=cls_idx) for n, (train_indices, val_indices) in enumerate(kfolds, start=1): train_totals = labels_df.iloc[train_indices].sum() val_totals = labels_df.iloc[val_indices].sum() # To avoid division by zero, we add a small value (1E-7) to the denominator ratio = val_totals / (train_totals + 1e-7) fold_lbl_distrb.loc[f"split_{n}"] = ratioThe ideal scenario is for all class ratios to be reasonably similar for each split and across classes. This, however, will be subject to the specifics of your dataset.
-
Next, we create the directories and dataset YAML files for each split.
import datetime supported_extensions = [".jpg", ".jpeg", ".png"] # Initialize an empty list to store image file paths images = [] # Loop through supported extensions and gather image files for ext in supported_extensions: images.extend(sorted((dataset_path / "images").rglob(f"*{ext}"))) # Create the necessary directories and dataset YAML files save_path = Path(dataset_path / f"{datetime.date.today().isoformat()}_{ksplit}-Fold_Cross-val") save_path.mkdir(parents=True, exist_ok=True) ds_yamls = [] for split in folds_df.columns: # Create directories split_dir = save_path / split split_dir.mkdir(parents=True, exist_ok=True) (split_dir / "train" / "images").mkdir(parents=True, exist_ok=True) (split_dir / "train" / "labels").mkdir(parents=True, exist_ok=True) (split_dir / "val" / "images").mkdir(parents=True, exist_ok=True) (split_dir / "val" / "labels").mkdir(parents=True, exist_ok=True) # Create dataset YAML files dataset_yaml = split_dir / f"{split}_dataset.yaml" ds_yamls.append(dataset_yaml) with open(dataset_yaml, "w") as ds_y: yaml.safe_dump( { "path": split_dir.as_posix(), "train": "train", "val": "val", "names": classes, }, ds_y, ) -
Lastly, copy images and labels into the respective directory ('train' or 'val') for each split.
- NOTE: The time required for this portion of the code will vary based on the size of your dataset and your system hardware.
import shutil

from tqdm import tqdm

for image, label in tqdm(zip(images, labels), total=len(images), desc="Copying files"):
    for split, k_split in folds_df.loc[image.stem].items():
        # Destination directory
        img_to_path = save_path / split / k_split / "images"
        lbl_to_path = save_path / split / k_split / "labels"

        # Copy image and label files to new directory (SamefileError if file already exists)
        shutil.copy(image, img_to_path / image.name)
        shutil.copy(label, lbl_to_path / label.name)
Link to this sectionSave Records (Optional)#
Optionally, you can save the records of the K-Fold split and label distribution DataFrames as CSV files for future reference.
folds_df.to_csv(save_path / "kfold_datasplit.csv")
fold_lbl_distrb.to_csv(save_path / "kfold_label_distribution.csv")
Link to this sectionTrain YOLO using K-Fold Data Splits#
-
First, load the YOLO model.
from ultralytics import YOLO weights_path = "path/to/weights.pt" # use yolo26n.pt for a small model model = YOLO(weights_path, task="detect") -
Next, iterate over the dataset YAML files to run training. The results will be saved to a directory specified by the
projectandnamearguments. By default, this directory is 'runs/detect/train#' where # is an integer index.results = {} # Define your additional arguments here batch = 16 project = "kfold_demo" epochs = 100 for k, dataset_yaml in enumerate(ds_yamls): model = YOLO(weights_path, task="detect") results[k] = model.train( data=dataset_yaml, epochs=epochs, batch=batch, project=project, name=f"fold_{k + 1}" ) # include any additional train arguments -
You can also use Ultralytics data.split.autosplit function for automatic dataset splitting:
from ultralytics.data.split import autosplit

# Automatically split dataset into train/val/test
autosplit(path="path/to/images", weights=(0.8, 0.2, 0.0), annotated_only=True)
Link to this sectionConclusion#
In this guide, we have explored the process of using K-Fold cross-validation for training the YOLO object detection model. We learned how to split our dataset into K partitions, ensuring a balanced class distribution across the different folds.
We also explored the procedure for creating report DataFrames to visualize the data splits and label distributions across these splits, providing us a clear insight into the structure of our training and validation sets.
Optionally, we saved our records for future reference, which could be particularly useful in large-scale projects or when troubleshooting model performance.
Finally, we implemented the actual model training using each split in a loop, saving our training results for further analysis and comparison.
This technique of K-Fold cross-validation is a robust way of making the most out of your available data, and it helps to ensure that your model performance is reliable and consistent across different data subsets. This results in a more generalizable and reliable model that is less likely to overfit to specific data patterns.
Remember that although we used YOLO in this guide, these steps are mostly transferable to other machine learning models. Understanding these steps allows you to apply cross-validation effectively in your own machine learning projects.
Link to this sectionFAQ#
Link to this sectionWhat is K-Fold Cross Validation and why is it useful in object detection?#
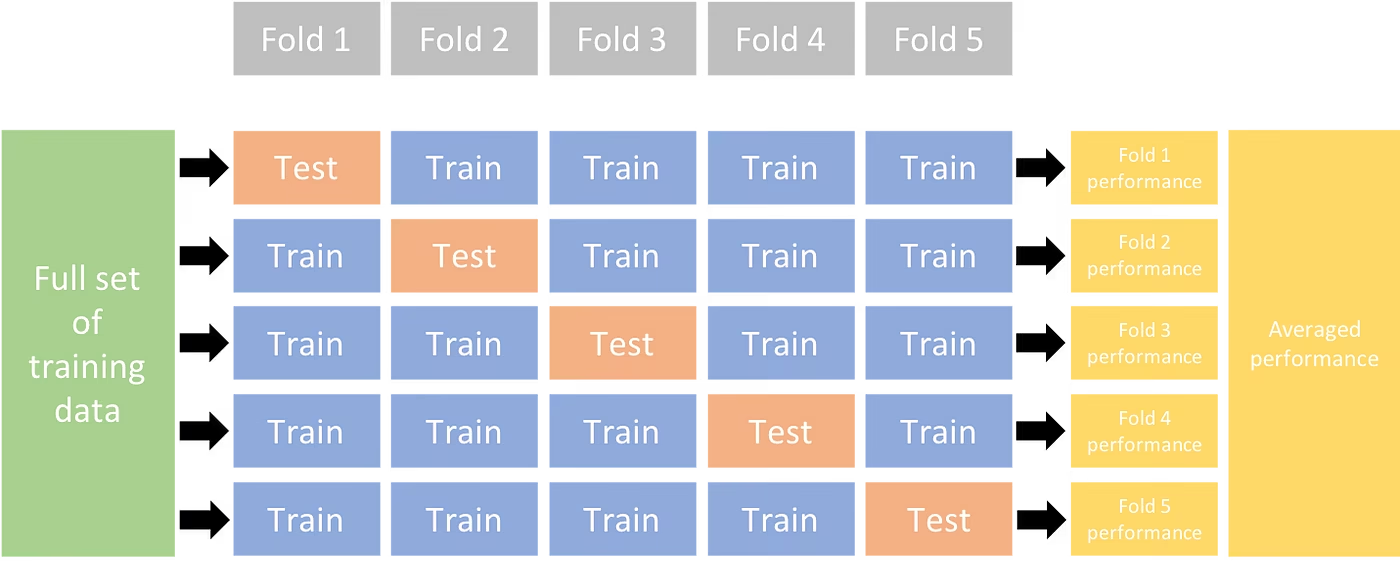
K-Fold Cross Validation is a technique where the dataset is divided into 'k' subsets (folds) to evaluate model performance more reliably. Each fold serves as both training and validation data. In the context of object detection, using K-Fold Cross Validation helps to ensure your Ultralytics YOLO model's performance is robust and generalizable across different data splits, enhancing its reliability. For detailed instructions on setting up K-Fold Cross Validation with Ultralytics YOLO, refer to K-Fold Cross Validation with Ultralytics.
Link to this sectionHow do I implement K-Fold Cross Validation using Ultralytics YOLO?#
To implement K-Fold Cross Validation with Ultralytics YOLO, you need to follow these steps:
- Verify annotations are in the YOLO detection format.
- Use Python libraries like
sklearn,pandas, andpyyaml. - Create feature vectors from your dataset.
- Split your dataset using
KFoldfromsklearn.model_selection. - Train the YOLO model on each split.
For a comprehensive guide, see the K-Fold Dataset Split section in our documentation.
Link to this sectionWhy should I use Ultralytics YOLO for object detection?#
Ultralytics YOLO offers state-of-the-art, real-time object detection with high accuracy and efficiency. It's versatile, supporting multiple computer vision tasks such as detection, instance segmentation, semantic segmentation, and classification. Additionally, it integrates seamlessly with tools like Ultralytics Platform for no-code model training and deployment. For more details, explore the benefits and features on our Ultralytics YOLO page.
Link to this sectionHow can I ensure my annotations are in the correct format for Ultralytics YOLO?#
Your annotations should follow the YOLO detection format. Each annotation file must list the object class, alongside its bounding box coordinates in the image. The YOLO format ensures streamlined and standardized data processing for training object detection models. For more information on proper annotation formatting, visit the YOLO detection format guide.
Link to this sectionCan I use K-Fold Cross Validation with custom datasets other than Fruit Detection?#
Yes, you can use K-Fold Cross Validation with any custom dataset as long as the annotations are in the YOLO detection format. Replace the dataset paths and class labels with those specific to your custom dataset. This flexibility ensures that any object detection project can benefit from robust model evaluation using K-Fold Cross Validation. For a practical example, review our Generating Feature Vectors section.