使用Ultralytics YOLO26进行分析
简介
本指南全面概述了三种基本类型的 数据可视化:折线图、条形图和饼图。每个部分都包含关于如何使用 python 创建这些可视化的分步说明和代码片段。
观看: 如何使用 Ultralytics 生成分析图表 | 折线图、条形图、面积图和饼图
可视化示例
| 折线图 | 条形图 | 饼图 |
|---|---|---|
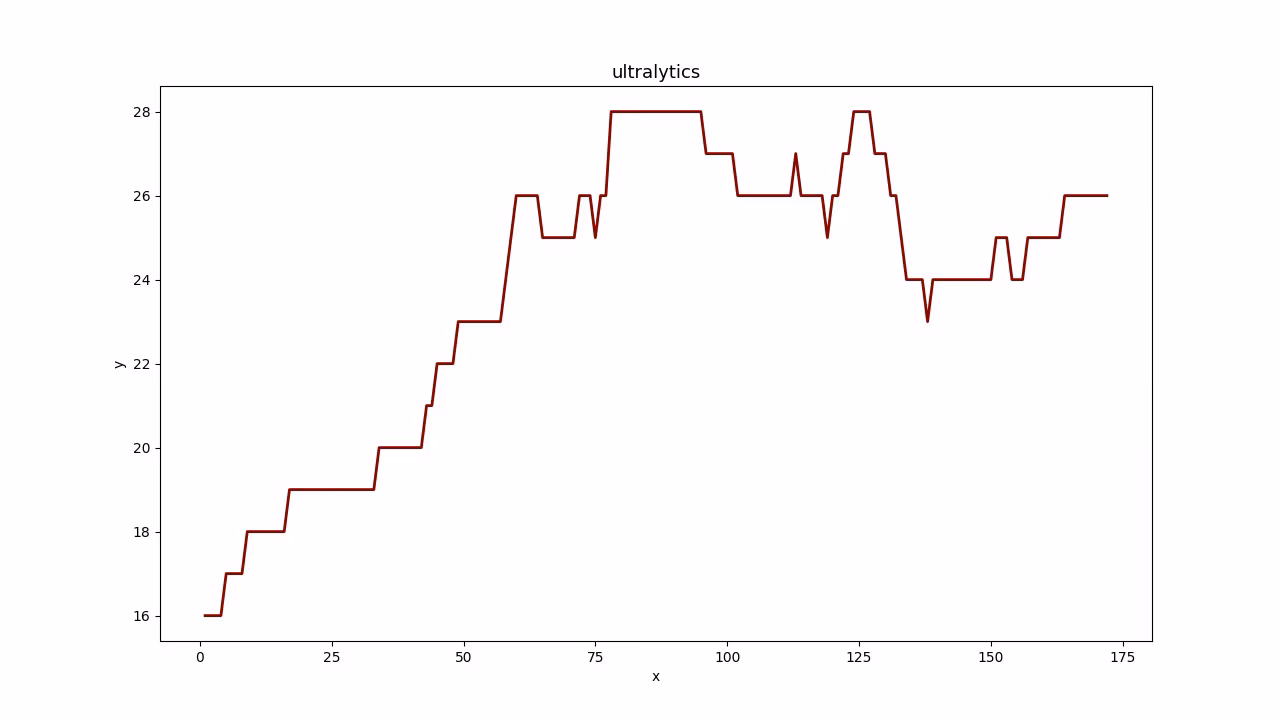 | 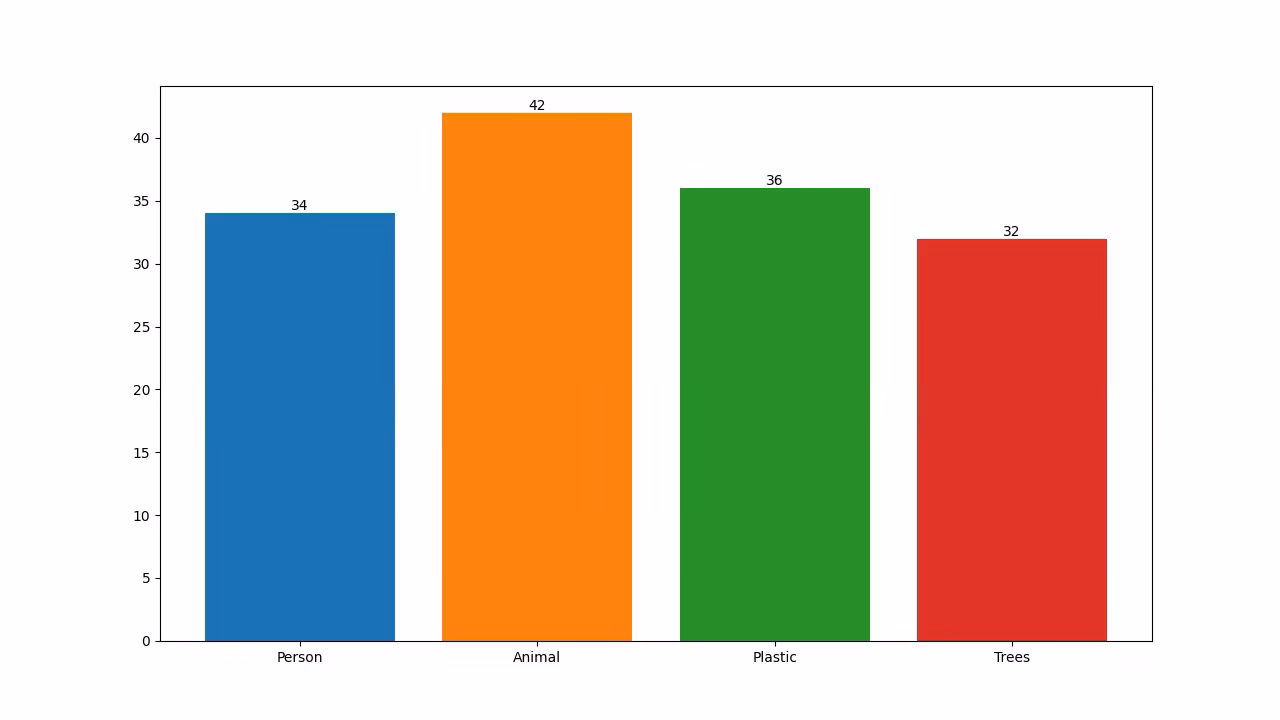 | 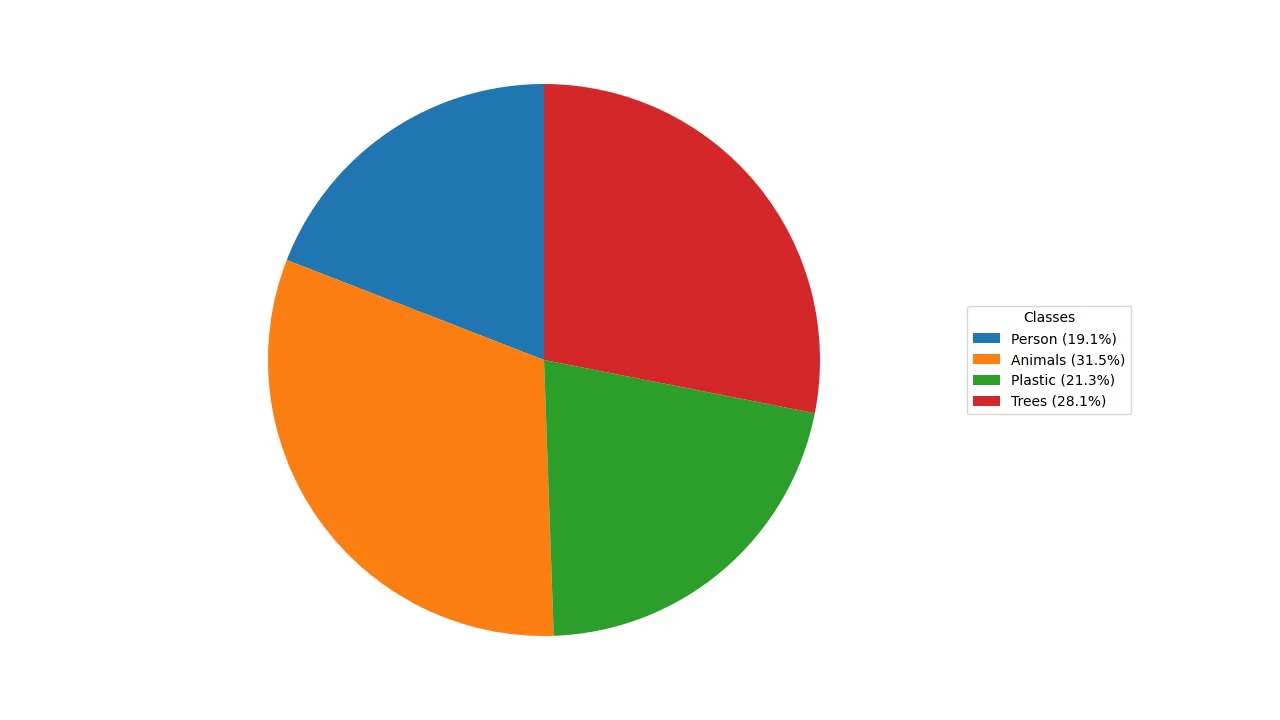 |
为什么图表很重要
- 折线图非常适合跟踪短期和长期的变化,以及比较同一时期多个组的变化。
- 另一方面,条形图适用于比较不同类别之间的数量,并显示类别与其数值之间的关系。
- 最后,饼图可以有效地说明类别之间的比例,并显示整体的各个部分。
使用 Ultralytics YOLO 进行分析
yolo solutions analytics show=True

# Pass the source
yolo solutions analytics source="path/to/video.mp4"

# Generate the pie chart
yolo solutions analytics analytics_type="pie" show=True

# Generate the bar plots
yolo solutions analytics analytics_type="bar" show=True

# Generate the area plots
yolo solutions analytics analytics_type="area" show=True
import cv2

from ultralytics import solutions

cap = cv2.VideoCapture("path/to/video.mp4")
assert cap.isOpened(), "Error reading video file"

# Video writer
w, h, fps = (int(cap.get(x)) for x in (cv2.CAP_PROP_FRAME_WIDTH, cv2.CAP_PROP_FRAME_HEIGHT, cv2.CAP_PROP_FPS))
out = cv2.VideoWriter(
    "analytics_output.avi",
    cv2.VideoWriter_fourcc(*"MJPG"),
    fps,
    (1280, 720),  # this is fixed
)

# Initialize analytics object
analytics = solutions.Analytics(
    show=True,  # display the output
    analytics_type="line",  # pass the analytics type, could be "pie", "bar" or "area".
    model="yolo26n.pt",  # path to the YOLO26 model file
    # classes=[0, 2],  # display analytics for specific detection classes
)

# Process video
frame_count = 0
while cap.isOpened():
    success, im0 = cap.read()
    if success:
        frame_count += 1
        results = analytics(im0, frame_count)  # update analytics graph every frame

        # print(results)  # access the output

        out.write(results.plot_im)  # write the video file
    else:
        break

cap.release()
out.release()
cv2.destroyAllWindows()  # destroy all opened windows
Analytics 参数
以下表格概述了 Analytics 参数:
| 参数 | 类型 | 默认值 | 描述 |
|---|---|---|---|
model | str | None | Ultralytics YOLO 模型文件的路径。 |
analytics_type | str | 'line' | 图形类型,即 line, bar, area或 pie. |
您还可以利用不同的 track 中的参数 Analytics 解决方案。
| 参数 | 类型 | 默认值 | 描述 |
|---|---|---|---|
tracker | str | 'botsort.yaml' | 指定要使用的跟踪算法,例如: bytetrack.yaml 或 botsort.yaml. |
conf | float | 0.1 | 设置检测的置信度阈值;较低的值允许跟踪更多对象,但可能包含误报。 |
iou | float | 0.7 | 设置交并比 (IoU) 阈值,用于过滤重叠的检测结果。 |
classes | list | None | 按类别索引过滤结果。例如, classes=[0, 2, 3] 仅跟踪指定的类别。 |
verbose | bool | True | 控制跟踪结果的显示,提供被跟踪对象的可视化输出。 |
device | str | None | 指定用于推理的设备(例如, cpu, cuda:0 或 0)。允许用户在 CPU、特定 GPU 或其他计算设备之间进行选择,以执行模型。 |
此外,还支持以下可视化参数:
| 参数 | 类型 | 默认值 | 描述 |
|---|---|---|---|
show | bool | False | 可视化参数: True,则在窗口中显示带注释的图像或视频。这对于开发或测试期间的即时视觉反馈非常有用。 |
line_width | int or None | None | 指定边界框的线条宽度。 如果 None,则线条宽度会根据图像大小自动调整。 提供视觉自定义以提高清晰度。 |
结论
了解何时以及如何使用不同类型的可视化对于有效的数据分析至关重要。折线图、条形图和饼图是基本工具,可以帮助您更清晰有效地传达数据故事。Ultralytics YOLO26 Analytics 解决方案提供了一种简化的方式,可以从您的对象 detect和 track 结果中生成这些可视化,从而更容易从视觉数据中提取有意义的洞察。
常见问题
如何使用 Ultralytics YOLO26 Analytics 创建折线图?
要使用 Ultralytics YOLO26 Analytics 创建折线图,请遵循以下步骤:
- 加载 YOLO26 模型并打开您的视频文件。
- 初始化
Analytics类型设置为“line”的类。 - 迭代视频帧,使用相关数据(例如每帧的对象计数)更新折线图。
- 保存显示折线图的输出视频。
例子:
import cv2

from ultralytics import solutions

cap = cv2.VideoCapture("path/to/video.mp4")
assert cap.isOpened(), "Error reading video file"

w, h, fps = (int(cap.get(x)) for x in (cv2.CAP_PROP_FRAME_WIDTH, cv2.CAP_PROP_FRAME_HEIGHT, cv2.CAP_PROP_FPS))

out = cv2.VideoWriter(
    "ultralytics_analytics.avi",
    cv2.VideoWriter_fourcc(*"MJPG"),
    fps,
    (1280, 720),  # this is fixed
)

analytics = solutions.Analytics(
    analytics_type="line",
    show=True,
)

frame_count = 0
while cap.isOpened():
    success, im0 = cap.read()
    if success:
        frame_count += 1
        results = analytics(im0, frame_count)  # update analytics graph every frame
        out.write(results.plot_im)  # write the video file
    else:
        break

cap.release()
out.release()
cv2.destroyAllWindows()
有关配置 Analytics 类的更多详细信息,请访问 使用Ultralytics YOLO26进行分析 部分。
使用 Ultralytics YOLO26 创建条形图有哪些优势?
使用 Ultralytics YOLO26 创建条形图具有诸多优势:
- 实时数据可视化:将 对象检测 结果无缝集成到条形图中以进行动态更新。
- 易于使用:简单的 API 和函数使其易于实现和可视化数据。
- 自定义: 自定义标题、标签、颜色等,以满足您的特定需求。
- 高效性: 有效处理大量数据,并在视频处理过程中实时更新绘图。
使用以下示例生成条形图:
import cv2

from ultralytics import solutions

cap = cv2.VideoCapture("path/to/video.mp4")
assert cap.isOpened(), "Error reading video file"

w, h, fps = (int(cap.get(x)) for x in (cv2.CAP_PROP_FRAME_WIDTH, cv2.CAP_PROP_FRAME_HEIGHT, cv2.CAP_PROP_FPS))

out = cv2.VideoWriter(
    "ultralytics_analytics.avi",
    cv2.VideoWriter_fourcc(*"MJPG"),
    fps,
    (1280, 720),  # this is fixed
)

analytics = solutions.Analytics(
    analytics_type="bar",
    show=True,
)

frame_count = 0
while cap.isOpened():
    success, im0 = cap.read()
    if success:
        frame_count += 1
        results = analytics(im0, frame_count)  # update analytics graph every frame
        out.write(results.plot_im)  # write the video file
    else:
        break

cap.release()
out.release()
cv2.destroyAllWindows()
要了解更多信息,请访问指南中的条形图部分。
在我的数据可视化项目中,为什么应该使用 Ultralytics YOLO26 来创建饼图?
Ultralytics YOLO26 是创建饼图的绝佳选择,原因如下:
- 与对象检测集成: 将对象检测结果直接集成到饼图中,以获得即时洞察。
- 用户友好的 API: 设置和使用简单,只需最少的代码。
- 可定制: 各种颜色、标签等的自定义选项。
- 实时更新: 实时处理和可视化数据,非常适合视频分析项目。
这是一个快速示例:
import cv2

from ultralytics import solutions

cap = cv2.VideoCapture("path/to/video.mp4")
assert cap.isOpened(), "Error reading video file"

w, h, fps = (int(cap.get(x)) for x in (cv2.CAP_PROP_FRAME_WIDTH, cv2.CAP_PROP_FRAME_HEIGHT, cv2.CAP_PROP_FPS))

out = cv2.VideoWriter(
    "ultralytics_analytics.avi",
    cv2.VideoWriter_fourcc(*"MJPG"),
    fps,
    (1280, 720),  # this is fixed
)

analytics = solutions.Analytics(
    analytics_type="pie",
    show=True,
)

frame_count = 0
while cap.isOpened():
    success, im0 = cap.read()
    if success:
        frame_count += 1
        results = analytics(im0, frame_count)  # update analytics graph every frame
        out.write(results.plot_im)  # write the video file
    else:
        break

cap.release()
out.release()
cv2.destroyAllWindows()
有关更多信息,请参阅指南中的饼图部分。
Ultralytics YOLO26 可以用于 track 对象并动态更新可视化吗?
是的,Ultralytics YOLO26 可用于 track 对象并动态更新可视化。它支持实时 track 多个对象,并可根据 track 到的对象数据更新各种可视化,例如折线图、条形图和饼图。
用于跟踪和更新折线图的示例:
import cv2

from ultralytics import solutions

cap = cv2.VideoCapture("path/to/video.mp4")
assert cap.isOpened(), "Error reading video file"

w, h, fps = (int(cap.get(x)) for x in (cv2.CAP_PROP_FRAME_WIDTH, cv2.CAP_PROP_FRAME_HEIGHT, cv2.CAP_PROP_FPS))

out = cv2.VideoWriter(
    "ultralytics_analytics.avi",
    cv2.VideoWriter_fourcc(*"MJPG"),
    fps,
    (1280, 720),  # this is fixed
)

analytics = solutions.Analytics(
    analytics_type="line",
    show=True,
)

frame_count = 0
while cap.isOpened():
    success, im0 = cap.read()
    if success:
        frame_count += 1
        results = analytics(im0, frame_count)  # update analytics graph every frame
        out.write(results.plot_im)  # write the video file
    else:
        break

cap.release()
out.release()
cv2.destroyAllWindows()
要了解完整的功能,请参阅跟踪部分。
Ultralytics YOLO26 与 OpenCV 和 TensorFlow 等其他对象 detect 解决方案有何不同?
Ultralytics YOLO26 在众多对象 detect 解决方案中脱颖而出,例如 OpenCV 和 TensorFlow,原因如下:
- 最先进的精度:YOLO26 在对象 detect、segment 和分类任务中提供卓越的精度。
- 易于使用: 用户友好的 API 允许快速实施和集成,而无需大量的编码。
- 实时性能: 针对高速推理进行了优化,适用于实时应用。
- 多样化的应用: 支持各种任务,包括多对象跟踪、自定义模型训练以及导出为不同的格式,如 ONNX、TensorRT 和 CoreML。
- 全面的文档: 丰富的文档和博客资源,指导用户完成每个步骤。
有关更详细的比较和用例,请浏览我们的 Ultralytics 博客。


