通过YOLO26与TensorBoard的集成获取视觉洞察
深入了解训练过程,可以更直接地理解和微调 计算机视觉 模型,例如 Ultralytics 的 YOLO26。模型训练可视化有助于深入了解模型的学习模式、性能指标和整体行为。YOLO26 与 TensorBoard 的集成使可视化和分析过程更简单,并能对模型进行更高效、更明智的调整。
本指南涵盖了如何将 TensorBoard 与 YOLO26 结合使用。您将了解各种可视化功能,从跟踪指标到分析模型图。这些工具将帮助您更好地理解 YOLO26 模型的性能。
TensorBoard
TensorBoard 是 TensorFlow 的可视化工具包,对于 机器学习 实验至关重要。TensorBoard 具有一系列可视化工具,对于监控机器学习模型至关重要。这些工具包括跟踪损失和准确率等关键指标、可视化模型图以及查看权重和偏差随时间变化的直方图。它还提供将 embeddings 投影到较低维度空间和显示多媒体数据的功能。
使用TensorBoard训练YOLO26
在训练 YOLO26 模型时使用 TensorBoard 简单直接,并能带来显著益处。
安装
要安装所需的软件包,请运行:
安装
# Install the required package for YOLO26 and Tensorboard
pip install ultralytics
TensorBoard 已随 YOLO26 预安装,无需为可视化目的进行额外设置。
有关安装过程的详细说明和最佳实践,请务必查阅我们的YOLO26 安装指南。在安装 YOLO26 所需软件包时,如果遇到任何困难,请查阅我们的常见问题指南以获取解决方案和提示。
为 Google Colab 配置 TensorBoard
使用 Google Colab 时,务必在启动训练代码之前设置 TensorBoard:
为 Google Colab 配置 TensorBoard
%load_ext tensorboard
%tensorboard --logdir path/to/runs
用法
在深入了解使用说明之前,请务必查看 Ultralytics 提供的 YOLO26 模型系列。这将帮助您根据项目需求选择最合适的模型。
启用或禁用 TensorBoard
默认情况下,TensorBoard 日志记录处于禁用状态。 您可以使用以下命令启用或禁用日志记录 yolo settings 命令。
# Enable TensorBoard logging
yolo settings tensorboard=True

# Disable TensorBoard logging
yolo settings tensorboard=False
用法
from ultralytics import YOLO

# Load a pretrained model
model = YOLO("yolo26n.pt")

# Train the model
results = model.train(data="coco8.yaml", epochs=100, imgsz=640)
运行上述使用代码片段后,您应该会看到以下输出:
TensorBoard: Start with 'tensorboard --logdir path_to_your_tensorboard_logs', view at http://localhost:6006/
此输出表明 TensorBoard 正在积极监控您的 YOLO26 训练会话。您可以通过访问提供的 URL (http://localhost:6006/) 访问 TensorBoard 控制面板,以查看实时训练指标和模型性能。对于在 Google Colab 中工作的用户,TensorBoard 将显示在您执行 TensorBoard 配置命令的同一单元格中。
有关模型训练过程的更多信息,请务必查阅我们的 YOLO26 模型训练指南。如果您对日志记录、检查点、绘图和文件管理感兴趣,请阅读我们的 配置使用指南。
了解您的TensorBoard以进行YOLO26训练
现在,让我们重点了解在 YOLO26 训练背景下 TensorBoard 的各种特性和组件。TensorBoard 的三个关键部分是时间序列 (Time Series)、标量 (Scalars) 和图 (Graphs)。
时间序列
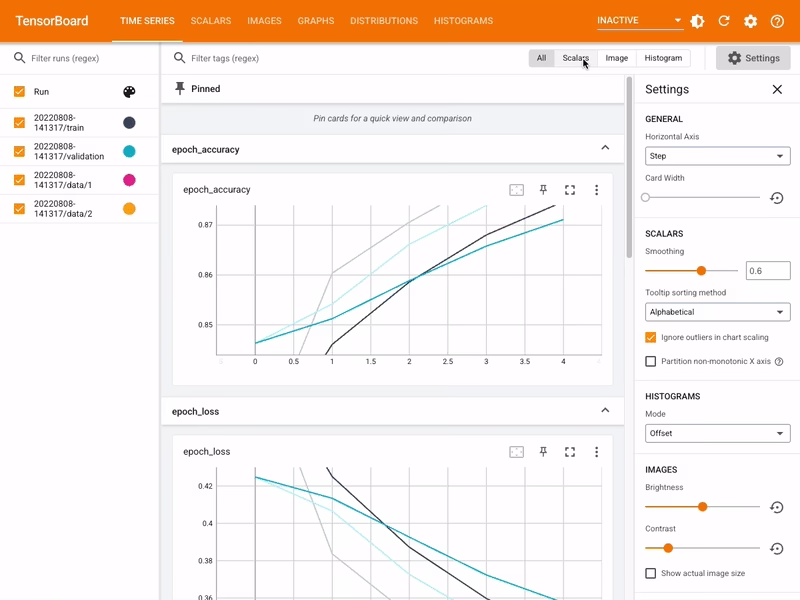
TensorBoard 中的时间序列 (Time Series) 功能为 YOLO26 模型提供了各种训练指标随时间变化的动态详细视图。它侧重于指标在训练周期 (epochs) 中的进展和趋势。以下是您可能看到的示例。
TensorBoard 中时间序列的主要特性
筛选标签和置顶卡片:此功能允许用户筛选特定指标和置顶卡片,以便快速比较和访问。它对于专注于训练过程的特定方面特别有用。
详细指标卡片:时间序列将指标分为不同的类别,如学习率(lr)、训练(train)和验证(val)指标,每个类别都由单独的卡片表示。
图形显示:时间序列部分中的每个卡片都显示了特定指标在训练过程中的详细图表。这种可视化表示有助于识别训练过程中的趋势、模式或异常。
深入分析:时间序列提供对每个指标的深入分析。例如,显示不同的学习率段,从而深入了解学习率调整如何影响模型的学习曲线。
时间序列在YOLO26训练中的重要性
时间序列 (Time Series) 部分对于全面分析 YOLO26 模型的训练进度至关重要。它允许您实时跟踪指标,以便及时识别和解决问题。它还提供了每个指标进展的详细视图,这对于微调模型和提升其性能至关重要。
标量
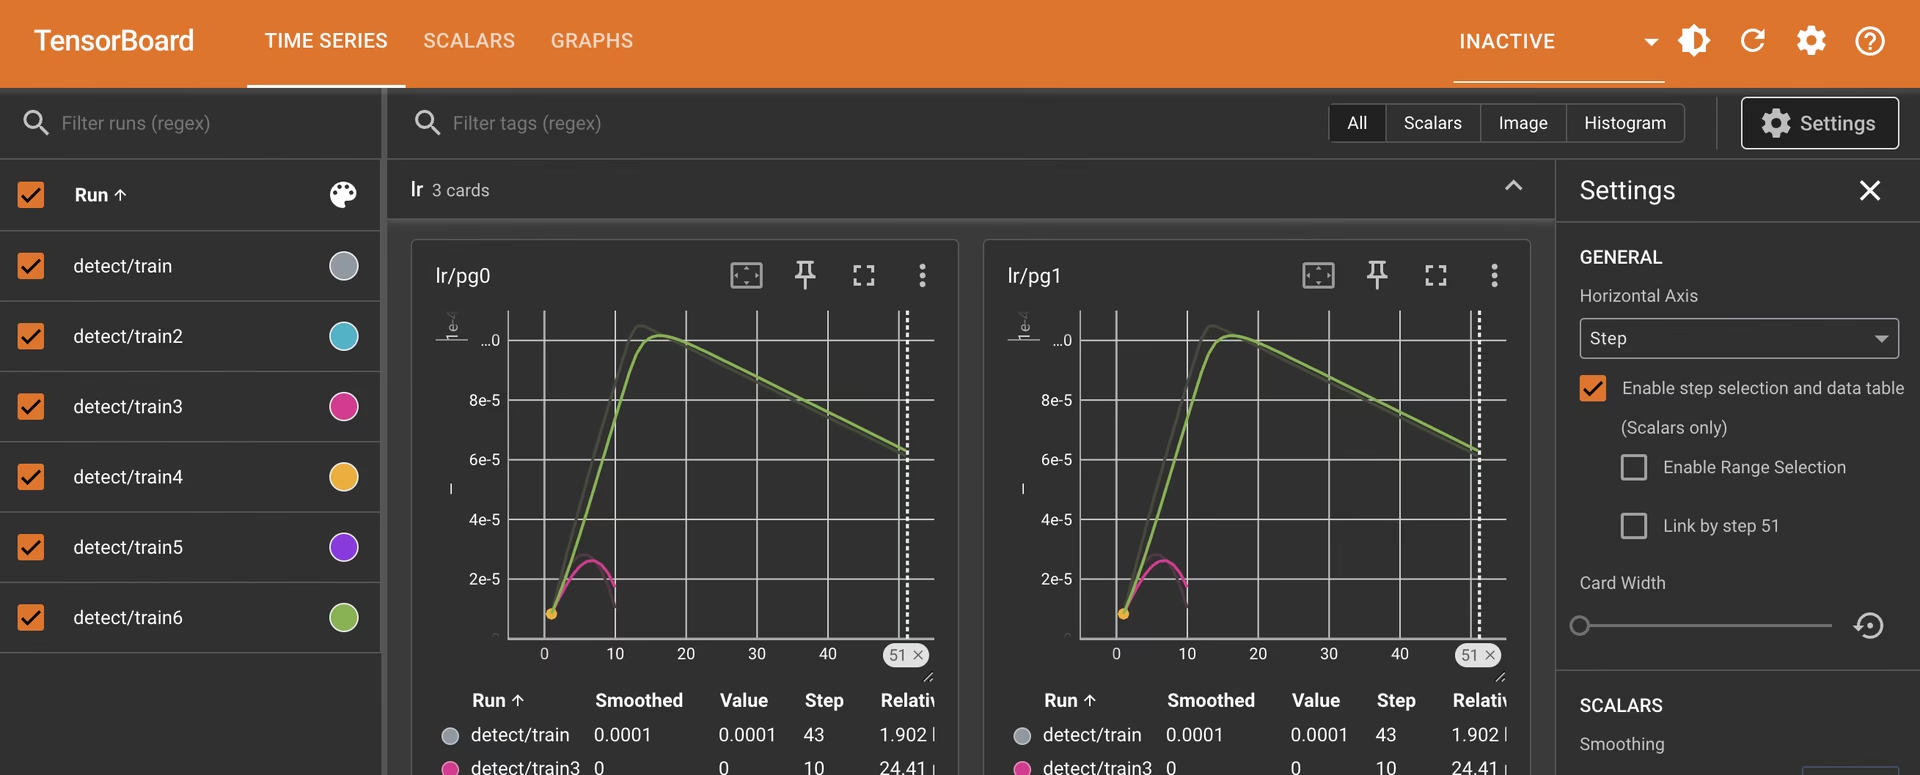
TensorBoard 中的标量 (Scalars) 对于在 YOLO26 模型训练期间绘制和分析损失 (loss) 和准确率 (accuracy) 等简单指标至关重要。它们清晰简洁地展示了这些指标如何随每个训练 周期 演变,从而深入了解模型的学习效率和稳定性。以下是您可能看到的示例。
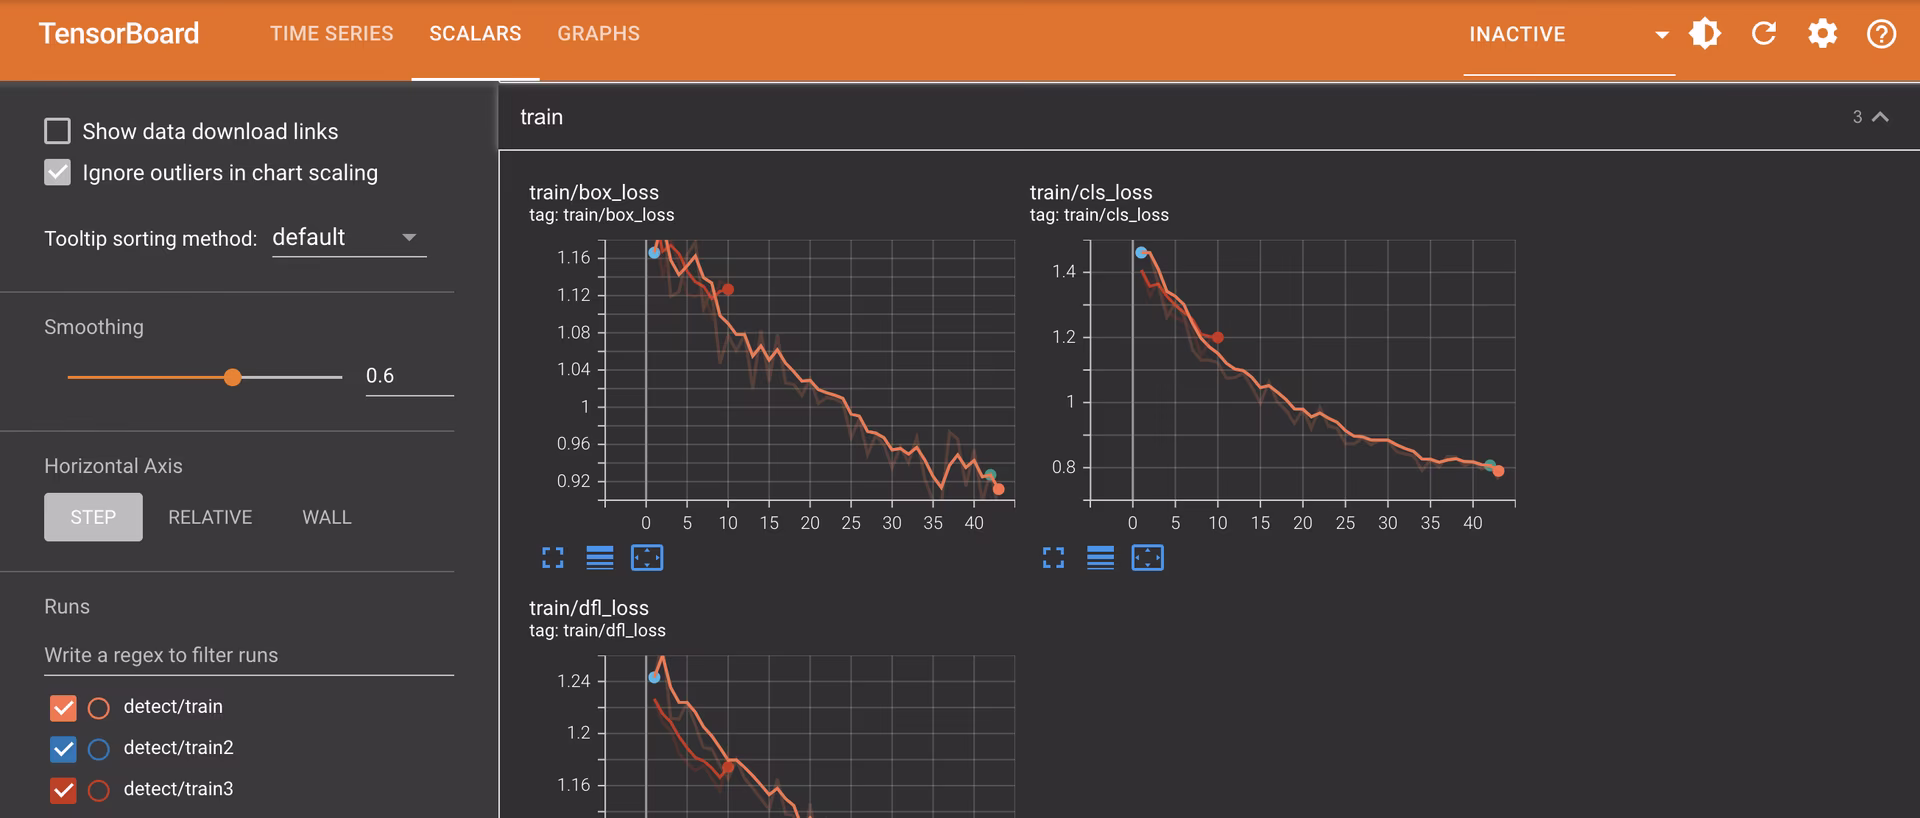
TensorBoard 中标量的主要特性
学习率 (lr) 标签:这些标签显示了不同段(例如,
pg0,pg1,pg2)中学习率的变化。这有助于我们了解学习率调整对训练过程的影响。指标标签:标量包括以下性能指标:
训练和验证标签(
train,val): 这些标签专门显示训练和验证数据集的指标,从而可以对不同数据集的模型性能进行比较分析。
监控标量的重要性
观察标量指标对于微调 YOLO26 模型至关重要。这些指标的变化,例如损失图中的尖峰或不规则模式,可以突出潜在问题,例如 过拟合、欠拟合 或不合适的学习率设置。通过密切监控这些标量,您可以做出明智的决策来优化训练过程,确保模型有效学习并达到预期性能。
标量和时间序列的区别
虽然 TensorBoard 中的 Scalars 和 Time Series 都用于跟踪指标,但它们的用途略有不同。Scalars 侧重于将损失和准确率等简单指标绘制为标量值。它们提供了这些指标如何随每个训练周期变化的高级概述。同时,TensorBoard 的时间序列部分提供了各种指标的更详细的时间线视图。它对于监控指标随时间的推移的进展和趋势特别有用,从而可以更深入地了解训练过程的细节。
图表
TensorBoard 的图 (Graphs) 部分可视化 YOLO26 模型的计算图,展示操作和数据如何在模型内部流动。它是理解模型结构的强大工具,可确保所有层正确连接,并识别数据流中的任何潜在瓶颈。以下是您可能看到的示例。
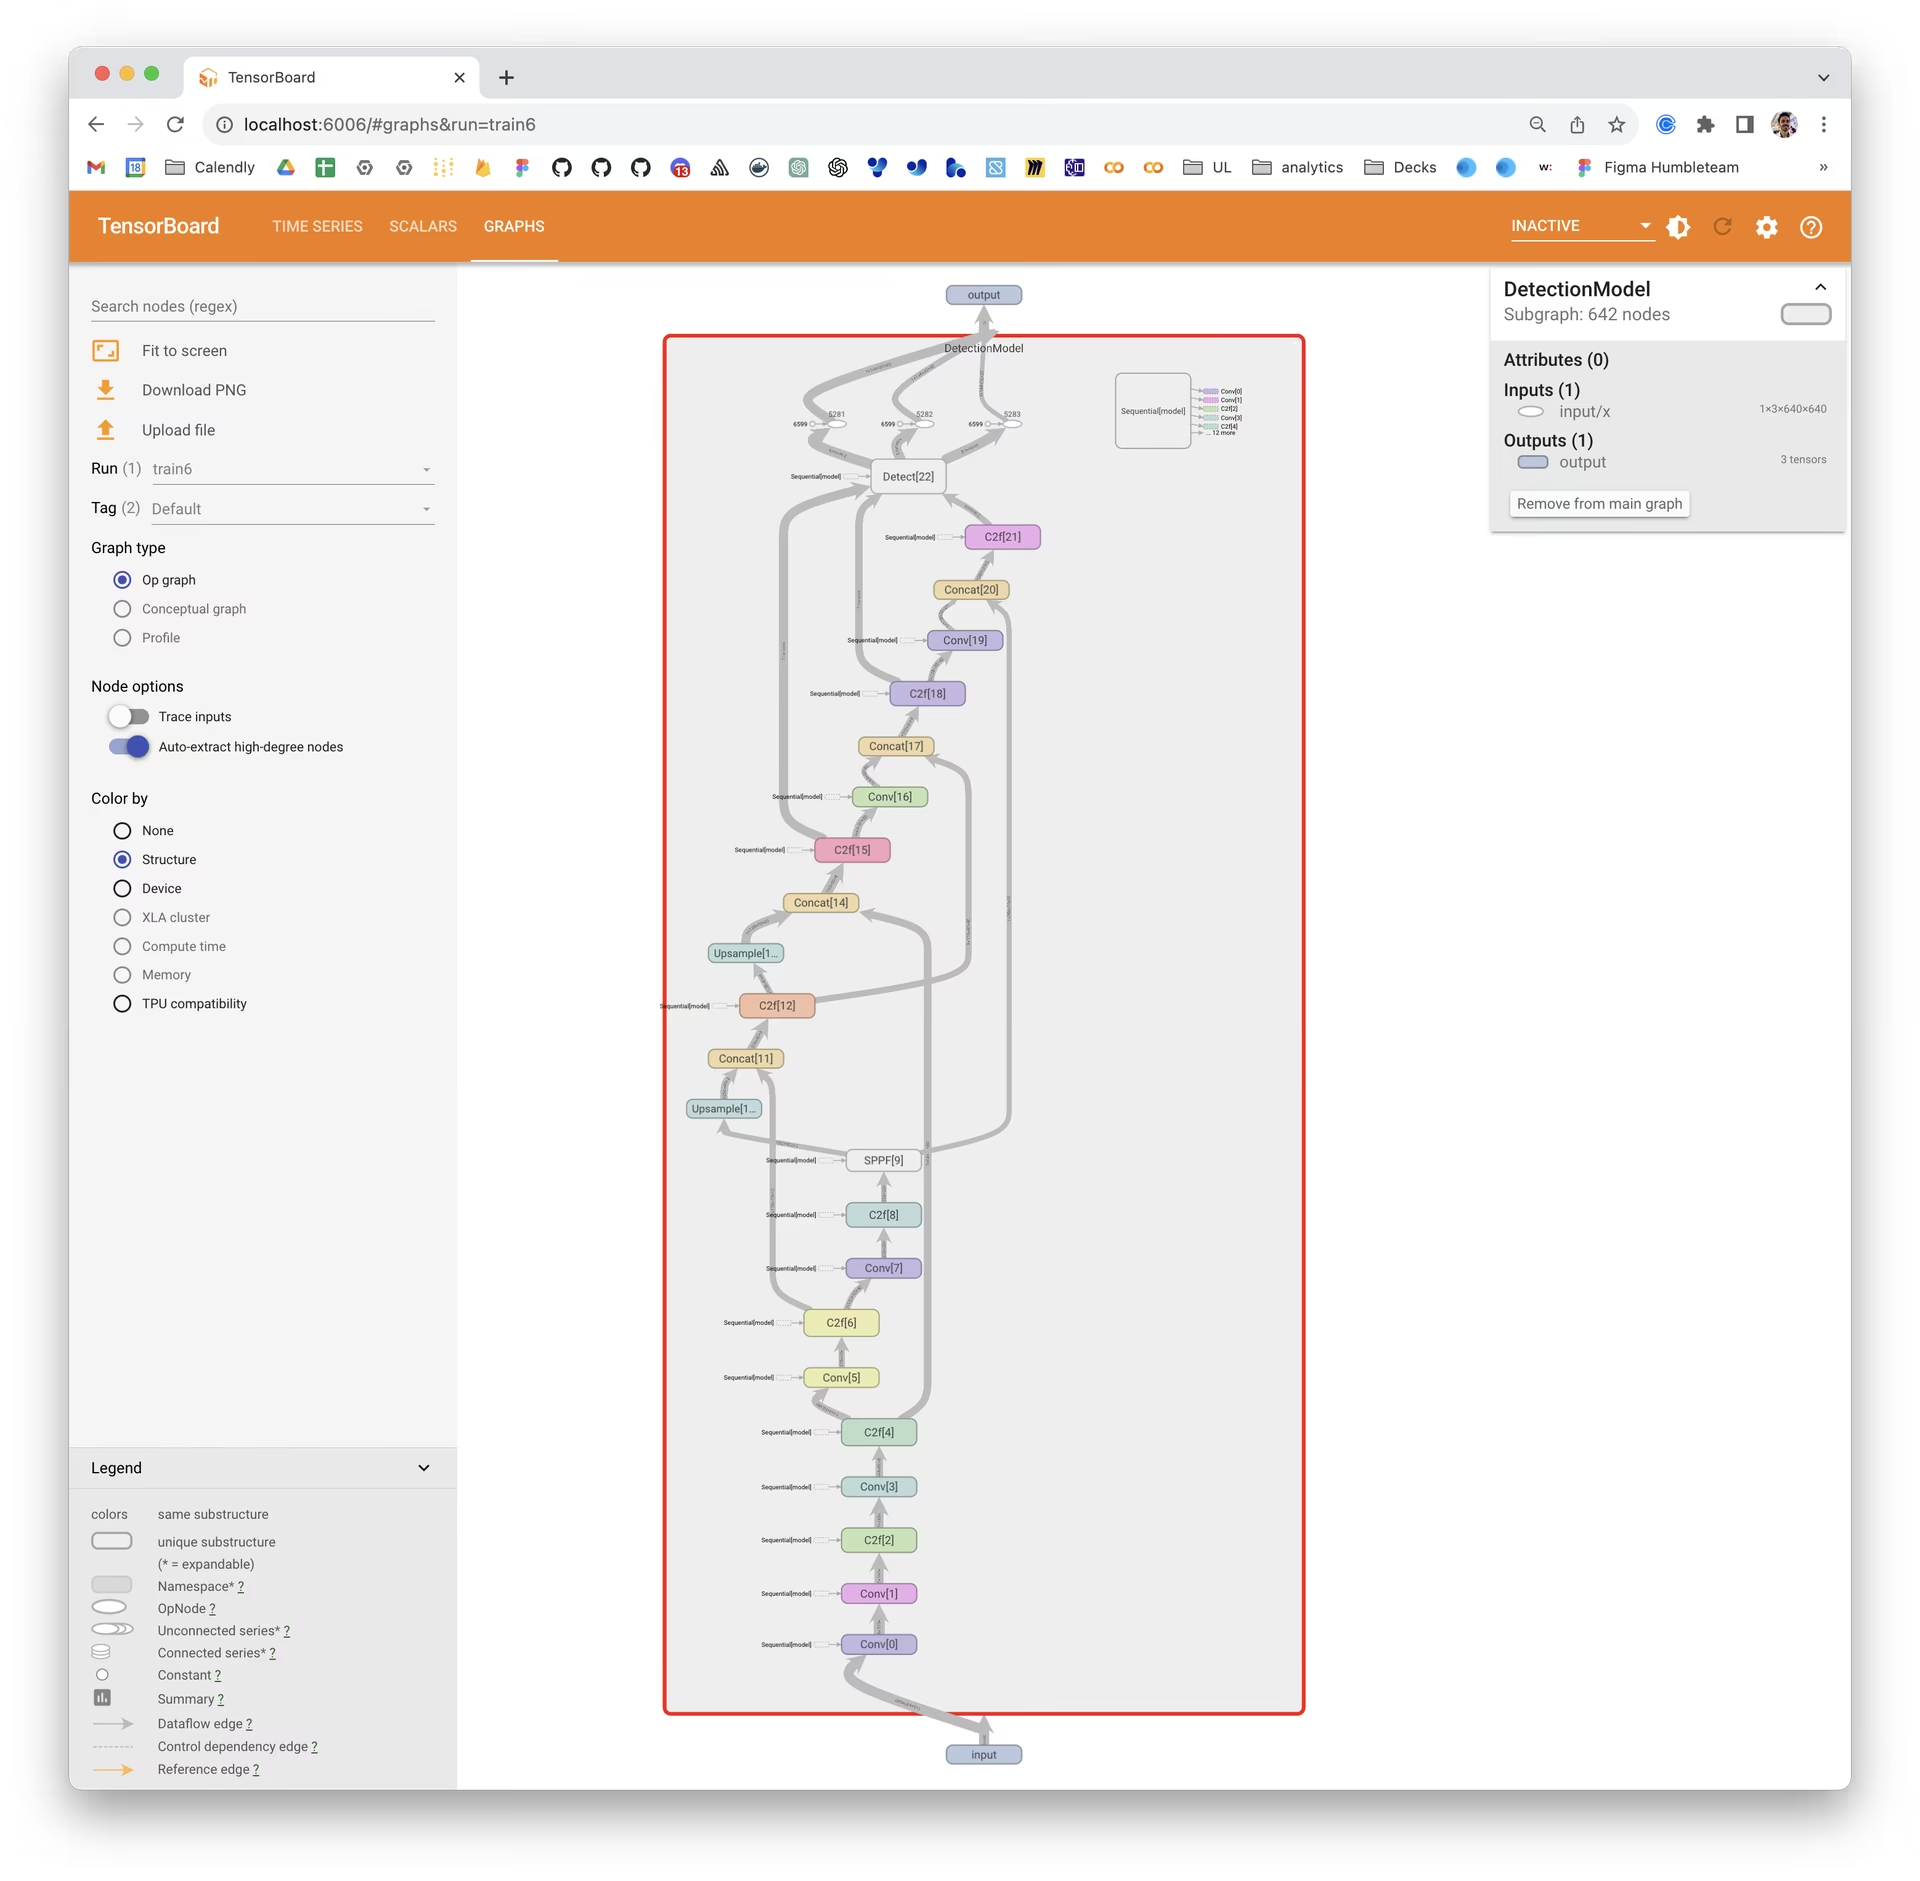
图对于模型调试特别有用,尤其是在 YOLO26 等 深度学习 模型中常见的复杂架构中。它们有助于验证层连接和模型的整体设计。
总结
本指南旨在帮助您将 TensorBoard 与 YOLO26 结合使用,以实现机器学习模型训练的可视化和分析。它侧重于解释 TensorBoard 的关键功能如何在 YOLO26 训练会话期间提供有关训练指标和模型性能的见解。
要更详细地了解这些功能和有效的使用策略,您可以参考 TensorFlow 的官方 TensorBoard 文档 及其 GitHub 存储库。
想要了解更多关于 Ultralytics 的各种集成吗?请查看 Ultralytics 集成指南页面,了解还有哪些令人兴奋的功能等待您去发现!
常见问题
将TensorBoard与YOLO26结合使用能带来哪些好处?
将 TensorBoard 与 YOLO26 结合使用,提供了高效模型训练所需的多种可视化工具:
- 实时指标跟踪: 实时跟踪损失、准确率、精确率和召回率等关键指标。
- 模型图可视化: 通过可视化计算图来理解和调试模型架构。
- 嵌入可视化: 将嵌入投影到较低维度的空间,以获得更好的洞察力。
这些工具使您能够做出明智的调整,以提升 YOLO26 模型的性能。有关 TensorBoard 功能的更多详细信息,请查阅 TensorFlow TensorBoard 指南。
在训练YOLO26模型时,如何使用TensorBoard监控训练指标?
要在使用 TensorBoard 训练 YOLO26 模型时监控训练指标,请遵循以下步骤:
- 安装 TensorBoard 和 YOLO26: 运行
pip install ultralytics其中包括 TensorBoard。 - 配置 TensorBoard 日志记录: 在训练过程中,YOLO26 会将指标记录到指定的日志目录。
- 启动 TensorBoard: 使用以下命令启动 TensorBoard
tensorboard --logdir path/to/your/tensorboard/logs.
可通过 http://localhost:6006/ 访问的 TensorBoard 控制面板,提供各种训练指标的实时洞察。要深入了解训练配置,请访问我们的 YOLO26 配置指南。
在训练YOLO26模型时,我可以使用TensorBoard可视化哪些指标?
在训练 YOLO26 模型时,TensorBoard 允许您可视化一系列重要指标,包括:
- 损失(训练和验证): 表示模型在训练和验证期间的性能。
- 准确率/精确率/召回率: 评估检测准确率的关键性能指标。
- 学习率: 跟踪学习率的变化,以了解其对训练动态的影响。
- mAP (平均精度均值): 用于在各种 IoU 阈值下全面评估目标检测的准确性。
这些可视化对于跟踪模型性能和进行必要的优化至关重要。有关这些指标的更多信息,请参阅我们的性能指标指南。
我可以在Google Colab环境中使用TensorBoard训练YOLO26吗?
是的,您可以在 Google Colab 环境中使用 TensorBoard 训练 YOLO26 模型。以下是快速设置方法:
为 Google Colab 配置 TensorBoard
%load_ext tensorboard
%tensorboard --logdir path/to/runs
然后,运行 YOLO26 训练脚本:
from ultralytics import YOLO

# Load a pretrained model
model = YOLO("yolo26n.pt")

# Train the model
results = model.train(data="coco8.yaml", epochs=100, imgsz=640)
TensorBoard 将在 Colab 中可视化训练进度,提供对损失 (loss) 和准确率 (accuracy) 等指标的实时洞察。有关配置 YOLO26 训练的更多详细信息,请参阅我们的详细 YOLO26 安装指南。


