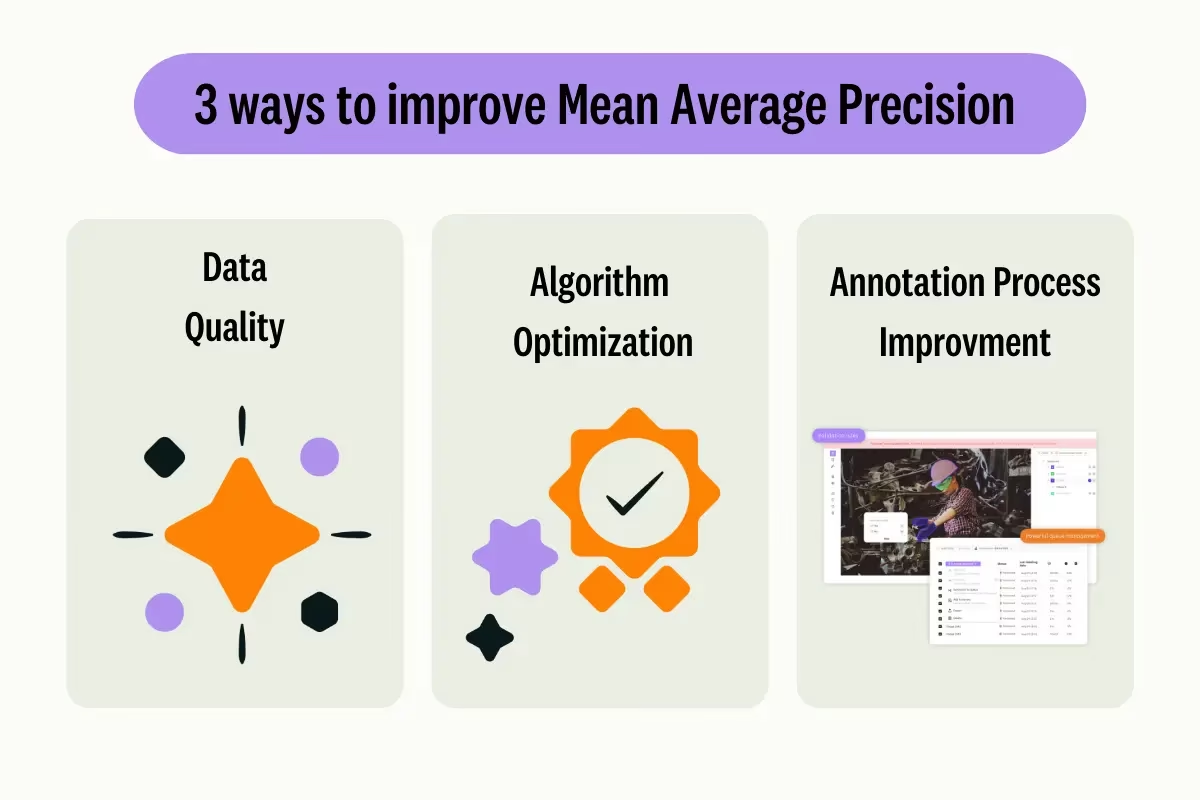
モデル評価と微調整に関する考察
はじめに
コンピュータービジョンモデルをトレーニングしたら、モデルを評価および改良して、最適なパフォーマンスを発揮させることが不可欠です。モデルをトレーニングするだけでは十分ではありません。モデルが正確で効率的であり、コンピュータービジョンプロジェクトの目的を達成していることを確認する必要があります。モデルを評価および微調整することにより、弱点を特定し、精度を向上させ、全体的なパフォーマンスを高めることができます。
見る: モデル評価とファインチューニングに関する考察 | 平均適合率を向上させるためのヒント
このガイドでは、モデル評価とファインチューニングに関する洞察を共有し、コンピュータービジョンプロジェクトのこのステップをより分かりやすくします。評価メトリクスの理解方法とファインチューニング技術の実装方法について説明し、モデルの機能を向上させるための知識を提供します。
指標を用いたモデル性能の評価
モデルの性能を評価することは、その効果を理解する上で役立ちます。性能を測るためには様々な指標が用いられます。これらの性能指標は、モデルが意図した目標を確実に達成できるように改善を導く、明確な数値による洞察を提供します。ここでは、いくつかの重要な指標について詳しく見ていきましょう。
信頼度スコア
信頼度スコアは、検出されたオブジェクトが特定のクラスに属するとモデルが確信する度合いを表します。0から1の範囲で、スコアが高いほど信頼度が高いことを示します。信頼度スコアは予測をフィルタリングするのに役立ち、指定された閾値を超える信頼度スコアを持つ検出のみが有効と見なされます。
ヒント: 推論を実行しているときに、予測が表示されず、他のすべてを確認した場合は、信頼性スコアを下げてみてください。閾値が高すぎるために、モデルが有効な予測を無視している場合があります。スコアを下げると、モデルはより多くの可能性を考慮できます。これはプロジェクトの目標を満たさないかもしれませんが、モデルが何ができるかを確認し、微調整の方法を決定するのに役立ちます。
Intersection over Union(IoU)
Intersection over Union(IoU)は、予測されたバウンディングボックスがグラウンドトゥルースバウンディングボックスとどの程度重なっているかを測定する物体detectのメトリックです。IoU値の範囲は0〜1で、1は完全に一致することを意味します。IoUは、予測された境界が実際のオブジェクトの境界とどれだけ密接に一致するかを測定するため、不可欠です。

平均適合率
Mean Average Precision(mAP)は、物体detectモデルのパフォーマンスを測定する方法です。各オブジェクトクラスをdetectする精度を調べ、これらのスコアを平均して、モデルがオブジェクトをどれだけ正確に識別およびclassifyできるかを示す全体的な数値を生成します。
2つの特定のmAPメトリクスに焦点を当てましょう。
- mAP@.5: IoU (Intersection over Union) の単一しきい値0.5における平均精度を測定します。このメトリクスは、モデルがより緩い精度要件でオブジェクトを正しく見つけられるかどうかをチェックします。オブジェクトが完璧な配置を必要とせず、おおよそ正しい場所にあるかどうかに焦点を当てます。モデルが一般的にオブジェクトの検出に優れているかどうかを確認するのに役立ちます。
- mAP@.5:.95: 0.5から0.95まで0.05刻みで、複数のIoUしきい値で計算されたmAP値を平均します。このメトリクスはより詳細で厳格です。モデルが異なる厳密さのレベルでオブジェクトをどの程度正確にdetectできるかについて、より全体像を提供し、特に正確なオブジェクト検出を必要とするアプリケーションに役立ちます。
その他のmAPメトリクスには、より厳密なIoUしきい値0.75を使用するmAP@0.75や、異なるサイズのオブジェクト全体の精度を評価するmAP@small、medium、largeなどがあります。

YOLO26モデルのパフォーマンス評価
YOLO26に関しては、検証モードを使用してモデルを評価できます。また、YOLO26のパフォーマンス指標とその解釈方法について深く掘り下げたガイドもぜひご覧ください。
コミュニティでよくある質問
YOLO26モデルを評価する際、いくつかの問題に直面するかもしれません。コミュニティでよくある質問に基づいて、YOLO26モデルを最大限に活用するためのヒントをいくつかご紹介します。
可変画像サイズの処理
異なるサイズの画像でYOLO26モデルを評価することで、多様なデータセットにおけるそのパフォーマンスを理解するのに役立ちます。 rect=true validationパラメータを使用すると、YOLO26は画像サイズに基づいて各バッチのネットワークのストライドを調整し、モデルが長方形の画像を単一のサイズに強制することなく処理できるようにします。
The imgsz validation パラメータは、画像のリサイズにおける最大寸法を設定します。デフォルトでは640です。これは、データセットの最大寸法と利用可能なGPUメモリに基づいて調整できます。 imgsz セット, rect=true モデルがストライドを動的に調整することで、さまざまな画像サイズを効果的に管理できるようにします。
YOLO26指標へのアクセス
YOLO26モデルのパフォーマンスをより深く理解したい場合は、数行のPythonコードで特定の評価指標に簡単にアクセスできます。以下のコードスニペットを使用すると、モデルをロードし、評価を実行し、モデルの性能を示す様々な指標を出力できます。
使用法
from ultralytics import YOLO

# Load the model
model = YOLO("yolo26n.pt")

# Run the evaluation
results = model.val(data="coco8.yaml")

# Print specific metrics
print("Class indices with average precision:", results.ap_class_index)
print("Average precision for all classes:", results.box.all_ap)
print("Average precision:", results.box.ap)
print("Average precision at IoU=0.50:", results.box.ap50)
print("Class indices for average precision:", results.box.ap_class_index)
print("Class-specific results:", results.box.class_result)
print("F1 score:", results.box.f1)
print("F1 score curve:", results.box.f1_curve)
print("Overall fitness score:", results.box.fitness)
print("Mean average precision:", results.box.map)
print("Mean average precision at IoU=0.50:", results.box.map50)
print("Mean average precision at IoU=0.75:", results.box.map75)
print("Mean average precision for different IoU thresholds:", results.box.maps)
print("Mean results for different metrics:", results.box.mean_results)
print("Mean precision:", results.box.mp)
print("Mean recall:", results.box.mr)
print("Precision:", results.box.p)
print("Precision curve:", results.box.p_curve)
print("Precision values:", results.box.prec_values)
print("Specific precision metrics:", results.box.px)
print("Recall:", results.box.r)
print("Recall curve:", results.box.r_curve)
結果オブジェクトには、前処理時間、推論時間、損失、後処理時間などの速度指標も含まれています。これらの指標を分析することで、YOLO26モデルをファインチューニングしてパフォーマンスを向上させ、特定のユースケースにより効果的に活用できます。
ファインチューニングはどのように機能しますか?
ファインチューニングとは、事前学習済みのモデルを取得し、特定のタスクまたはデータセットでのパフォーマンスを向上させるためにそのパラメーターを調整することです。モデルの再トレーニングとも呼ばれるこのプロセスにより、モデルは実世界のアプリケーションで遭遇する特定のデータをよりよく理解し、結果を予測できるようになります。モデル評価に基づいてモデルを再トレーニングし、最適な結果を達成できます。
モデルを微調整するためのヒント
モデルのファインチューニングとは、最適なパフォーマンスを達成するために、いくつかの重要なパラメータとテクニックに細心の注意を払うことを意味します。ここでは、そのプロセスをガイドする上で不可欠なヒントをいくつかご紹介します。
より高い学習率で開始
通常、初期トレーニングのエポック中、学習率は低く始まり、トレーニングプロセスを安定させるために徐々に増加します。ただし、モデルが以前のデータセットからいくつかの特徴をすでに学習しているため、より高い学習率ですぐに開始する方が有益な場合があります。
YOLO26モデルを評価する際、 warmup_epochs validation パラメータを warmup_epochs=0 学習率が低すぎる状態から開始するのを防ぐためです。このプロセスに従うことで、トレーニングは提供された重みから継続され、新しいデータのニュアンスに合わせて調整されます。
小さいオブジェクトのための画像のタイル分割
画像タイリングは、小さなオブジェクトのdetect精度を向上させることができます。1280x1280の画像を複数の640x640セグメントに分割するなど、大きな画像を小さなセグメントに分割することで、元の解像度を維持し、モデルは高解像度のフラグメントから学習できます。YOLO26を使用する際は、これらの新しいセグメントに合わせてラベルを正しく調整してください。
コミュニティとの連携
あなたのアイデアや質問を他のコンピュータビジョン愛好家と共有することで、あなたのプロジェクトの障害に対する創造的な解決策を刺激することができます。ここでは、学習、トラブルシューティング、接続するためのいくつかの優れた方法を紹介します。
ヘルプとサポート
- GitHub Issues: YOLO26のGitHubリポジトリを探索し、Issuesタブを使用して質問したり、バグを報告したり、機能を提案したりできます。コミュニティとメンテナーが、発生したあらゆる問題の解決をサポートします。
- Ultralytics Discordサーバー: Ultralytics Discordサーバーに参加して、他のユーザーや開発者と繋がり、サポートを受けたり、知識を共有したり、アイデアを出し合ったりしましょう。
公式ドキュメント
- Ultralytics YOLO26ドキュメント: さまざまなコンピュータービジョンタスクやプロジェクトに関する包括的なガイドと貴重な洞察については、公式YOLO26ドキュメントをご覧ください。
まとめ
コンピュータビジョンモデルの評価と微調整は、モデルのデプロイを成功させるための重要なステップです。これらのステップは、モデルが正確で効率的であり、アプリケーション全体に適していることを確認するのに役立ちます。可能な限り最高のモデルをトレーニングするための鍵は、継続的な実験と学習です。パラメーターを微調整したり、新しいテクニックを試したり、さまざまなデータセットを探索したりすることを躊躇しないでください。実験を続け、可能性の限界を押し広げてください!
よくある質問
YOLO26モデルのパフォーマンスを評価するための主要な指標は何ですか?
YOLO26モデルのパフォーマンスを評価するには、信頼度スコア、Intersection over Union (IoU)、およびMean Average Precision (mAP) などの重要な指標があります。信頼度スコアは、detectされた各オブジェクトクラスに対するモデルの確信度を測定します。IoUは、予測されたバウンディングボックスがグラウンドトゥルースとどの程度重なっているかを評価します。Mean Average Precision (mAP) は、クラス全体の精度スコアを集計し、mAP@.5とmAP@.5:.95は、さまざまなIoUしきい値に対する2つの一般的なタイプです。これらの指標の詳細については、YOLO26パフォーマンス指標ガイドをご覧ください。
特定のデータセット向けに事前学習済みYOLO26モデルをファインチューニングするにはどうすればよいですか?
事前学習済みYOLO26モデルのファインチューニングには、特定のタスクまたはデータセットでのパフォーマンスを向上させるために、そのパラメーターを調整することが含まれます。まず、指標を使用してモデルを評価し、次に warmup_epochs パラメータを0に設定すると、すぐに安定します。のようなパラメータを使用してください。 rect=true さまざまな画像サイズを効果的に処理するために、当社のセクションを参照してください。 YOLO26モデルのファインチューニング.
YOLO26モデルを評価する際に、可変画像サイズをどのように処理すればよいですか?
評価中に可変画像サイズを処理するには、以下を使用します rect=true YOLO26のパラメーター。これは、画像サイズに基づいて各バッチのネットワークのストライドを調整します。 imgsz パラメータは、画像のリサイズにおける最大寸法を設定し、デフォルトは640です。このパラメータを調整すると、 imgsz データセットとGPUメモリに合わせて調整するには。詳細については、こちらをご覧ください。 可変画像サイズの処理に関するセクション.
YOLO26モデルのmAP (Mean Average Precision) を向上させるために、どのような実践的なステップを踏むことができますか?
YOLO26モデルのmAP (Mean Average Precision) を向上させるには、いくつかのステップがあります。
- ハイパーパラメータの調整: さまざまな学習率、バッチサイズ、および画像拡張を試してください。
- Data Augmentation: MosaicやMixUpなどのテクニックを使用して、多様なトレーニングサンプルを作成します。
- 画像タイリング: 小さなオブジェクトの検出精度を向上させるために、大きな画像を小さなタイルに分割します。特定の戦略については、モデルのファインチューニングに関する詳細ガイドを参照してください。
PythonでYOLO26モデルの評価指標にアクセスするにはどうすればよいですか?
以下の手順でpythonを使用してYOLO26モデルの評価指標にアクセスできます。
使用法
from ultralytics import YOLO

# Load the model
model = YOLO("yolo26n.pt")

# Run the evaluation
results = model.val(data="coco8.yaml")

# Print specific metrics
print("Class indices with average precision:", results.ap_class_index)
print("Average precision for all classes:", results.box.all_ap)
print("Mean average precision at IoU=0.50:", results.box.map50)
print("Mean recall:", results.box.mr)
これらの指標を分析することで、YOLO26モデルのファインチューニングと最適化に役立ちます。詳細については、YOLO26指標に関するガイドをご覧ください。