التحليلات باستخدام Ultralytics YOLO26
تحوّل التحليلات باستخدام Ultralytics YOLO26 نتائج اكتشاف الكائنات وتتبعها إلى مخططات آنية، لتتمكن من متابعة تغيّر أعداد الكائنات في إطارات الفيديو تباعًا. يغطي هذا الدليل أربعة أنواع من تصور البيانات — المخططات الخطية، ومخططات الأعمدة، والمخططات الدائرية، والمخططات المساحية — ويوضح كيفية التبديل بينها باستخدام أمثلة مشتركة لـ Python وCLI.
شاهد: كيفية إنشاء رسوم بيانية تحليلية باستخدام Ultralytics | الرسوم الخطية والعمودية والمخططات المساحية والدائرية
نماذج مرئية#
| مخطط خطي | مخطط أعمدة | مخطط دائري |
|---|---|---|
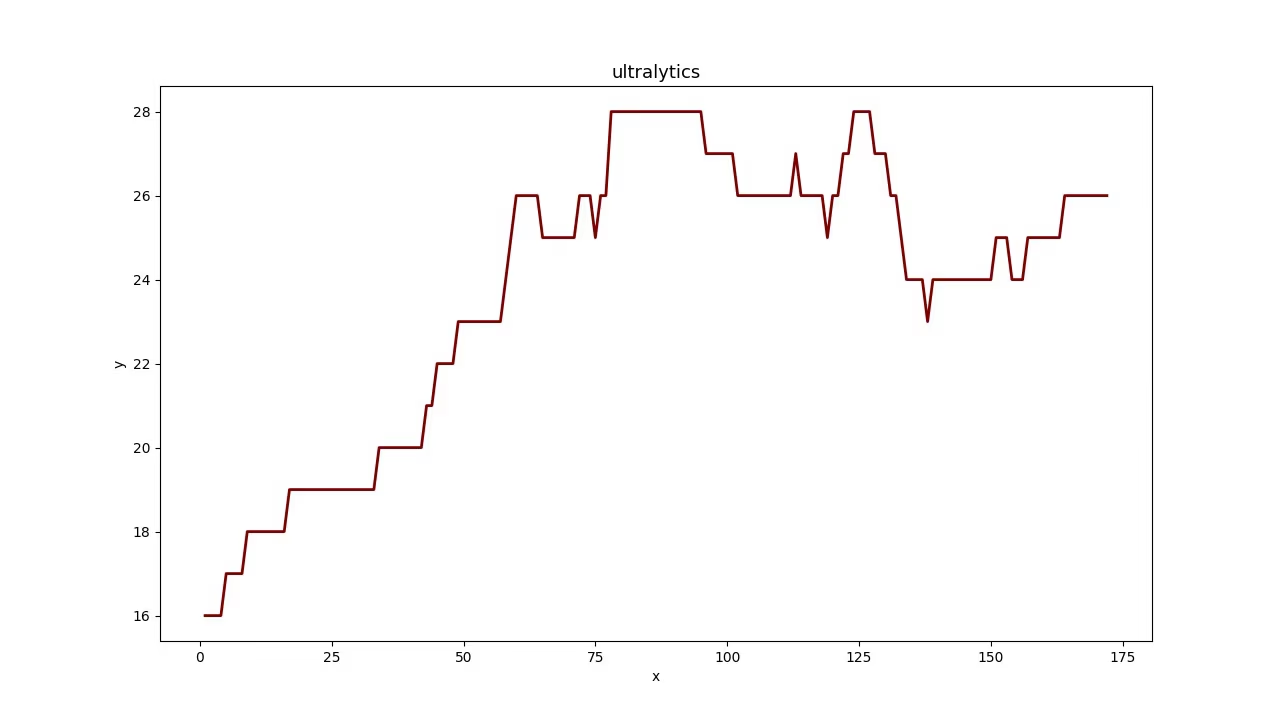 | 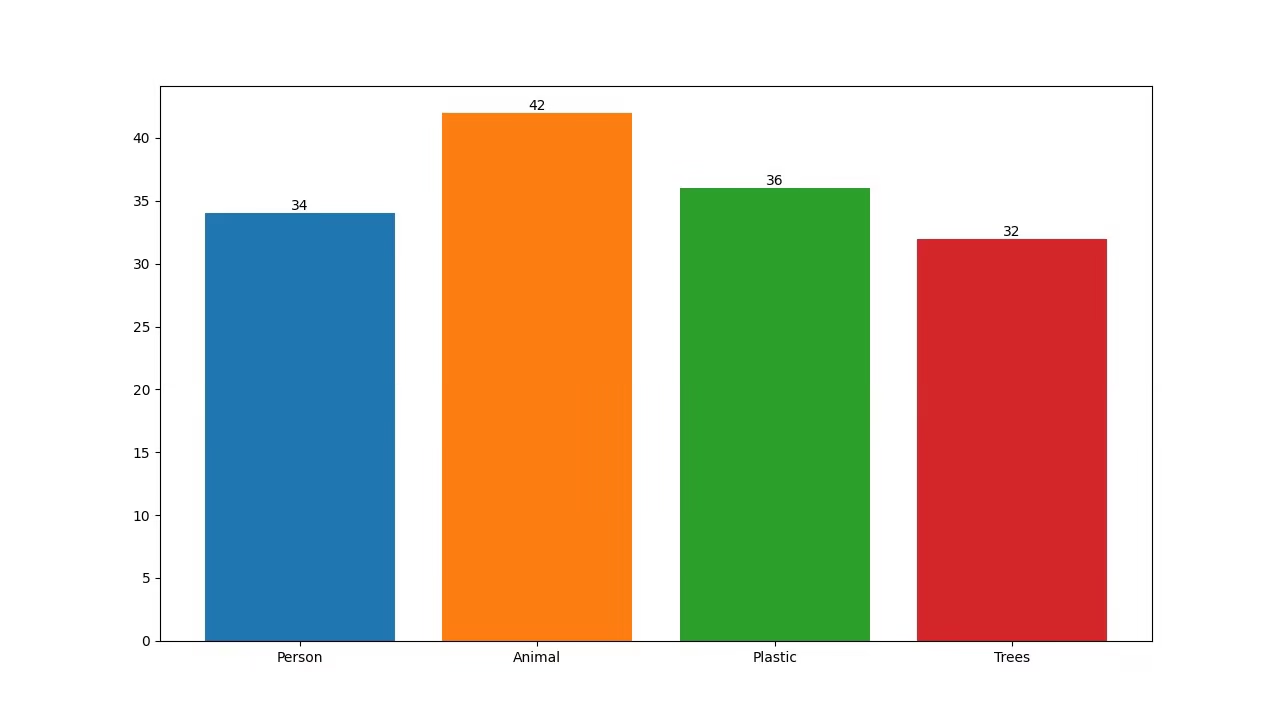 | 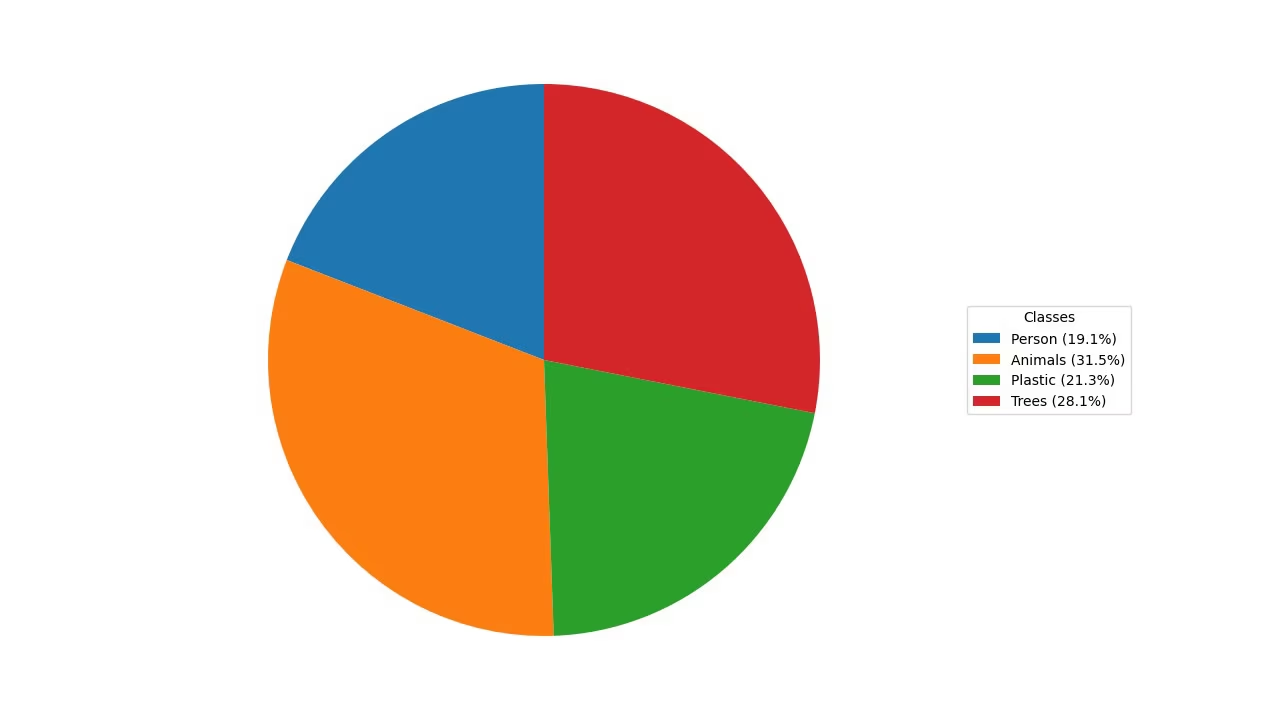 |
لماذا نتصور بيانات الاكتشاف؟#
- تُعد المخططات الخطية مثالية لتتبع التغيّرات على المديين القصير والطويل، ولمقارنة التغيّرات بين مجموعات متعددة خلال الفترة نفسها.
- تناسب مخططات الأعمدة مقارنة الكميات بين الفئات المختلفة وإظهار العلاقات بين الفئة وقيمتها العددية.
- تُعد المخططات الدائرية فعالة في توضيح النسب بين الفئات وعرض الأجزاء من الكل.
- تملأ المخططات المساحية المساحة أسفل المخطط الخطي، ما يسهّل قراءة أعداد الكائنات لكل فئة بمرور الوقت بنظرة سريعة.
إنشاء المخططات التحليلية#
مرّر الفيديو إلى حل Analytics وحدد مخططًا باستخدام analytics_type. ينفّذ الحل الاكتشاف والتتبع في كل إطار، ويعرض مخططًا بأبعاد 1280×720 (افتراضيًا) يمكنك كتابته مباشرةً في فيديو ناتج. بدّل بين "line" و"bar" و"pie" و"area" باستخدام وسيطة واحدة.
yolo solutions analytics show=True

# Pass the source
yolo solutions analytics source="path/to/video.mp4"

# Generate the pie chart
yolo solutions analytics analytics_type="pie" show=True

# Generate the bar plots
yolo solutions analytics analytics_type="bar" show=True

# Generate the area plots
yolo solutions analytics analytics_type="area" show=True
وسيطات Analytics#
إليك جدولًا يوضح وسيطات Analytics:
| المعامل | النوع | الافتراضي | الوصف |
|---|---|---|---|
model | str | None | مسار ملف نموذج Ultralytics YOLO. |
analytics_type | str | 'line' | نوع المخطط، مثل line أو bar أو area أو pie. |
figsize | tuple[float, float] | (12.8, 7.2) | حجم الشكل بالبوصة لمخططات Analytics؛ يعرض (12.8, 7.2) إطارًا بدقة 1280×720. |
line_width | int | 2 | سماكة الخط للصناديق والنقاط المفتاحية والعدادات التي يرسمها الحل. |
verbose | bool | True | يفعّل سجل الحل لكل إطار، ويشمل شكل المدخل وعدد الفئات وسرعة المعالجة. يظل استدعاء التتبع نفسه صامتًا دائمًا. |
يمكنك أيضًا استخدام الوسائط track ضمن حل Analytics.
| المعامل | النوع | الافتراضي | الوصف |
|---|---|---|---|
tracker | str | 'tracktrack.yaml' | يحدد خوارزمية التتبع المطلوب استخدامها. الخيارات المضمنة: botsort.yaml، bytetrack.yaml، ocsort.yaml، deepocsort.yaml، fasttrack.yaml، tracktrack.yaml. |
conf | float | 0.25 | يضبط عتبة الثقة للكشوفات؛ إذ تسمح القيم الأقل بتتبع مزيد من الكائنات، لكنها قد تتضمن إيجابيات كاذبة. |
iou | float | 0.5 | يضبط عتبة التقاطع على الاتحاد (IoU) لتصفية الكشوفات المتداخلة. |
classes | list | None | يصفّي النتائج حسب فهرس الفئة. على سبيل المثال، لا يتتبع classes=[0, 2, 3] إلا الفئات المحددة. |
device | str | None | يحدد الجهاز المستخدم للاستدلال (مثل cpu أو cuda:0 أو 0). ويتيح للمستخدمين الاختيار بين CPU أو GPU محددة أو أجهزة حوسبة أخرى لتنفيذ النموذج. |
imgsz | int or tuple | 640 | حجم صورة الاستدلال المستهدف: عدد صحيح لصورة مربعة، أو زوج (height, width). تُعدّل الأبعاد وفقًا لخطوة النموذج. |
max_det | int | 300 | الحد الأقصى لعدد الكشوفات التي يُحتفظ بها لكل إطار قبل التتبع، ما يحد من عدد الكائنات التي يعالجها الحل في المشاهد الكثيفة. |
quantize | int or str | None | دقة الاستدلال: 16 (FP16) أو 32/unset (FP32) لنماذج PyTorch وTorchScript خارج CPU؛ أما التنسيقات الأخرى فتستخدم الدقة التي يحددها الملف الاصطناعي وبيئة التشغيل. يحل هذا الوسيط محل الوسيطة half المهملة. |
بالإضافة إلى ذلك، تُدعَم وسيطات التصور التالية:
| المعامل | النوع | الافتراضي | الوصف |
|---|---|---|---|
show | bool | False | إذا كان True، يعرض الصور أو مقاطع الفيديو المشروحة في نافذة. يفيد ذلك في الحصول على ملاحظات مرئية فورية أثناء التطوير أو الاختبار. |
الخلاصة#
يُعد فهم توقيت استخدام أنواع التصورات المختلفة وكيفيته أمرًا بالغ الأهمية لتحليل البيانات بفاعلية. فالرسوم البيانية الخطية والمخططات الشريطية والرسوم الدائرية والمخططات المساحية أدوات أساسية تساعدك على عرض قصة بياناتك بوضوح وفاعلية أكبر. ويوفر حل التحليلات في Ultralytics YOLO26 طريقة مبسطة لإنشاء هذه التصورات من نتائج اكتشاف الكائنات وتتبعها، ما يسهل استخلاص رؤى مفيدة من بياناتك المرئية.
الأسئلة الشائعة#
لإنشاء مخطط خطي باستخدام Ultralytics YOLO26 Analytics، اتبع الخطوات التالية:
- حمّل نموذج YOLO26 وافتح ملف الفيديو.
- هيّئ الفئة
Analyticsباستخدامanalytics_type="line". - كرّر العملية على إطارات الفيديو، مع استدعاء الحل في كل إطار لتحديث المخطط الخطي ببيانات مثل أعداد الكائنات.
- اكتب
results.plot_imإلى فيديو ناتج لحفظ المخطط.
استخدم مثال Python أعلاه نقطةَ انطلاق — فهو ينفّذ بالفعل حلقة الإطارات كاملةً، والمخطط الخطي هو
analytics_typeالافتراضي.يوفر استخدام Ultralytics YOLO26 لإنشاء مخططات الأعمدة عدة فوائد:
- تصور البيانات في الوقت الفعلي: دمج نتائج اكتشاف الكائنات في مخططات شريطية لتحديثها ديناميكيًا.
- سهولة الاستخدام: تتيح واجهة API والدوال البسيطة تنفيذ العملية وتصوير البيانات بسهولة.
- التخصيص: خصّص العناوين والتسميات والألوان وغير ذلك لتلبية متطلباتك المحددة.
- الكفاءة: معالجة كميات كبيرة من البيانات بكفاءة وتحديث المخططات في الوقت الفعلي أثناء معالجة الفيديو.
لإنشاء مخطط أعمدة، اضبط
analytics_type="bar"في مثال Python أعلاه — فبقية حلقة الإطارات مطابقة. راجع قسم النماذج المرئية للاطلاع على معاينة.يُعد Ultralytics YOLO26 خيارًا ممتازًا لإنشاء المخططات الدائرية للأسباب التالية:
- التكامل مع اكتشاف الكائنات: ادمج نتائج اكتشاف الكائنات مباشرةً في المخططات الدائرية للحصول على رؤى فورية.
- واجهة API سهلة الاستخدام: سهلة الإعداد والاستخدام، ولا تتطلب سوى قدر ضئيل من التعليمات البرمجية.
- قابلية التخصيص: تتوفر خيارات تخصيص متعددة للألوان والتسميات وغير ذلك.
- التحديثات في الوقت الفعلي: معالجة البيانات وتصوّرها في الوقت الفعلي، وهو أمر مثالي لمشاريع تحليل الفيديو.
لإنشاء مخطط دائري، اضبط
analytics_type="pie"في مثال Python أعلاه. لمزيد من المعلومات، راجع قسم النماذج المرئية في الدليل.نعم. التتبع مضمّن في حل
Analytics: فهو يتتبع كائنات متعددة في الوقت الفعلي ويحدّث المخطط من بيانات الكائنات المتتبَّعة كل 30 إطارًا، لذا تعكس المخططات الخطية ومخططات الأعمدة والمخططات الدائرية والمخططات المساحية الأعداد المباشرة. وهذا بالضبط ما تفعله حلقة الإطارات في مثال Python أعلاه. لمعرفة المزيد عن وظيفة التتبع الأساسية، راجع قسم التتبع.يتميز Ultralytics YOLO26 عن حلول اكتشاف الكائنات الأخرى مثل OpenCV وTensorFlow لعدة أسباب:
- دقة رائدة: يوفّر YOLO26 دقة فائقة في مهام اكتشاف الكائنات وتجزئة المثيلات والتجزئة الدلالية والتصنيف.
- سهولة الاستخدام: تتيح واجهة API سهلة الاستخدام التنفيذ والتكامل بسرعة من دون الحاجة إلى كتابة قدر كبير من التعليمات البرمجية.
- الأداء في الوقت الفعلي: مُحسّن للاستدلال عالي السرعة، ما يجعله مناسبًا للتطبيقات الفورية.
- تطبيقات متنوعة: يدعم تتبع كائنات متعددة وتدريب نماذج مخصصة والتصدير إلى تنسيقات مختلفة مثل ONNX وTensorRT وCoreML.
- وثائق شاملة: تتوفر وثائق وموارد مدونة وافرة لإرشاد المستخدمين في كل خطوة.


التعليقات17
اطرح سؤالًا، وشارك نتائجك، أو ساعد شخصًا آخر.
 User
Hello @glenn-jocher How we can optimize/modify the code for YOLO predict, so it can also give final compiled result of prediction as graph. In case of counting objects/cells classed as different categories in images stored in a root folder. Not just the images with the prediction boxes.
yolo train model=yolo11n.pt data=coco8.yaml epochs=100 imgsz=640
yolo predict model=yolo11n.pt source=path/to/bus.jpg
Like the count graph YOLO makes after training or bar/pie chart?
Thanks
- User
@pderrenger Greetings
- User
Hello,
In relation to the above question, will this code work?
#!/usr/bin/env python3 """ yolo_predict_results.py
Run YOLO predictions on a single image or a directory of images, save annotated images, export per-image and aggregate counts to CSV, and save plots (aggregate bar chart and optional stacked per-image bar chart).
Requirements: pip install ultralytics pandas matplotlib pillow
Usage (recommended - command line): # Single image python yolo_predict_results.py --model /path/to/yolo11n.pt --source /path/to/bus.jpg --output results --save-annotated --plot-aggregate
# Directory (batch)
python yolo_predict_results.py --model /path/to/yolo11n.pt --source /path/to/images_dir --output results --save-annotated --plot-per-image --plot-aggregate
This file includes clearly highlighted comments showing exactly where to set your model path and images directory if you prefer to hardcode them in the script instead of using CLI args. """
import argparse from collections import Counter from pathlib import Path import sys
import numpy as np import pandas as pd import matplotlib.pyplot as plt from PIL import Image
try: from ultralytics import YOLO except Exception as e: print("Please install ultralytics (pip install ultralytics).") raise
IMAGE_EXTS = {".jpg", ".jpeg", ".png", ".bmp", ".tif", ".tiff", ".webp"}
def find_images(directory: Path): return [str(p) for p in sorted(directory.rglob("*")) if p.suffix.lower() in IMAGE_EXTS]
def predict_images(model, paths, conf=0.25, imgsz=640, device=None, save_annotated=False, out_dir=None): """ Run prediction per-image (keeps mapping simple). Returns list of dicts: {'file': path, 'counts': Counter, 'total': int} """ out_dir = Path(out_dir) if out_dir is not None else None annotated_dir = (out_dir / "annotated") if (save_annotated and out_dir is not None) else None if annotated_dir: annotated_dir.mkdir(parents=True, exist_ok=True)
results = []
for p in paths:
    print(f"Predicting: {p}")
    res_list = model.predict(source=p, conf=conf, imgsz=imgsz, device=device, verbose=False)
    if not res_list:
        print(f"Warning: no result for {p}")
        continue
    r = res_list[0]

    counts = Counter()
    try:
        box_cls = getattr(r.boxes, "cls", None)
        if box_cls is not None:
            try:
                arr = box_cls.cpu().numpy()
            except Exception:
                arr = np.array(box_cls)
            arr = arr.astype(int).flatten()
            for c in arr:
                name = model.names.get(int(c), str(int(c)))
                counts[name] += 1
    except Exception as e:
        print(f"Warning: could not parse classes for {p}: {e}")

    total = sum(counts.values())
    results.append({"file": p, "counts": counts, "total": total})

    if save_annotated and annotated_dir:
        try:
            ann = r.plot()
            if isinstance(ann, np.ndarray):
                img_out = Image.fromarray(ann)
            else:
                img_out = ann
            out_path = annotated_dir / (Path(p).stem + "_annotated" + Path(p).suffix)
            img_out.save(out_path)
        except Exception as e:
            print(f"Warning: failed to save annotated image for {p}: {e}")

return results
def build_dataframe(summary): all_classes = set() for row in summary: all_classes.update(row["counts"].keys()) classes = sorted(all_classes)
rows = []
for row in summary:
    data = {cls: row["counts"].get(cls, 0) for cls in classes}
    data["file"] = row["file"]
    data["total"] = row["total"]
    rows.append(data)

if not rows:
    # Return empty dataframe
    df = pd.DataFrame(columns=["file", "total"] + classes)
else:
    df = pd.DataFrame(rows)
    cols = ["file"] + classes + ["total"]
    df = df[cols]
return df, classes
def save_csvs(summary, out_dir: Path): df, classes = build_dataframe(summary) out_dir.mkdir(parents=True, exist_ok=True) csv1 = out_dir / "counts_per_image.csv" df.to_csv(csv1, index=False) print(f"Saved per-image counts to: {csv1}")
agg = Counter()
for r in summary:
    agg.update(r["counts"])
agg_series = pd.Series(dict(agg)).sort_values(ascending=False)
csv2 = out_dir / "aggregate_counts.csv"
agg_series.to_csv(csv2, header=["count"])
print(f"Saved aggregate counts to: {csv2}")
return df, classes, agg
def plot_aggregate(agg_counter, out_path: Path): names = list(agg_counter.keys()) counts = [agg_counter[n] for n in names] fig, ax = plt.subplots(figsize=(max(6, len(names) * 0.6), 5)) ax.bar(names, counts, color="tab:blue") ax.set_ylabel("Count") ax.set_title("Aggregate object counts") plt.xticks(rotation=45, ha="right") plt.tight_layout() out_path.parent.mkdir(parents=True, exist_ok=True) fig.savefig(out_path) plt.close(fig) print(f"Saved aggregate plot to: {out_path}")
def plot_stacked_per_image(df: pd.DataFrame, classes, out_path: Path, top_n=50): if df.empty: print("No per-image data to plot.") return plot_df = df.copy() if top_n and len(plot_df) > top_n: plot_df = plot_df.sort_values("total", ascending=False).head(top_n) x = plot_df["file"].apply(lambda p: Path(p).name).tolist() bottoms = np.zeros(len(plot_df)) fig, ax = plt.subplots(figsize=(max(8, len(x) * 0.6), 6)) for cls in classes: vals = plot_df[cls].values ax.bar(x, vals, bottom=bottoms, label=cls) bottoms += vals ax.set_ylabel("Counts") ax.set_title("Per-image stacked counts") ax.legend(bbox_to_anchor=(1.05, 1), loc="upper left") plt.xticks(rotation=45, ha="right") plt.tight_layout() out_path.parent.mkdir(parents=True, exist_ok=True) fig.savefig(out_path) plt.close(fig) print(f"Saved per-image stacked plot to: {out_path}")
def main(): ap = argparse.ArgumentParser(description="YOLO predict -> save CSV + plots") ap.add_argument("--model", required=False, help="Path to YOLO model (.pt) (e.g., yolo11n.pt)") ap.add_argument("--source", required=False, help="Image file or directory of images") ap.add_argument("--output", required=False, help="Output directory", default="results") ap.add_argument("--conf", type=float, default=0.25, help="Confidence threshold") ap.add_argument("--imgsz", type=int, default=640, help="Image size for inference") ap.add_argument("--device", type=str, default=None, help="Device (e.g., 0 or 'cpu')") ap.add_argument("--save-annotated", action="store_true", help="Save annotated images") ap.add_argument("--plot-per-image", action="store_true", help="Save stacked per-image plot") ap.add_argument("--plot-aggregate", action="store_true", help="Save aggregate bar chart") ap.add_argument("--top-n", type=int, default=50, help="Top N images for per-image plot when many images")
# Parse CLI args (recommended usage)
args = ap.parse_args()

# -------------------------------------------------------------------------
# HIGHLIGHT 1: If you want to hardcode paths, replace the `args = ap.parse_args()` line
# with the block below. Edit the two highlighted lines inside the block:
#    model="..."   <-- SET YOUR MODEL FILE PATH HERE
#    source="..."  <-- SET YOUR IMAGE FILE OR IMAGES DIRECTORY PATH HERE
#
# Example (UNCOMMENT and EDIT, then COMMENT OUT or REMOVE the args = ap.parse_args() above):
#
# args = argparse.Namespace(
#     model="/path/to/yolo11n.pt",       # <<< HIGHLIGHT: set model path here (absolute or relative)
#     source="/path/to/images_or_image", # <<< HIGHLIGHT: set image file or images directory path here
#     output="results",
#     conf=0.25,
#     imgsz=640,
#     device=None,
#     save_annotated=True,
#     plot_per_image=True,
#     plot_aggregate=True,
#     top_n=50
# )
# -------------------------------------------------------------------------

# -------------------------------------------------------------------------
# HIGHLIGHT 2: If you prefer using the command-line, supply these two args when
# running the script:
#   --model /path/to/yolo11n.pt
#   --source /path/to/images_or_image
# These correspond to the variables used below: args.model and args.source
# -------------------------------------------------------------------------

if not args.model or not args.source:
    print("Error: --model and --source are required (or hardcode them in the script).")
    print("Example:")
    print("  python yolo_predict_results.py --model /path/to/yolo11n.pt --source /path/to/images --output results --save-annotated --plot-aggregate")
    sys.exit(1)

model_path = Path(args.model)
source = Path(args.source)
out_dir = Path(args.output)
out_dir.mkdir(parents=True, exist_ok=True)

print(f"Loading model: {model_path}")
model = YOLO(str(model_path))

if source.is_dir():
    files = find_images(source)
    if not files:
        print(f"No images found under {source}")
        sys.exit(1)
elif source.is_file():
    files = [str(source)]
else:
    print(f"Source path not found: {source}")
    sys.exit(1)

summary = predict_images(
    model=model,
    paths=files,
    conf=args.conf,
    imgsz=args.imgsz,
    device=args.device,
    save_annotated=args.save_annotated,
    out_dir=out_dir,
)

if not summary:
    print("No predictions were produced.")
    sys.exit(0)

df, classes, agg = save_csvs(summary, out_dir)

if args.plot_aggregate:
    plot_aggregate(agg, out_dir / "aggregate_counts.png")

if args.plot_per_image:
    plot_stacked_per_image(df, classes, out_dir / "per_image_stacked_counts.png", top_n=args.top_n)

print("All done. Results in:", out_dir.resolve())
if name == "main": main()
 Glenn JocherUltralytics
@MUK003 great question, and thanks for sharing the script in detail.
The short answer is: yes, this is a reasonable way to get per-image and aggregate count graphs from YOLO11 predictions, since
YOLO('yolo11n.pt')returnsResultsobjects wherer.boxes.clsholds the class indices and yourCounter/CSV/Matplotlib logic will work on top of that. I’d recommend first running it on a very small image folder and confirming that the numbers incounts_per_image.csvandaggregate_counts.csvmatch what you expect from a few sample images.From the Ultralytics side there’s currently no built-in
yolo predictCLI flag that directly produces those bar/pie charts like training; your Python approach (or, for video streams, thesolutions.Analyticscharts) is the right pattern. For reference on how analytics is structured inside Ultralytics, you can also glance at the Analytics solution API docs.- User
@glenn-jocher Many thanks :)
yeongnamtan
thank you very much @glenn-jocher
How to integrate the code for line graph with line counter ?
- Glenn JocherUltralytics(تم التعديل)
@yeongnamtan to integrate the line graph with a line counter, use the
Analyticsclass to update the line graph with the total object counts per frame. Ensure you initialize theAnalyticswithanalytics_type="line"and update it within your video processing loop. For detailed guidance, please refer to the analytics section in the documentation.
Peymankar
Hi, how can i count number of left turns or right turns in an intersection?
- Glenn JocherUltralytics
@Peymankar hello!
To count the number of left or right turns at an intersection using Ultralytics YOLO, you can set up a tracking system that identifies and follows each vehicle's trajectory. Here’s a brief outline on how you might approach this:
-
Track Vehicles: Use the YOLO model to detect and track vehicles. You can use the
model.track()function to keep track of each vehicle's movement frame by frame. -
Define Zones: Define areas or lines within the video frame that represent the boundaries of different turn directions (left, right).
-
Analyze Trajectories: Analyze the paths of tracked vehicles to determine when they cross these defined zones. This can be done by checking the intersection of vehicle tracks with these zones and classifying the movement as a left or right turn based on the zone they intersect.
-
Count Turns: Maintain a count of how many vehicles make left or right turns based on these intersections.
For a more detailed guide on setting up vehicle tracking and analyzing trajectories, you might find the tracking and analytics features in the Ultralytics documentation helpful. Implementing this will require some custom coding to define zones and analyze paths relative to these zones.
If you need further assistance or more specific guidance, feel free to ask. Happy coding! 😊
-
ani = FuncAnimation(fig, animate, frames=range(int(cap.get(cv2.CAP_PROP_FRAME_COUNT))), blit=False, interval=1000/fps, repeat=False)
plt.show()
The code is still not working... I
error meesage ... WARNING ⚠️ best.pt appears to require 'dill', which is not in ultralytics requirements. AutoInstall will run now for 'dill' but this feature will be removed in the future. Recommend fixes are to train a new model using the latest 'ultralytics' package or to run a command with an official YOLOv8 model, i.e. 'yolo predict model=yolov8n.pt' requirements: Ultralytics requirement ['dill'] not found, attempting AutoUpdate... Collecting dill Downloading dill-0.3.8-py3-none-any.whl (116 kB) ━━━━━━━━━━━━━━━━━━━━━━━━━━━━━━━━━━━━━━━━ 116.3/116.3 kB 4.9 MB/s eta 0:00:00 Installing collected packages: dill Successfully installed dill-0.3.8
requirements: AutoUpdate success ✅ 5.8s, installed 1 package: ['dill'] requirements: ⚠️ Restart runtime or rerun command for updates to take effect
requirements: Ultralytics requirement ['lapx>=0.5.2'] not found, attempting AutoUpdate... Collecting lapx>=0.5.2 Downloading lapx-0.5.9-cp310-cp310-manylinux_2_5_x86_64.manylinux1_x86_64.manylinux_2_17_x86_64.manylinux2014_x86_64.whl (1.7 MB) ━━━━━━━━━━━━━━━━━━━━━━━━━━━━━━━━━━━━━━━━ 1.7/1.7 MB 11.8 MB/s eta 0:00:00 Requirement already satisfied: numpy>=1.21.6 in /usr/local/lib/python3.10/dist-packages (from lapx>=0.5.2) (1.25.2) Installing collected packages: lapx Successfully installed lapx-0.5.9
requirements: AutoUpdate success ✅ 7.4s, installed 1 package: ['lapx>=0.5.2'] requirements: ⚠️ Restart runtime or rerun command for updates to take effect
0: 384x640 2 fishs, 134.7ms Speed: 13.4ms preprocess, 134.7ms inference, 747.7ms postprocess per image at shape (1, 3, 384, 640)
DisabledFunctionError Traceback (most recent call last) in <cell line: 26>() 37 clswise_count[model.names[int(cls)]] = 1 38 ---> 39 analytics.update_bar(clswise_count) 40 cv2_imshow('Bar Plot', frame) 41 clswise_count = {}
1 frames /usr/local/lib/python3.10/dist-packages/google/colab/_import_hooks/_cv2.py in wrapped(*args, **kwargs) 46 def wrapped(*args, **kwargs): 47 if not os.environ.get(env_var, False): ---> 48 raise DisabledFunctionError(message, name or func.name) 49 return func(*args, **kwargs) 50
DisabledFunctionError: cv2.imshow() is disabled in Colab, because it causes Jupyter sessions to crash; see https://github.com/jupyter/notebook/issues/3935. As a substitution, consider using from google.colab.patches import cv2_imshow
 Paula DerrengerUltralytics
Hello,
Thank you for sharing the details of the issue you're encountering. It seems like the
dillandlapxpackages were missing but have now been successfully installed. Please ensure you restart your runtime or rerun your command to allow the updates to take effect, as suggested by the AutoUpdate messages.Regarding the
DisabledFunctionErrorforcv2.imshow()in Colab, this function is indeed disabled because it can cause Jupyter sessions to crash. As an alternative, you can usecv2_imshowfrom thegoogle.colab.patchesmodule to display images in Colab notebooks. Here’s how you can modify your code:from google.colab.patches import cv2_imshow # Replace cv2.imshow with cv2_imshow cv2_imshow(frame)This should allow you to display images without causing any issues in your Colab environment.
If you have any more questions or need further assistance, feel free to ask. Happy coding! 🚀
thank you
In the code for bar plots , I don't see any cv2.imshow. when I run the code, I get cv2.imshow error.
- Paula DerrengerUltralytics
@yeongnamtan hello,
It seems like you're encountering an issue with
cv2.imshownot being present in the bar plot code example. This function is indeed necessary to display the frames with the visualizations in real-time. To resolve the error, you can add the following line just after updating the bar plot in the loop:cv2.imshow('Bar Plot', frame)Make sure to include this inside the loop where frames are being processed, and it will display the updated frame with the bar plot. Additionally, ensure that you have the line
if cv2.waitKey(1) & 0xFF == ord('q'):to handle the window closure properly.If you need further assistance or have more questions, feel free to ask!
I tried to use google colab but it is giving me error because of cv2.imshow... How can I modify it to use cv2_imshow instead ... from google.colab.patches import cv2_imshow # Import cv2_imshow from google.colab.patches
DisabledFunctionError: cv2.imshow() is disabled in Colab, because it causes Jupyter sessions to crash; see https://github.com/jupyter/notebook/issues/3935. As a substitution, consider using from google.colab.patches import cv2_imshow
- Paula DerrengerUltralytics
Hello! To use
cv2_imshowinstead ofcv2.imshowin Google Colab, you can make a simple modification to your code. First, ensure you importcv2_imshowfromgoogle.colab.patchesas you've mentioned. Then, replace all instances ofcv2.imshowwithcv2_imshow. Here’s how you can do it:-
Import the function:
from google.colab.patches import cv2_imshow -
Replace
cv2.imshowwithcv2_imshow:# Instead of cv2.imshow("Frame", frame) cv2_imshow(frame)
This change should resolve the issue with displaying images in Google Colab. Let me know if there's anything else you need help with! 😊
-