VOC-Explorationsbeispiel


Willkommen im Ultralytics Explorer API-Notebook. Dieses Notebook stellt die verfügbaren Ressourcen zur Erkundung von Datensätzen mittels semantischer Suche, Vektorsuche und SQL-Abfragen vor.
Versuchen yolo explorer (unterstützt durch die Explorer API)
Installieren ultralytics und ausführen yolo explorer in Ihrem Terminal, um benutzerdefinierte Abfragen und semantische Suche in Ihrem Browser auszuführen.
Community-Hinweis ⚠️
Seit ultralytics>=8.3.12, Ultralytics wurde entfernt. Um Explorer zu nutzen, installieren Sie pip install ultralytics==8.3.11. Ähnliche (und erweiterte) Funktionen zur Datensatzerkundung sind verfügbar in Ultralytics Plattform.
Einrichtung
Installieren ultralytics und die erforderlichen Abhängigkeiten, dann überprüfen Sie Software und Hardware.
!uv pip install ultralytics[explorer] openai
yolo checks
Ähnlichkeitssuche
Nutzen Sie die Leistungsfähigkeit der Vektorähnlichkeitssuche, um die ähnlichen Datenpunkte in Ihrem Datensatz zusammen mit ihrer Distanz im Embedding-Raum zu finden. Erstellen Sie einfach eine Embedding-Tabelle für das jeweilige Datensatz-Modell-Paar. Dies ist nur einmal erforderlich und wird automatisch wiederverwendet.
exp = Explorer("VOC.yaml", model="yolo26n.pt")
exp.create_embeddings_table()
Sobald die Embedding-Tabelle erstellt ist, können Sie die semantische Suche auf eine der folgenden Weisen ausführen:
- Bei einem gegebenen Index/einer Liste von Indizes im Datensatz, z.B.,
exp.get_similar(idx=[1, 10], limit=10) - Auf einem beliebigen Bild/ einer Liste von Bildern, die nicht im Datensatz enthalten sind - exp.get_similar(img=["path/to/img1", "path/to/img2"], limit=10) Im Falle von mehreren Eingaben wird die Summe ihrer Einbettungen verwendet.
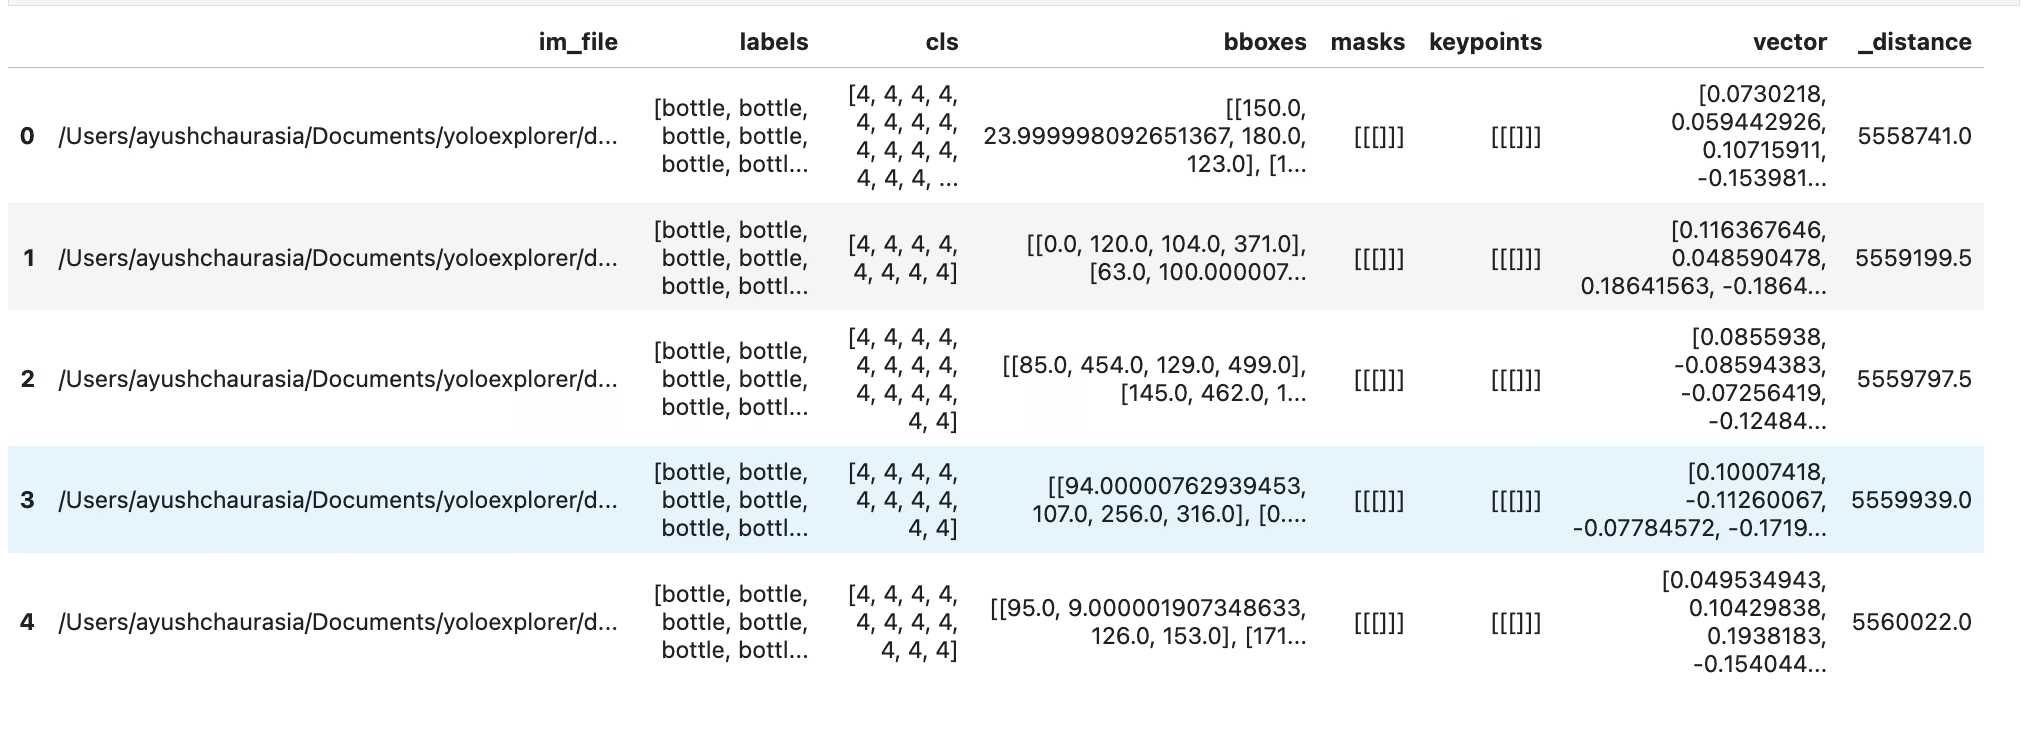
Sie erhalten einen Pandas DataFrame mit der begrenzten Anzahl der dem Input ähnlichsten Datenpunkte, zusammen mit deren Distanz im Embedding-Raum. Diesen Datensatz können Sie für weitere Filterungen verwenden.
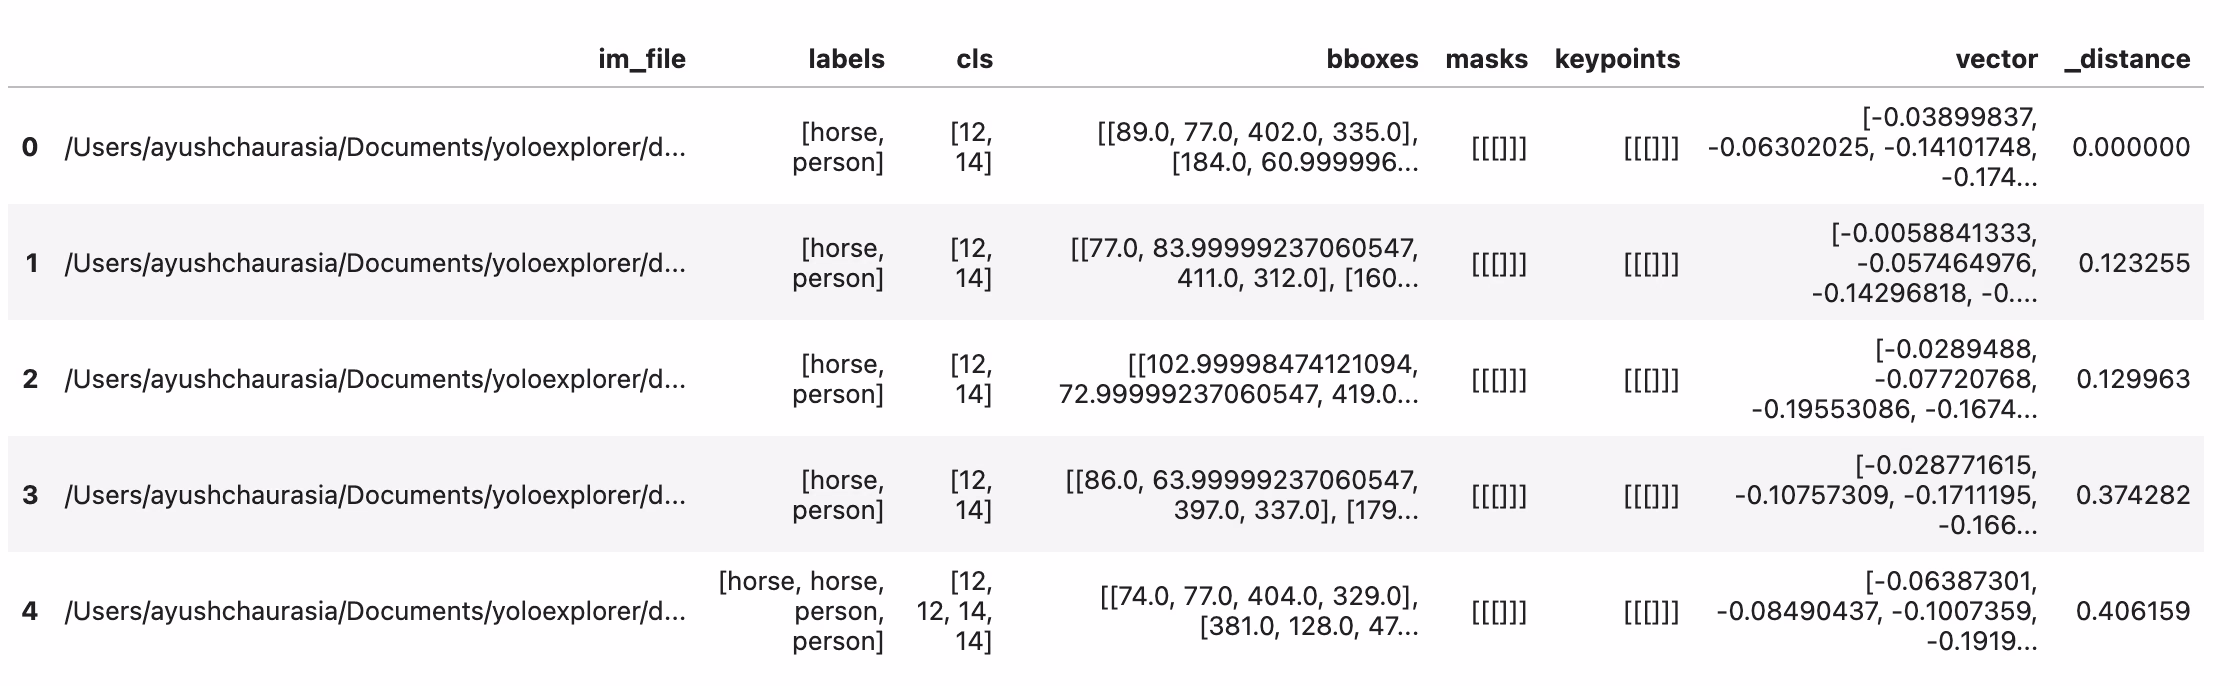
# Search dataset by index
similar = exp.get_similar(idx=1, limit=10)
similar.head()
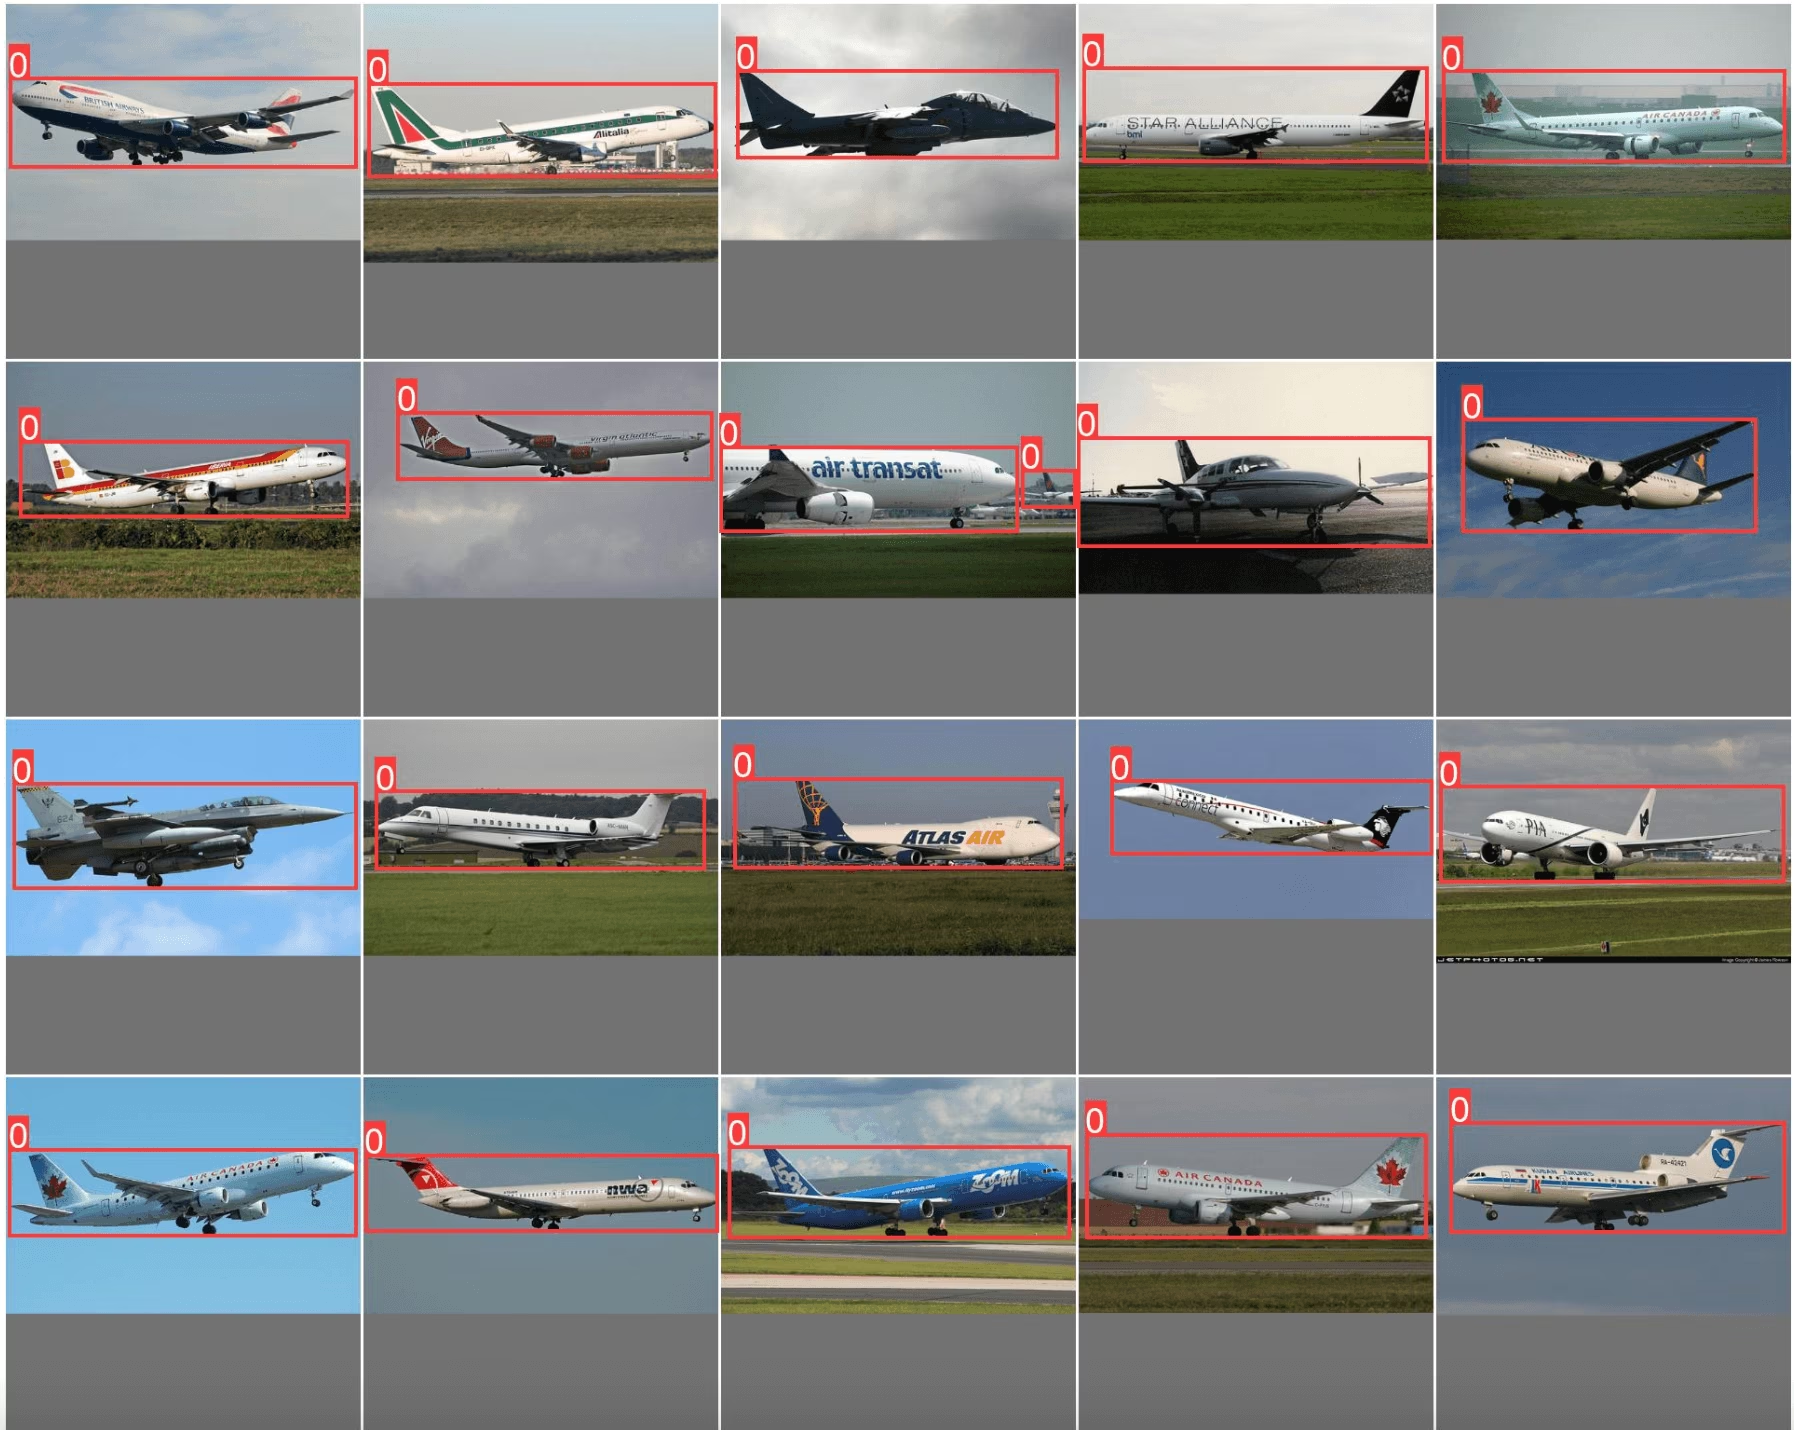
Sie können ähnliche Proben auch direkt mit dem plot_similar util
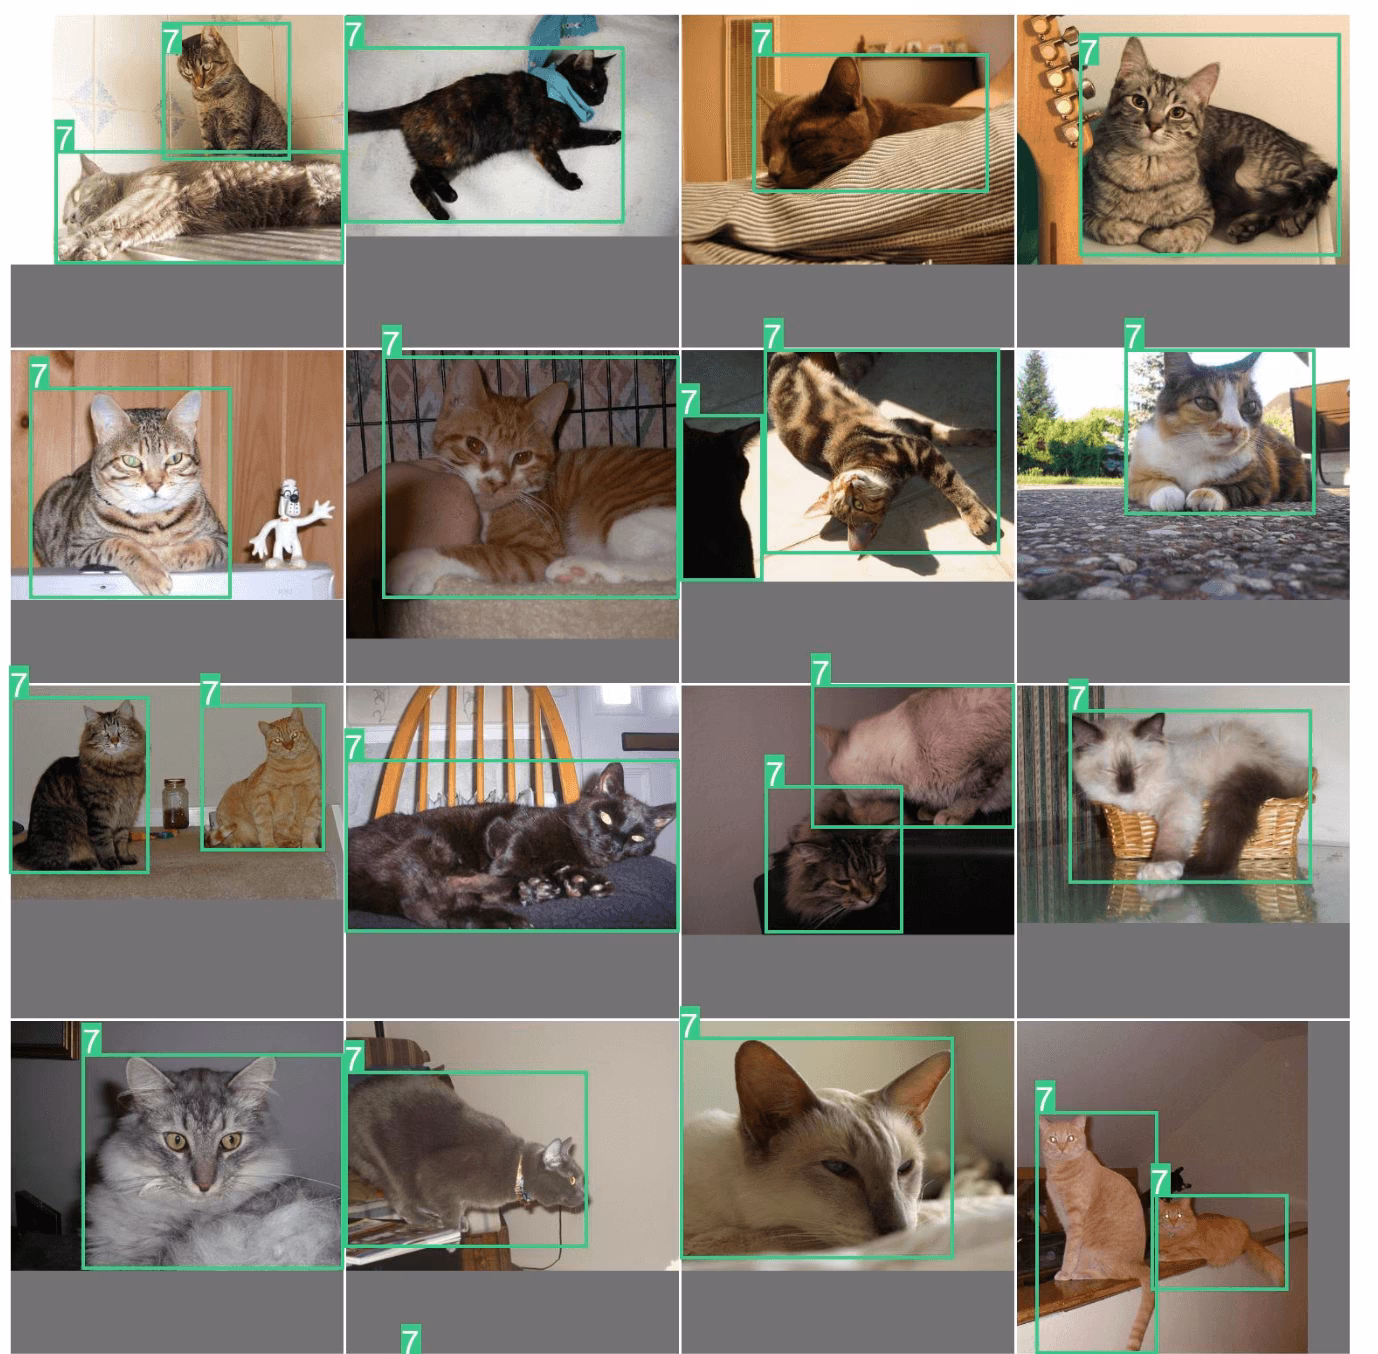
exp.plot_similar(idx=6500, limit=20)
exp.plot_similar(idx=[100, 101], limit=10)  # Can also pass list of idxs or imgs

exp.plot_similar(img="https://ultralytics.com/images/bus.jpg", limit=10, labels=False)  # Can also pass external images
Fragen Sie die KI: Suchen oder Filtern mit natürlicher Sprache
Sie können das Explorer-Objekt mit den gewünschten Datenpunkten abfragen, und es wird versuchen, ein DataFrame mit diesen Ergebnissen zurückzugeben. Da es von LLMs angetrieben wird, ist es nicht immer korrekt. In diesem Fall wird es zurückgeben None.
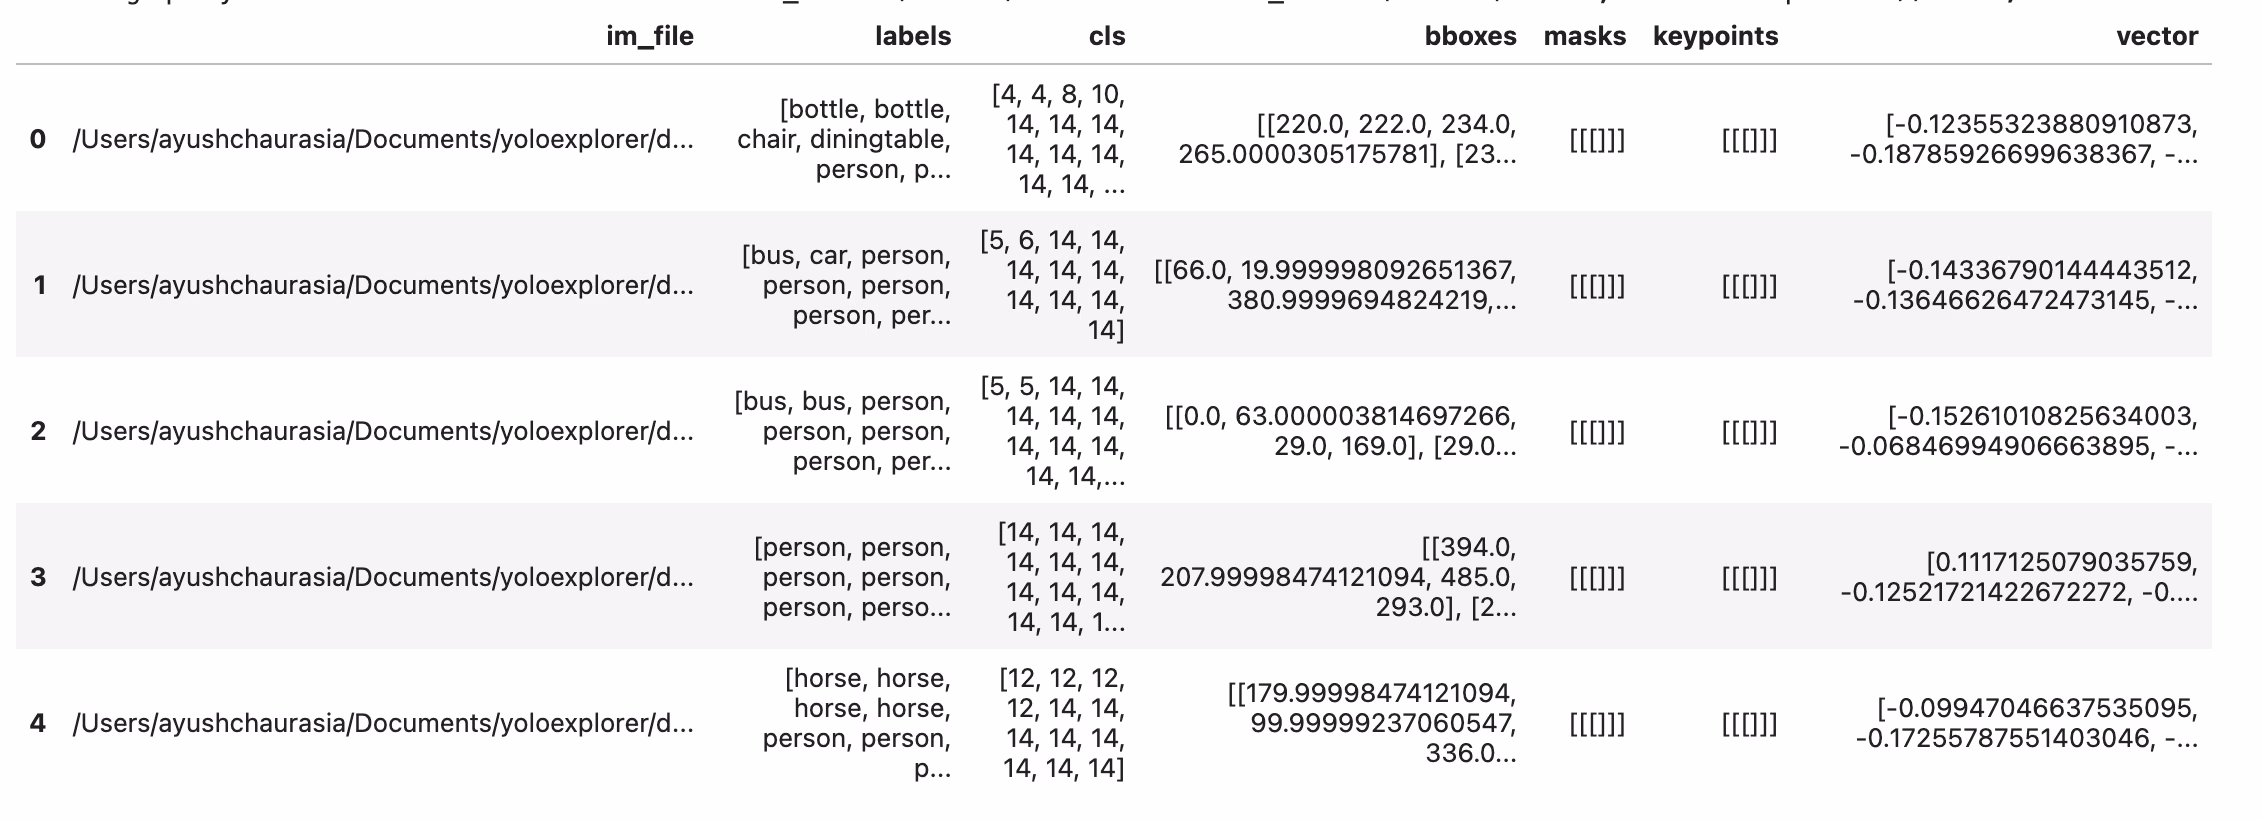
df = exp.ask_ai("show me images containing more than 10 objects with at least 2 persons")
df.head(5)
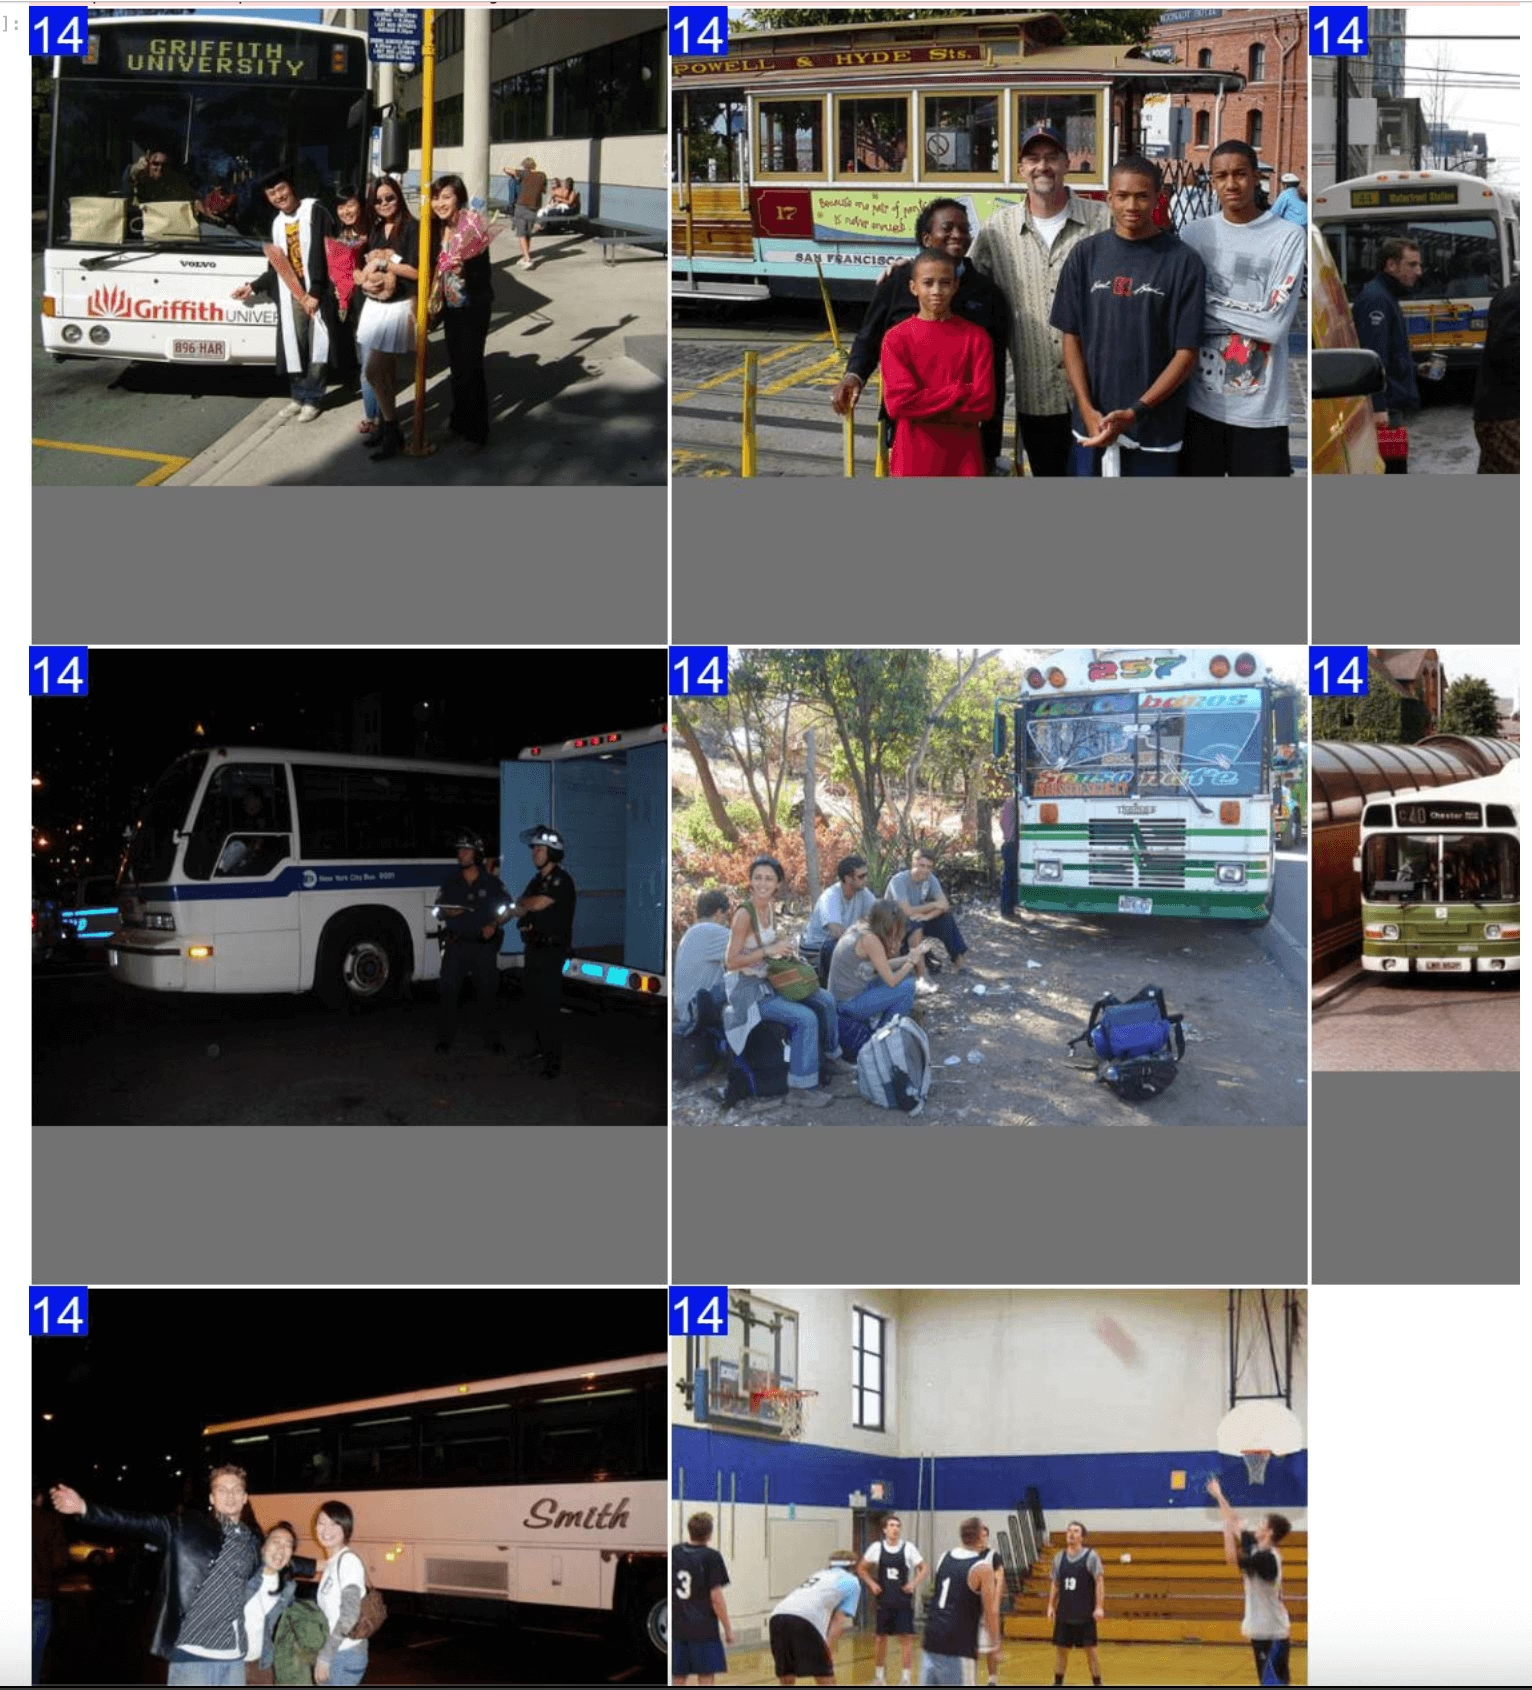
Um diese Ergebnisse zu plotten, können Sie die plot_query_result Dienstprogramm. Beispiel:
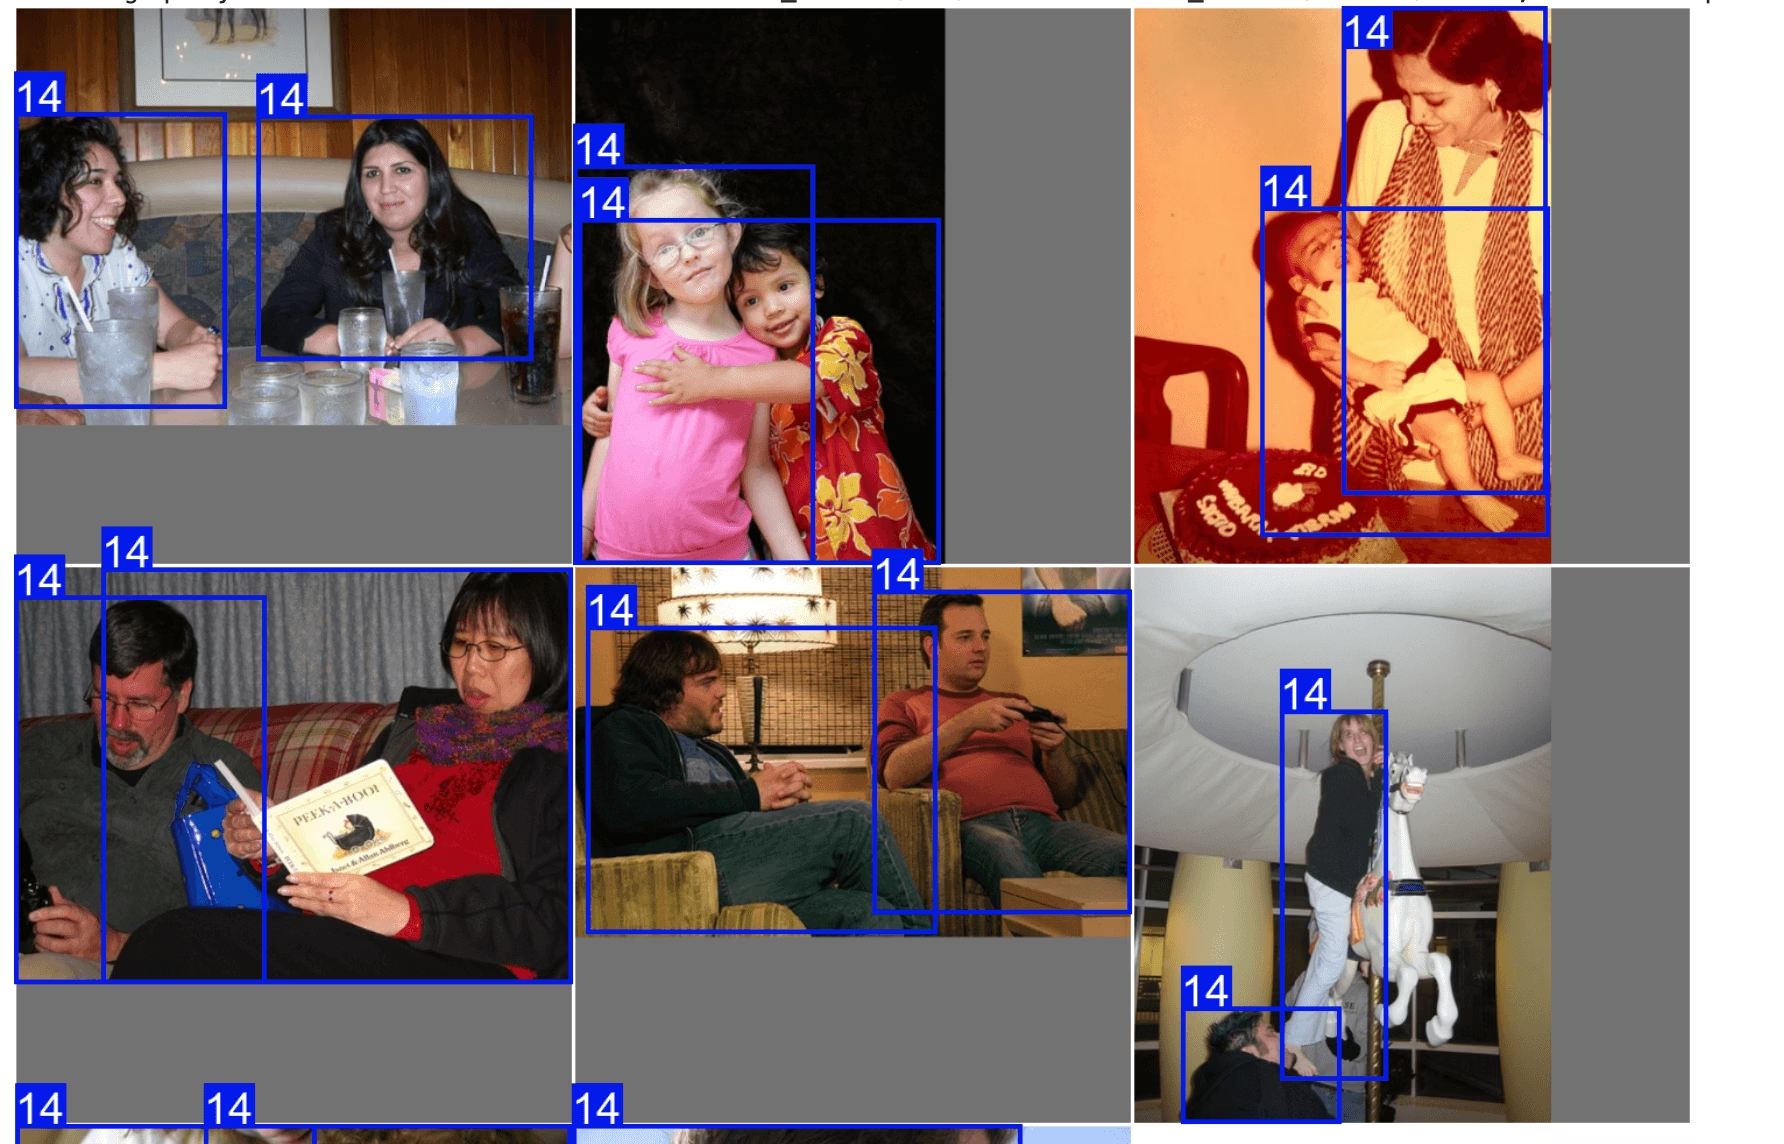
plt = plot_query_result(exp.ask_ai("show me 10 images containing exactly 2 persons"))
Image.fromarray(plt)
# plot
from PIL import Image
from ultralytics.data.explorer import plot_query_result

plt = plot_query_result(exp.ask_ai("show me 10 images containing exactly 2 persons"))
Image.fromarray(plt)
Führen Sie SQL-Abfragen auf Ihrem Datensatz aus.
Manchmal möchten Sie bestimmte Einträge in Ihrem Dataset untersuchen. Dafür ermöglicht Ihnen Explorer die Ausführung von SQL-Abfragen. Es akzeptiert eines der folgenden Formate:
- Abfragen, die mit „WHERE“ beginnen, wählen automatisch alle Spalten aus. Dies kann als eine Kurzabfrage betrachtet werden.
- Sie können auch vollständige Abfragen schreiben, bei denen Sie angeben können, welche Spalten ausgewählt werden sollen.
Dies kann verwendet werden, um die Modellleistung und bestimmte Datenpunkte zu untersuchen. Zum Beispiel:
- Nehmen wir an, Ihr Modell hat Probleme mit Bildern, auf denen Menschen und Hunde zu sehen sind. Sie können eine Abfrage wie diese schreiben, um die Punkte auszuwählen, die mindestens 2 Menschen UND mindestens einen Hund haben.
Sie können SQL-Abfragen und semantische Suche kombinieren, um die Ergebnisse auf einen bestimmten Typ zu filtern
table = exp.sql_query("WHERE labels LIKE '%person, person%' AND labels LIKE '%dog%' LIMIT 10")
exp.plot_sql_query("WHERE labels LIKE '%person, person%' AND labels LIKE '%dog%' LIMIT 10", labels=True)
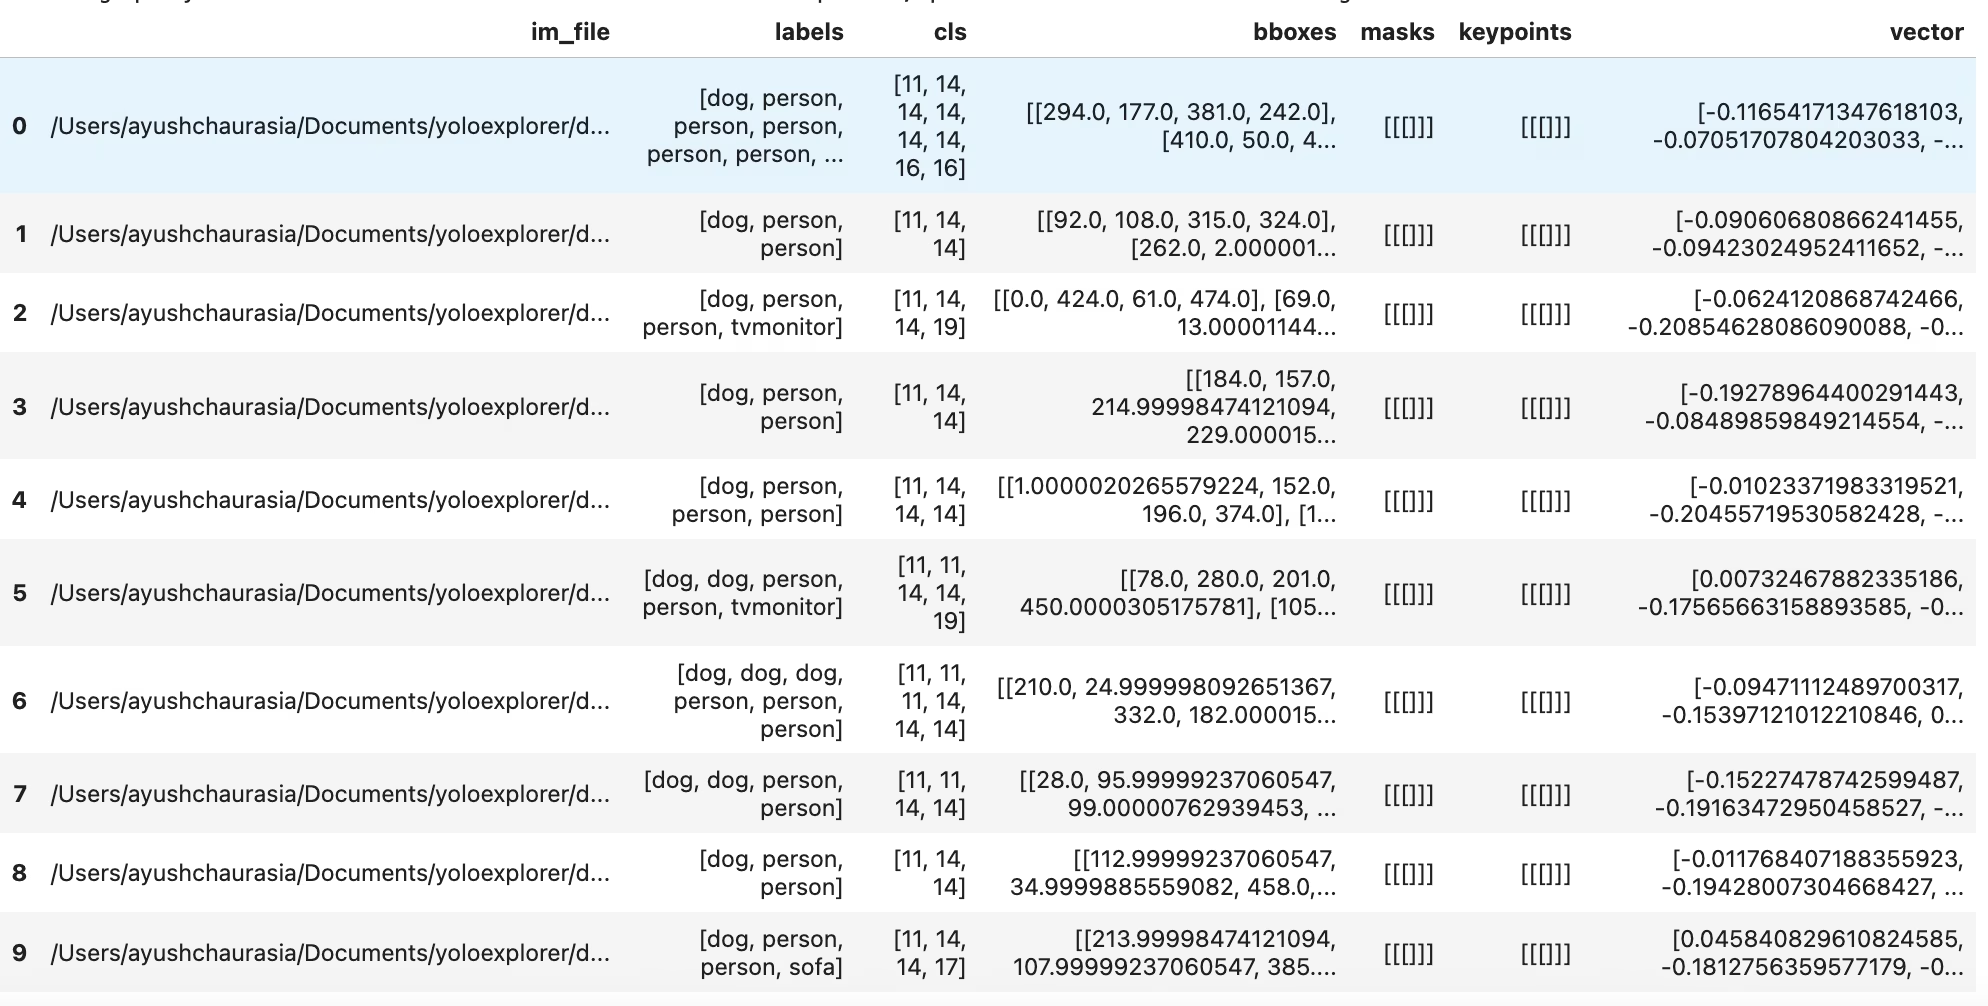
table = exp.sql_query("WHERE labels LIKE '%person, person%' AND labels LIKE '%dog%' LIMIT 10")
print(table)
Ähnlich wie bei der Ähnlichkeitssuche erhalten Sie auch ein Hilfsprogramm, um die SQL-Abfragen direkt zu plotten, indem Sie exp.plot_sql_query
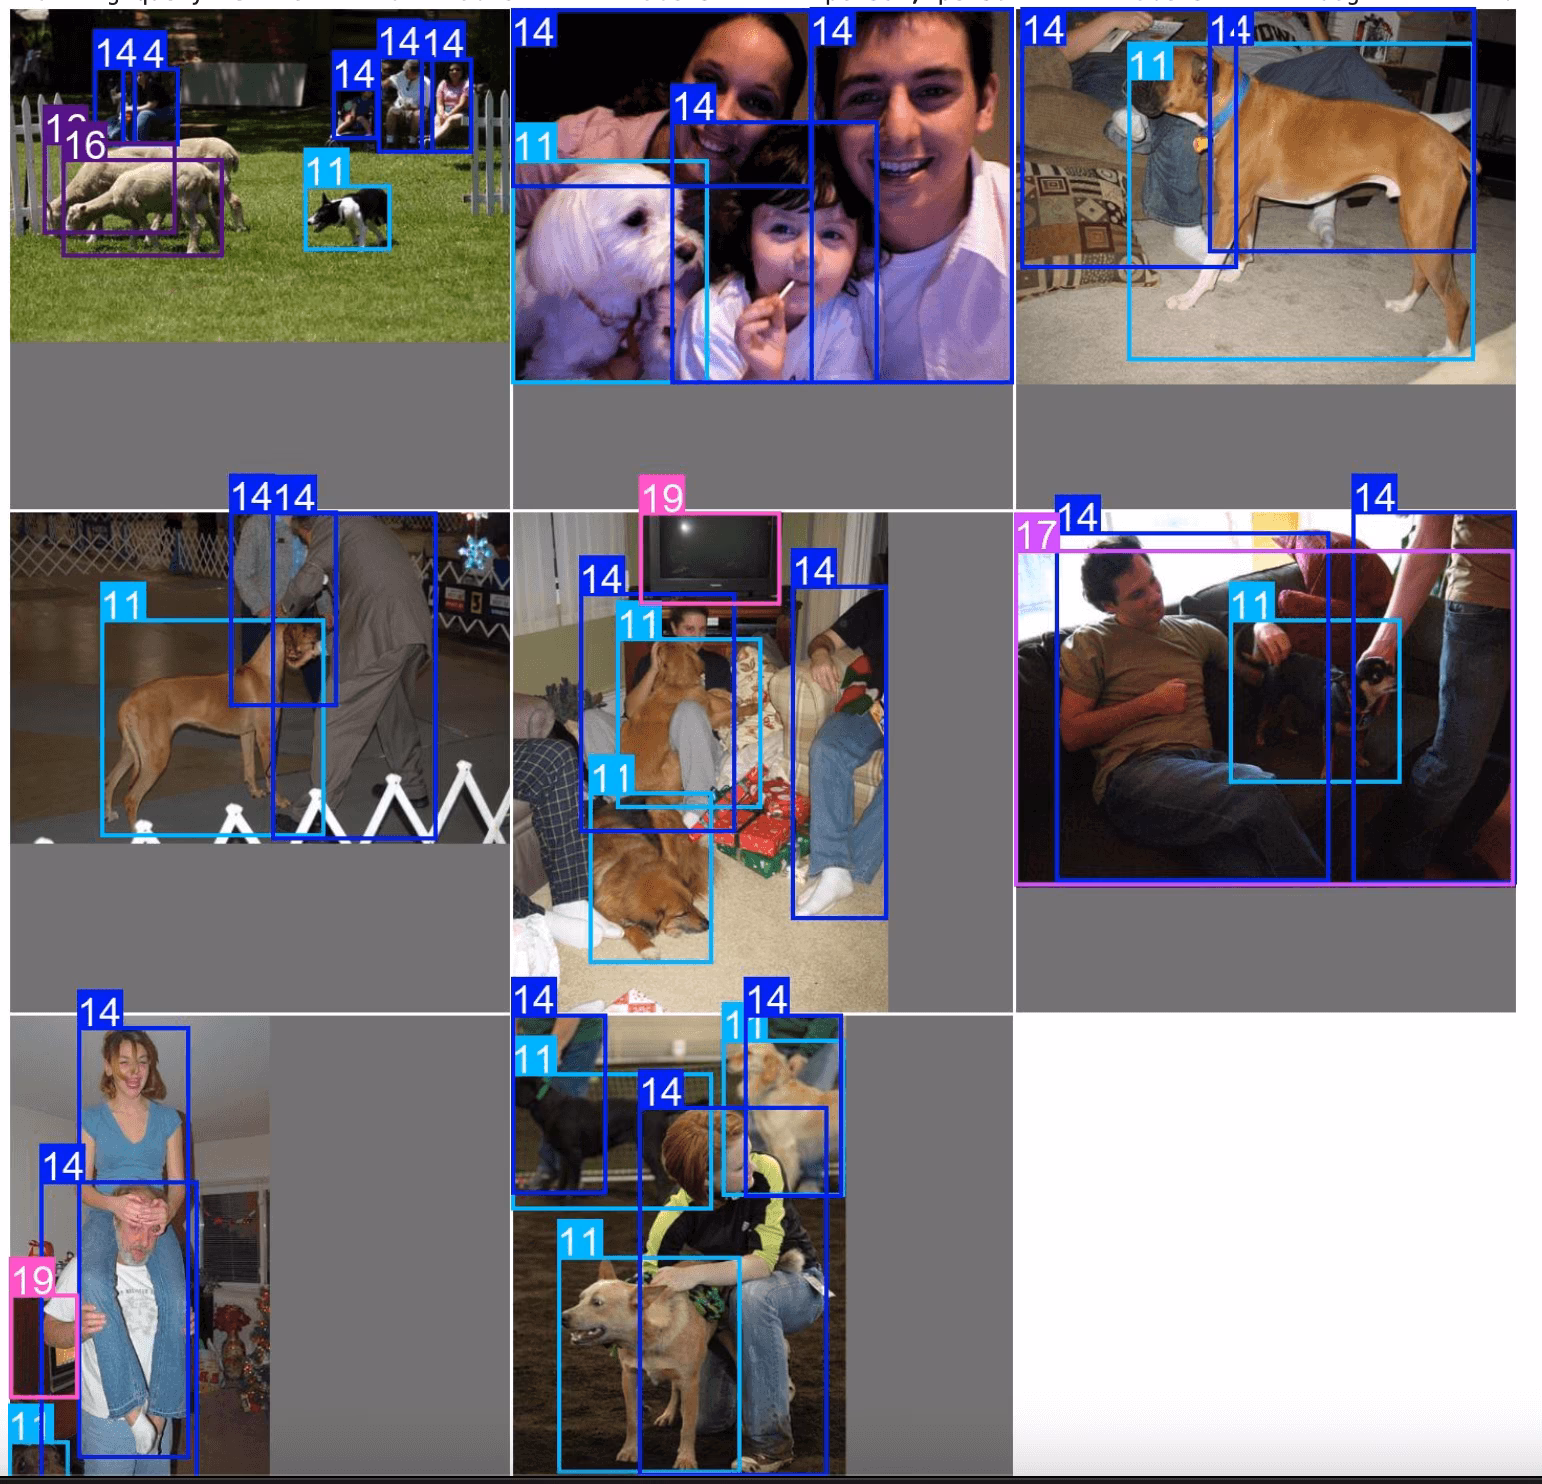
exp.plot_sql_query("WHERE labels LIKE '%person, person%' AND labels LIKE '%dog%' LIMIT 10", labels=True)
Arbeiten mit Embedding-Tabellen (Erweitert)
Explorer funktioniert mit LanceDB Tabellen intern. Sie können direkt auf diese Tabelle zugreifen, indem Sie Explorer.table Objekte abfragen und Rohabfragen ausführen, Pre- und Post-Filter nach unten verschieben usw.
table = exp.table
print(table.schema)
Rohe Abfragen ausführen
Die Vektorsuche findet die ähnlichsten Vektoren aus der Datenbank. In einem Empfehlungssystem oder einer Suchmaschine können Sie ähnliche Produkte zu dem finden, das Sie gesucht haben. In LLM- und anderen KI-Anwendungen können die einzelnen Datenpunkte durch die von einigen Modellen generierten Einbettungen dargestellt werden, wobei die relevantesten Merkmale zurückgegeben werden.
Eine Suche im hochdimensionalen Vektorraum dient dazu, die K-Nearest-Neighbors (KNN) des Abfragevektors zu finden.
Metrik In LanceDB beschreibt eine Metrik die Distanz zwischen zwei Vektoren. Aktuell werden folgende Metriken unterstützt:
- L2
- Kosinus
- Die Ähnlichkeitssuche von Dot Explorer verwendet standardmäßig L2. Sie können Abfragen direkt auf Tabellen ausführen oder das Lance-Format verwenden, um benutzerdefinierte Hilfsprogramme zur Verwaltung von Datensätzen zu erstellen. Weitere Informationen zu den verfügbaren LanceDB-Tabellenoperationen finden Sie in den Dokumenten.
dummy_img_embedding = [i for i in range(256)]
table.search(dummy_img_embedding).limit(5).to_pandas()
Konvertierung in gängige Datenformate
df = table.to_pandas()
pa_table = table.to_arrow()
Arbeiten mit Einbettungen
Sie können das Roh-Embedding aus der lancedb-Tabelle abrufen und analysieren. Die Bild-Embeddings werden in der Spalte gespeichert vector
import numpy as np

embeddings = table.to_pandas()["vector"].tolist()
embeddings = np.array(embeddings)
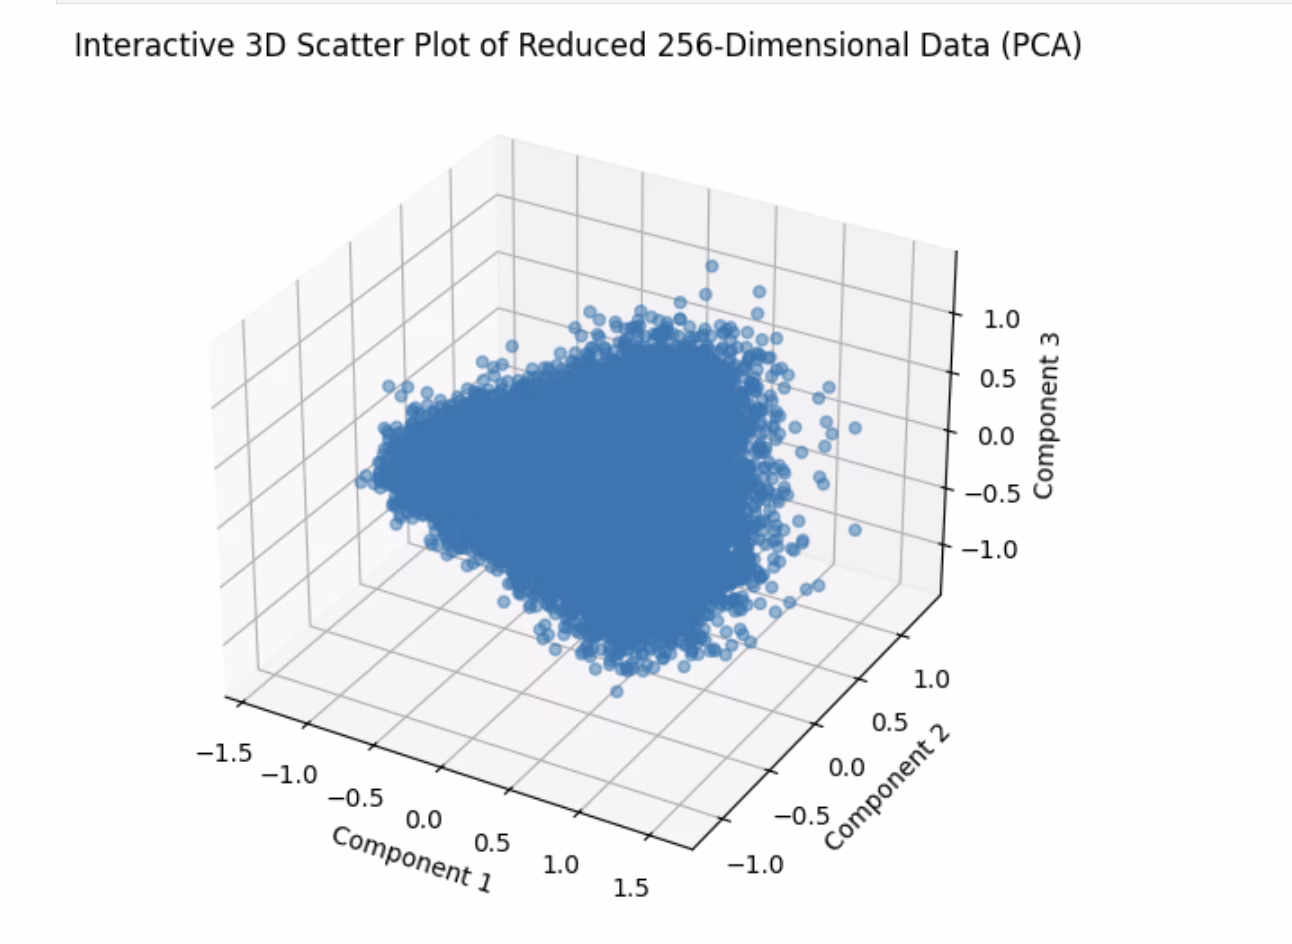
Streudiagramm
Einer der vorbereitenden Schritte bei der Analyse von Embeddings ist deren Darstellung im 2D-Raum mittels Dimensionsreduktion. Versuchen wir ein Beispiel.
import matplotlib.pyplot as plt
from sklearn.decomposition import PCA  # pip install scikit-learn

# Reduce dimensions using PCA to 3 components for visualization in 3D
pca = PCA(n_components=3)
reduced_data = pca.fit_transform(embeddings)

# Create a 3D scatter plot using Matplotlib's Axes3D
fig = plt.figure(figsize=(8, 6))
ax = fig.add_subplot(111, projection="3d")

# Scatter plot
ax.scatter(reduced_data[:, 0], reduced_data[:, 1], reduced_data[:, 2], alpha=0.5)
ax.set_title("3D Scatter Plot of Reduced 256-Dimensional Data (PCA)")
ax.set_xlabel("Component 1")
ax.set_ylabel("Component 2")
ax.set_zlabel("Component 3")

plt.show()
Ähnlichkeitsindex
Hier ist ein einfaches Beispiel für eine Operation, die von der Einbettungstabelle unterstützt wird. Explorer wird mitgeliefert mit einem similarity_index Operation-
- Es versucht abzuschätzen, wie ähnlich jeder Datenpunkt dem Rest des Datensatzes ist.
- Es tut dies, indem es zählt, wie viele Image-Embeddings näher als max_dist zum aktuellen Bild im generierten Embedding-Raum liegen, wobei jeweils top_k ähnliche Bilder berücksichtigt werden.
Für einen bestimmten Datensatz, ein Modell, max_dist & top_k Der einmal generierte Ähnlichkeitsindex wird wiederverwendet. Falls sich Ihr Datensatz geändert hat oder Sie den Ähnlichkeitsindex einfach neu generieren müssen, können Sie Folgendes übergeben force=True. Ähnlich der Vektor- und SQL-Suche gibt es hierfür auch ein Hilfsprogramm zur direkten Darstellung.
sim_idx = exp.similarity_index(max_dist=0.2, top_k=0.01)
exp.plot_similarity_index(max_dist=0.2, top_k=0.01)
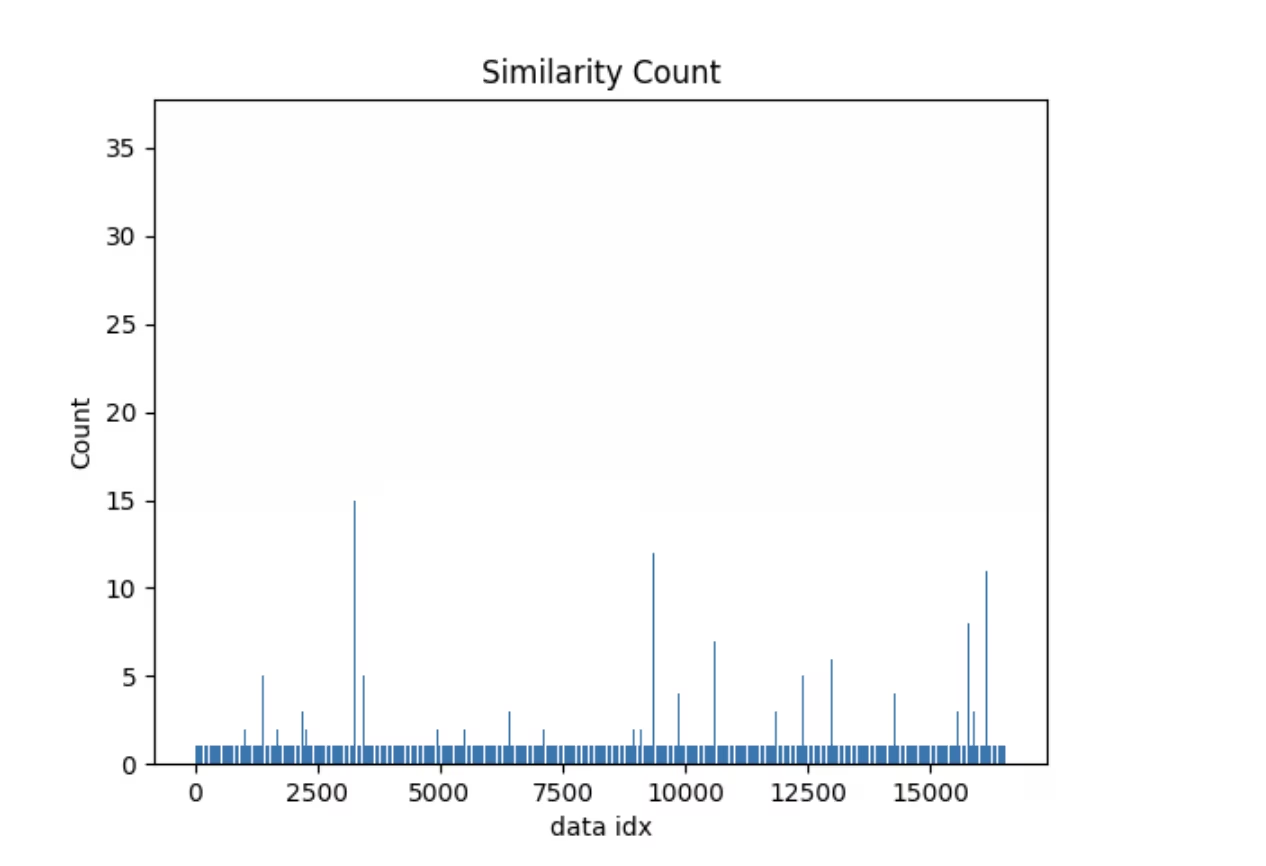
Schauen wir uns zunächst die Handlung an.
exp.plot_similarity_index(max_dist=0.2, top_k=0.01)
Betrachten wir nun die Ausgabe der Operation.
sim_idx = exp.similarity_index(max_dist=0.2, top_k=0.01, force=False)

sim_idx
Erstellen wir eine Abfrage, um zu sehen, welche Datenpunkte eine Ähnlichkeitsanzahl von mehr als 30 haben, und stellen wir ähnliche Bilder dar.
import numpy as np

sim_count = np.array(sim_idx["count"])
sim_idx["im_file"][sim_count > 30]
Sie sollten so etwas sehen
exp.plot_similar(idx=[7146, 14035]) # Using avg embeddings of 2 images


