Link to this sectionEinfache Hilfsprogramme#
Das ultralytics-Paket bietet eine Vielzahl von Hilfsprogrammen, um deine Arbeitsabläufe zu unterstützen, zu verbessern und zu beschleunigen. Obwohl noch viele weitere verfügbar sind, hebt dieser Leitfaden einige der nützlichsten für Entwickler hervor und dient als praktische Referenz für die Programmierung mit Ultralytics-Tools.
Watch: Ultralytics Utilities | Auto Annotation, Explorer API and Dataset Conversion
Link to this sectionDaten#
Link to this sectionAutomatische Etikettierung / Annotationen#
Dataset-Annotation ist ein ressourcenintensiver und zeitaufwendiger Prozess. Wenn du ein trainiertes Ultralytics YOLO Objekterkennungsmodell für eine angemessene Datenmenge hast, kannst du es mit SAM verwenden, um zusätzliche Daten automatisch im Segmentierungsformat zu annotieren.
from ultralytics.data.annotator import auto_annotate

auto_annotate(
    data="path/to/new/data",
    det_model="yolo26n.pt",
    sam_model="mobile_sam.pt",
    device="cuda",
    output_dir="path/to/save_labels",
)
Diese Funktion gibt keinen Wert zurück. Weitere Details:
- Siehe den Referenzabschnitt für
annotator.auto_annotatefür weitere Einblicke in die Funktionsweise. - Verwende es in Kombination mit der Funktion
segments2boxes, um auch Begrenzungsrahmen (Bounding Boxes) für die Objekterkennung zu generieren.
Link to this sectionDataset-Annotationen visualisieren#
Diese Funktion visualisiert YOLO-Annotationen auf einem Bild vor dem Training, was dabei hilft, fehlerhafte Annotationen zu identifizieren und zu korrigieren, die zu falschen Erkennungsergebnissen führen könnten. Sie zeichnet Begrenzungsrahmen, beschriftet Objekte mit Klassennamen und passt die Textfarbe basierend auf der Luminanz des Hintergrunds für eine bessere Lesbarkeit an.
from ultralytics.data.utils import visualize_image_annotations

label_map = {  # Define the label map with all annotated class labels.
    0: "person",
    1: "car",
}

# Visualize
visualize_image_annotations(
    "path/to/image.jpg",  # Input image path.
    "path/to/annotations.txt",  # Annotation file path for the image.
    label_map,
)
Link to this sectionSegmentierungsmasken in das YOLO-Format konvertieren#
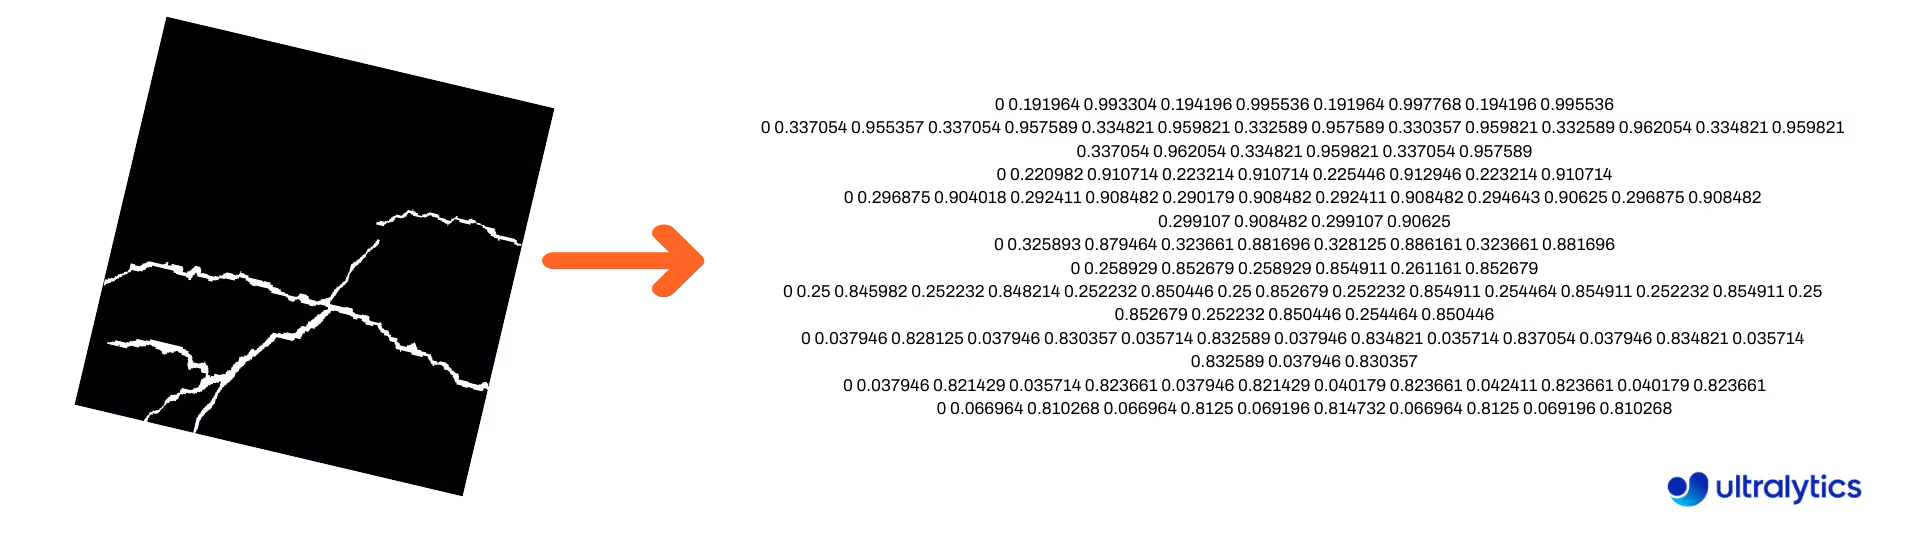
Verwende dies, um einen Datensatz aus Segmentierungsmasken-Bildern in das Ultralytics YOLO Segmentierungsformat zu konvertieren. Diese Funktion nimmt das Verzeichnis mit den Maskenbildern im Binärformat entgegen und konvertiert sie in das YOLO-Segmentierungsformat.
Die konvertierten Masken werden im angegebenen Ausgabeverzeichnis gespeichert.
from ultralytics.data.converter import convert_segment_masks_to_yolo_seg

# The classes here is the total classes in the dataset.
# for COCO dataset we have 80 classes.
convert_segment_masks_to_yolo_seg(masks_dir="path/to/masks_dir", output_dir="path/to/output_dir", classes=80)
Link to this sectionCOCO in das YOLO-Format konvertieren#
Verwende dies, um COCO JSON-Annotationen in das YOLO-Format zu konvertieren. Setze für Objekterkennungsdatensätze (Bounding Box) sowohl use_segments als auch use_keypoints auf False.
from ultralytics.data.converter import convert_coco

convert_coco(
    "coco/annotations/",
    use_segments=False,
    use_keypoints=False,
    cls91to80=True,
)
Für weitere Informationen über die convert_coco-Funktion besuche die Referenzseite.
Link to this sectionBounding-Box-Dimensionen abrufen#
import cv2

from ultralytics import YOLO
from ultralytics.utils.plotting import Annotator

model = YOLO("yolo26n.pt")  # Load pretrain or fine-tune model

# Process the image
source = cv2.imread("path/to/image.jpg")
results = model(source)

# Extract results
annotator = Annotator(source, example=model.names)

for box in results[0].boxes.xyxy.cpu():
    width, height, area = annotator.get_bbox_dimension(box)
    print(f"Bounding Box Width {width.item()}, Height {height.item()}, Area {area.item()}")
Link to this sectionBounding Boxes in Segmente konvertieren#
Konvertiere vorhandene x y w h Bounding-Box-Daten mit der Funktion yolo_bbox2segment in Segmente. Organisiere die Dateien für Bilder und Annotationen wie folgt:
data
|__ images
    ├─ 001.jpg
    ├─ 002.jpg
    ├─ ..
    └─ NNN.jpg
|__ labels
    ├─ 001.txt
    ├─ 002.txt
    ├─ ..
    └─ NNN.txt
from ultralytics.data.converter import yolo_bbox2segment
yolo_bbox2segment(
im_dir="path/to/images",
save_dir=None, # saved to "labels-segment" in images directory
sam_model="sam_b.pt",
)Besuche die yolo_bbox2segment-Referenzseite für weitere Informationen zu dieser Funktion.
Link to this sectionSegmente in Bounding Boxes konvertieren#
Wenn du einen Datensatz hast, der das Segmentierungs-Dataset-Format verwendet, kannst du diesen mit dieser Funktion einfach in aufrechte (oder horizontale) Bounding Boxes (x y w h-Format) konvertieren.
import numpy as np

from ultralytics.utils.ops import segments2boxes

segments = np.array(
    [
        [805, 392, 797, 400, 812, 402, 808, 714, 808, 392],
        [115, 398, 113, 400, 150, 410, 150, 400, 149, 298],
        [267, 412, 265, 413, 300, 420, 300, 413, 299, 412],
    ],
    dtype=np.float32,
)

segments2boxes([s.reshape(-1, 2) for s in segments])
# >>> array([[804.5, 553. ,  15. , 322. ],
#           [131.5, 354. ,  37. , 112. ],
#           [282.5, 416. ,  35. ,   8. ]],
#           dtype=float32) # xywh bounding boxes
Um zu verstehen, wie diese Funktion funktioniert, besuche die Referenzseite.
Link to this sectionHilfsprogramme#
Link to this sectionBildkomprimierung#
Komprimiere eine einzelne Bilddatei auf eine reduzierte Größe, während das Seitenverhältnis und die Qualität erhalten bleiben. Wenn das Eingabebild kleiner als die maximale Dimension ist, wird es nicht in der Größe verändert.
from pathlib import Path

from ultralytics.data.utils import compress_one_image

for f in Path("path/to/dataset").rglob("*.jpg"):
    compress_one_image(f)
Link to this sectionDataset automatisch aufteilen#
Teile einen Datensatz automatisch in train/val/test-Aufteilungen auf und speichere die resultierenden Aufteilungen in autosplit_*.txt-Dateien. Diese Funktion verwendet zufällige Stichproben, die ausgeschlossen sind, wenn das fraction-Argument für das Training verwendet wird.
from ultralytics.data.split import autosplit

autosplit(
    path="path/to/images",
    weights=(0.9, 0.1, 0.0),  # (train, validation, test) fractional splits
    annotated_only=False,  # split only images with annotation file when True
)
Siehe die Referenzseite für weitere Details zu dieser Funktion.
Link to this sectionSegment-Polygon zu binärer Maske#
Konvertiere ein einzelnes Polygon (als Liste) in eine binäre Maske der angegebenen Bildgröße. Das Polygon sollte ein flaches 1D-Array von N Koordinaten sein, die abwechselnd x, y-Werte auflisten, die die Polygonkontur definieren.
N muss immer gerade sein.
import numpy as np

from ultralytics.data.utils import polygon2mask

imgsz = (1080, 810)
polygon = np.array([805, 392, 797, 400, ..., 808, 714, 808, 392])  # (238, 2)

mask = polygon2mask(
    imgsz,  # tuple
    [polygon],  # input as list
    color=255,  # 8-bit binary
    downsample_ratio=1,
)
Link to this sectionBounding Boxes#
Link to this sectionBounding Box (horizontal) Instanzen#
Um Bounding-Box-Daten zu verwalten, hilft die Bboxes-Klasse beim Konvertieren zwischen Box-Koordinatenformaten, Skalieren von Box-Dimensionen, Berechnen von Flächen, Einbeziehen von Offsets und mehr.
import numpy as np

from ultralytics.utils.instance import Bboxes

boxes = Bboxes(
    bboxes=np.array(
        [
            [22.878, 231.27, 804.98, 756.83],
            [48.552, 398.56, 245.35, 902.71],
            [669.47, 392.19, 809.72, 877.04],
            [221.52, 405.8, 344.98, 857.54],
            [0, 550.53, 63.01, 873.44],
            [0.0584, 254.46, 32.561, 324.87],
        ]
    ),
    format="xyxy",
)

boxes.areas()
# >>> array([ 4.1104e+05,       99216,       68000,       55772,       20347,      2288.5])

boxes.convert("xywh")
print(boxes.bboxes)
# >>> array(
#     [[ 413.93, 494.05,  782.1, 525.56],
#      [ 146.95, 650.63,  196.8, 504.15],
#      [  739.6, 634.62, 140.25, 484.85],
#      [ 283.25, 631.67, 123.46, 451.74],
#      [ 31.505, 711.99,  63.01, 322.91],
#      [  16.31, 289.67, 32.503,  70.41]]
# )
Siehe den Bboxes-Referenzabschnitt für weitere Attribute und Methoden.
Viele der folgenden Funktionen (und mehr) können über die Bboxes-Klasse aufgerufen werden, aber wenn du lieber direkt mit den Funktionen arbeiten möchtest, siehe die nächsten Unterabschnitte, wie man sie unabhängig importiert.
Link to this sectionBoxen skalieren#
Wenn du ein Bild vergrößerst oder verkleinerst, kannst du die entsprechenden Bounding-Box-Koordinaten mit ultralytics.utils.ops.scale_boxes passend skalieren.
import cv2 as cv
import numpy as np

from ultralytics.utils.ops import scale_boxes

image = cv.imread("ultralytics/assets/bus.jpg")
h, w, c = image.shape
resized = cv.resize(image, None, (), fx=1.2, fy=1.2)
new_h, new_w, _ = resized.shape

xyxy_boxes = np.array(
    [
        [22.878, 231.27, 804.98, 756.83],
        [48.552, 398.56, 245.35, 902.71],
        [669.47, 392.19, 809.72, 877.04],
        [221.52, 405.8, 344.98, 857.54],
        [0, 550.53, 63.01, 873.44],
        [0.0584, 254.46, 32.561, 324.87],
    ]
)

new_boxes = scale_boxes(
    img1_shape=(h, w),  # original image dimensions
    boxes=xyxy_boxes,  # boxes from original image
    img0_shape=(new_h, new_w),  # resized image dimensions (scale to)
    ratio_pad=None,
    padding=False,
    xywh=False,
)

print(new_boxes)
# >>> array(
#     [[  27.454,  277.52,  965.98,   908.2],
#     [   58.262,  478.27,  294.42,  1083.3],
#     [   803.36,  470.63,  971.66,  1052.4],
#     [   265.82,  486.96,  413.98,    1029],
#     [        0,  660.64,  75.612,  1048.1],
#     [   0.0701,  305.35,  39.073,  389.84]]
# )
Link to this sectionBounding-Box-Formatkonvertierungen#
Link to this sectionXYXY → XYWH#
Konvertiere Bounding-Box-Koordinaten vom (x1, y1, x2, y2)-Format in das (x, y, Breite, Höhe)-Format, wobei (x1, y1) die obere linke Ecke und (x2, y2) die untere rechte Ecke ist.
import numpy as np

from ultralytics.utils.ops import xyxy2xywh

xyxy_boxes = np.array(
    [
        [22.878, 231.27, 804.98, 756.83],
        [48.552, 398.56, 245.35, 902.71],
        [669.47, 392.19, 809.72, 877.04],
        [221.52, 405.8, 344.98, 857.54],
        [0, 550.53, 63.01, 873.44],
        [0.0584, 254.46, 32.561, 324.87],
    ]
)
xywh = xyxy2xywh(xyxy_boxes)

print(xywh)
# >>> array(
#     [[ 413.93,  494.05,   782.1, 525.56],
#     [  146.95,  650.63,   196.8, 504.15],
#     [   739.6,  634.62,  140.25, 484.85],
#     [  283.25,  631.67,  123.46, 451.74],
#     [  31.505,  711.99,   63.01, 322.91],
#     [   16.31,  289.67,  32.503,  70.41]]
# )
Link to this sectionAlle Bounding-Box-Konvertierungen#
from ultralytics.utils.ops import (
    ltwh2xywh,
    ltwh2xyxy,
    xywh2ltwh,  # xywh → top-left corner, w, h
    xywh2xyxy,
    xywhn2xyxy,  # normalized → pixel
    xyxy2ltwh,  # xyxy → top-left corner, w, h
    xyxy2xywhn,  # pixel → normalized
)

for func in (ltwh2xywh, ltwh2xyxy, xywh2ltwh, xywh2xyxy, xywhn2xyxy, xyxy2ltwh, xyxy2xywhn):
    print(help(func))  # print function docstrings
Siehe den Docstring jeder Funktion oder besuche die ultralytics.utils.ops Referenzseite, um mehr zu lesen.
Link to this sectionPlotten#
Link to this sectionAnnotation-Hilfsprogramme#
Ultralytics enthält eine Annotator-Klasse zum Annotieren verschiedener Datentypen. Sie wird am besten mit Objekterkennungs-Bounding Boxes, Pose-Keypoints und orientierten Bounding Boxes verwendet.
Link to this sectionBox-Annotation#
import cv2 as cv
import numpy as np

from ultralytics.utils.plotting import Annotator, colors

names = {
    0: "person",
    5: "bus",
    11: "stop sign",
}

image = cv.imread("ultralytics/assets/bus.jpg")
ann = Annotator(
    image,
    line_width=None,  # default auto-size
    font_size=None,  # default auto-size
    font="Arial.ttf",  # must be ImageFont compatible
    pil=False,  # use PIL, otherwise uses OpenCV
)

xyxy_boxes = np.array(
    [
        [5, 22.878, 231.27, 804.98, 756.83],  # class-idx x1 y1 x2 y2
        [0, 48.552, 398.56, 245.35, 902.71],
        [0, 669.47, 392.19, 809.72, 877.04],
        [0, 221.52, 405.8, 344.98, 857.54],
        [0, 0, 550.53, 63.01, 873.44],
        [11, 0.0584, 254.46, 32.561, 324.87],
    ]
)

for nb, box in enumerate(xyxy_boxes):
    c_idx, *box = box
    label = f"{str(nb).zfill(2)}:{names.get(int(c_idx))}"
    ann.box_label(box, label, color=colors(c_idx, bgr=True))

image_with_bboxes = ann.result()
Namen können aus model.names verwendet werden, wenn man mit Erkennungsergebnissen arbeitet. Siehe auch die Annotator-Referenzseite für zusätzliche Einblicke.
Link to this sectionUltralytics Sweep-Annotation#
import cv2
import numpy as np

from ultralytics import YOLO
from ultralytics.solutions.solutions import SolutionAnnotator
from ultralytics.utils.plotting import colors

# User defined video path and model file
cap = cv2.VideoCapture("path/to/video.mp4")
model = YOLO(model="yolo26s-seg.pt")  # Model file, e.g., yolo26s.pt or yolo26m-seg.pt

if not cap.isOpened():
    print("Error: Could not open video.")
    exit()

# Initialize the video writer object.
w, h, fps = (int(cap.get(x)) for x in (cv2.CAP_PROP_FRAME_WIDTH, cv2.CAP_PROP_FRAME_HEIGHT, cv2.CAP_PROP_FPS))
video_writer = cv2.VideoWriter("ultralytics.avi", cv2.VideoWriter_fourcc(*"mp4v"), fps, (w, h))

masks = None  # Initialize variable to store masks data
f = 0  # Initialize frame count variable for enabling mouse event.
line_x = w  # Store width of line.
dragging = False  # Initialize bool variable for line dragging.
classes = model.names  # Store model classes names for plotting.
window_name = "Ultralytics Sweep Annotator"

def drag_line(event, x, _, flags, param):
    """Mouse callback function to enable dragging a vertical sweep line across the video frame."""
    global line_x, dragging
    if event == cv2.EVENT_LBUTTONDOWN or (flags & cv2.EVENT_FLAG_LBUTTON):
        line_x = max(0, min(x, w))
        dragging = True

while cap.isOpened():  # Loop over the video capture object.
    ret, im0 = cap.read()
    if not ret:
        break
    f = f + 1  # Increment frame count.
    count = 0  # Re-initialize count variable on every frame for precise counts.
    results = model.track(im0, persist=True)[0]

    if f == 1:
        cv2.namedWindow(window_name)
        cv2.setMouseCallback(window_name, drag_line)

    annotator = SolutionAnnotator(im0)

    if results.boxes.is_track:
        if results.masks is not None:
            masks = [np.array(m, dtype=np.int32) for m in results.masks.xy]

        boxes = results.boxes.xyxy.tolist()
        track_ids = results.boxes.id.int().cpu().tolist()
        clss = results.boxes.cls.cpu().tolist()

        for mask, box, cls, t_id in zip(masks or [None] * len(boxes), boxes, clss, track_ids):
            color = colors(t_id, True)  # Assign different color to each tracked object.
            label = f"{classes[cls]}:{t_id}"
            if mask is not None and mask.size > 0:
                if box[0] > line_x:
                    count += 1
                    cv2.polylines(im0, [mask], True, color, 2)
                    x, y = mask.min(axis=0)
                    (w_m, _), _ = cv2.getTextSize(label, cv2.FONT_HERSHEY_SIMPLEX, 0.5, 1)
                    cv2.rectangle(im0, (x, y - 20), (x + w_m, y), color, -1)
                    cv2.putText(im0, label, (x, y - 5), cv2.FONT_HERSHEY_SIMPLEX, 0.5, (255, 255, 255), 1)
            else:
                if box[0] > line_x:
                    count += 1
                    annotator.box_label(box=box, color=color, label=label)

    # Generate draggable sweep line
    annotator.sweep_annotator(line_x=line_x, line_y=h, label=f"COUNT:{count}")

    cv2.imshow(window_name, im0)
    video_writer.write(im0)
    if cv2.waitKey(1) & 0xFF == ord("q"):
        break

# Release the resources
cap.release()
video_writer.release()
cv2.destroyAllWindows()
Weitere Details zur sweep_annotator-Methode findest du in unserem Referenzabschnitt hier.
Link to this sectionAdaptive Label-Annotation#
Ab Ultralytics v8.3.167 wurden circle_label und text_label durch eine einheitliche adaptive_label-Funktion ersetzt. Du kannst jetzt den Annotationstyp über das shape-Argument angeben:
- Rechteck:
annotator.adaptive_label(box, label=names[int(cls)], color=colors(cls, True), shape="rect") - Kreis:
annotator.adaptive_label(box, label=names[int(cls)], color=colors(cls, True), shape="circle")
Watch: In-Depth Guide to Text & Circle Annotations with Python Live Demos | Ultralytics Annotations 🚀
import cv2

from ultralytics import YOLO
from ultralytics.solutions.solutions import SolutionAnnotator
from ultralytics.utils.plotting import colors

model = YOLO("yolo26s.pt")
names = model.names
cap = cv2.VideoCapture("path/to/video.mp4")

w, h, fps = (int(cap.get(x)) for x in (cv2.CAP_PROP_FRAME_WIDTH, cv2.CAP_PROP_FRAME_HEIGHT, cv2.CAP_PROP_FPS))
writer = cv2.VideoWriter("Ultralytics circle annotation.avi", cv2.VideoWriter_fourcc(*"MJPG"), fps, (w, h))

while True:
    ret, im0 = cap.read()
    if not ret:
        break

    annotator = SolutionAnnotator(im0)
    results = model.predict(im0)[0]
    boxes = results.boxes.xyxy.cpu()
    clss = results.boxes.cls.cpu().tolist()

    for box, cls in zip(boxes, clss):
        annotator.adaptive_label(box, label=names[int(cls)], color=colors(cls, True), shape="circle")
    writer.write(im0)
    cv2.imshow("Ultralytics circle annotation", im0)

    if cv2.waitKey(1) & 0xFF == ord("q"):
        break

writer.release()
cap.release()
cv2.destroyAllWindows()
Siehe die SolutionAnnotator-Referenzseite für zusätzliche Einblicke.
Link to this sectionVerschiedenes#
Link to this sectionCode-Profiling#
Überprüfe die Dauer der Codeausführung/-verarbeitung entweder mit with oder als Decorator.
from ultralytics.utils.ops import Profile

with Profile(device="cuda:0") as dt:
    pass  # operation to measure

print(dt)
# >>> "Elapsed time is 9.5367431640625e-07 s"
Link to this sectionVon Ultralytics unterstützte Formate#
Musst du die unterstützten Bild- oder Videoformate in Ultralytics programmatisch verwenden? Verwende bei Bedarf diese Konstanten:
from ultralytics.data.utils import IMG_FORMATS, VID_FORMATS

print(IMG_FORMATS)
# {'avif', 'bmp', 'dng', 'heic', 'heif', 'jp2', 'jpeg', 'jpg', 'mpo', 'png', 'tif', 'tiff', 'webp'}

print(VID_FORMATS)
# {'asf', 'avi', 'gif', 'm4v', 'mkv', 'mov', 'mp4', 'mpeg', 'mpg', 'ts', 'wmv', 'webm'}
Link to this sectionTeilbar machen#
Berechne die kleinste ganze Zahl, die größer oder gleich x ist und die ohne Rest durch y teilbar ist.
from ultralytics.utils.ops import make_divisible

make_divisible(7, 3)
# >>> 9
make_divisible(7, 2)
# >>> 8
Link to this sectionFAQ#
Link to this sectionWelche Hilfsprogramme sind im Ultralytics-Paket enthalten, um Machine-Learning-Workflows zu verbessern?#
Das Ultralytics-Paket enthält Dienstprogramme, die darauf ausgelegt sind, Machine-Learning-Workflows zu rationalisieren und zu optimieren. Zu den wichtigsten Dienstprogrammen gehören die automatische Annotation für die Beschriftung von Datensätzen, das Konvertieren von COCO in das YOLO-Format mit convert_coco, das Komprimieren von Bildern und die automatische Aufteilung von Datensätzen. Diese Werkzeuge reduzieren den manuellen Aufwand, stellen Konsistenz sicher und verbessern die Effizienz der Datenverarbeitung.
Link to this sectionWie kann ich Ultralytics verwenden, um meinen Datensatz automatisch zu etikettieren?#
Wenn du ein vortrainiertes Ultralytics YOLO-Objekterkennungsmodell hast, kannst du es mit dem SAM-Modell verwenden, um deinen Datensatz automatisch im Segmentierungsformat zu annotieren. Hier ist ein Beispiel:
from ultralytics.data.annotator import auto_annotate

auto_annotate(
    data="path/to/new/data",
    det_model="yolo26n.pt",
    sam_model="mobile_sam.pt",
    device="cuda",
    output_dir="path/to/save_labels",
)
Für weitere Details siehe den auto_annotate Referenzabschnitt oder verwende die Ultralytics Plattform als gehostete No-Code-Alternative mit klickbasierter Maskierung via SAM 2.1 oder SAM 3, oder Vorhersagen von vortrainierten und feinabgestimmten YOLO-Modellen für Detect-, Segment- und OBB-Aufgaben.
Link to this sectionWie konvertiere ich COCO-Dataset-Annotationen in Ultralytics in das YOLO-Format?#
Um COCO JSON-Annotationen für die Objekterkennung in das YOLO-Format zu konvertieren, kannst du das Hilfsprogramm convert_coco verwenden. Hier ist ein Beispielcode-Schnipsel:
from ultralytics.data.converter import convert_coco

convert_coco(
    "coco/annotations/",
    use_segments=False,
    use_keypoints=False,
    cls91to80=True,
)
Für weitere Informationen besuche die convert_coco Referenzseite.
Link to this sectionWie kann ich meine Datensatz-Zusammensetzung und -Verteilung analysieren?#
Ultralytics Plattform bietet automatische Dataset-Analysen: Der Charts-Tab zeigt die Verteilung der Aufteilungen, die Top-Klassenzählungen, Histogramme der Bilddimensionen und 2D-Heatmaps der Annotationspositionen, was dir hilft, Ungleichgewichte und Ausreißer vor dem Training zu erkennen.
Link to this sectionWie kann ich in Ultralytics Bounding Boxes in Segmente konvertieren?#
Um vorhandene Bounding-Box-Daten (im x y w h-Format) in Segmente zu konvertieren, kannst du die Funktion yolo_bbox2segment verwenden. Stelle sicher, dass deine Dateien mit separaten Verzeichnissen für Bilder und Labels organisiert sind.
from ultralytics.data.converter import yolo_bbox2segment

yolo_bbox2segment(
    im_dir="path/to/images",
    save_dir=None,  # saved to "labels-segment" in the images directory
    sam_model="sam_b.pt",
)
Für weitere Informationen besuche die yolo_bbox2segment Referenzseite.