Data Collection and Annotation Strategies for Computer Vision
Data collection and annotation are the two foundational steps of every computer vision project: you gather representative images or video, then label them so a model can learn from them. The quality of this data directly determines model performance, which is why class definition, unbiased sourcing, and consistent annotation matter before any training begins.
Watch: How to Build Effective Data Collection and Annotation Strategies for Computer Vision 🚀
This guide covers setting up classes and collecting data, what data annotation is along with the annotation types and formats to choose from, and efficient labeling strategies — every decision aligned with your project's goals.
Setting Up Classes and Collecting Data#
Collecting images and video for a computer vision project comes down to three decisions: how many classes to define, where to source the data, and how to keep the dataset free of bias.
Choosing the Right Classes for Your Project#
One of the first questions when starting a computer vision project is how many classes to include. You need to determine the class membership, which involves the different categories or labels that you want your model to recognize and differentiate. The number of classes should be determined by the specific goals of your project.
For example, if you want to monitor traffic, your classes might include "car," "truck," "bus," "motorcycle," and "bicycle." On the other hand, for tracking items in a store, your classes could be "fruits," "vegetables," "beverages," and "snacks." Defining classes based on your project goals helps keep your dataset relevant and focused.
When you define your classes, another important distinction to make is whether to choose coarse or fine class counts. 'Count' refers to the number of distinct classes you are interested in. This decision influences the granularity of your data and the complexity of your model. Here are the considerations for each approach:
- Coarse Class-Count: These are broader, more inclusive categories, such as "vehicle" and "non-vehicle." They simplify annotation and require fewer computational resources but provide less detailed information, potentially limiting the model's effectiveness in complex scenarios.
- Fine Class-Count: More categories with finer distinctions, such as "sedan," "SUV," "pickup truck," and "motorcycle." They capture more detailed information, improving model accuracy and performance. However, they are more time-consuming and labor-intensive to annotate and require more computational resources.
Starting with more specific classes can be very helpful, especially in complex projects where details are important. More specific classes let you collect more detailed data, gain deeper insights, and establish clearer distinctions between categories. Not only does it improve the accuracy of the model, but it also makes it easier to adjust the model later if needed, saving both time and resources.
Sources of Data#
You can use public datasets or gather your own custom data. Public datasets like those on Kaggle and Google Dataset Search Engine offer well-annotated, standardized data, making them great starting points for training and validating models.
Custom data collection, on the other hand, allows you to customize your dataset to your specific needs. You might capture images and videos with cameras or drones, scrape the web for images, or use existing internal data from your organization. Custom data gives you more control over its quality and relevance. Combining both public and custom data sources helps create a diverse and comprehensive dataset.
Avoiding Bias in Data Collection#
Bias occurs when certain groups or scenarios are underrepresented or overrepresented in your dataset. It leads to a model that performs well on some data but poorly on others. It's crucial to avoid bias in AI so that your computer vision model can perform well in a variety of scenarios.
Here is how you can avoid bias while collecting data:
- Diverse Sources: Collect data from many sources to capture different perspectives and scenarios.
- Balanced Representation: Include balanced representation from all relevant groups. For example, consider different ages, genders, and ethnicities.
- Continuous Monitoring: Regularly review and update your dataset to identify and address any emerging biases.
- Bias Mitigation Techniques: Use methods like oversampling underrepresented classes, data augmentation, and fairness-aware algorithms.
Following these practices helps create a more robust and fair model that can generalize well in real-world applications.
What is Data Annotation?#
Data annotation is the process of labeling data to make it usable for training machine learning models. In computer vision, this means labeling images or videos with the information that a model needs to learn from. Without properly annotated data, models cannot accurately learn the relationships between inputs and outputs.
Types of Data Annotation#
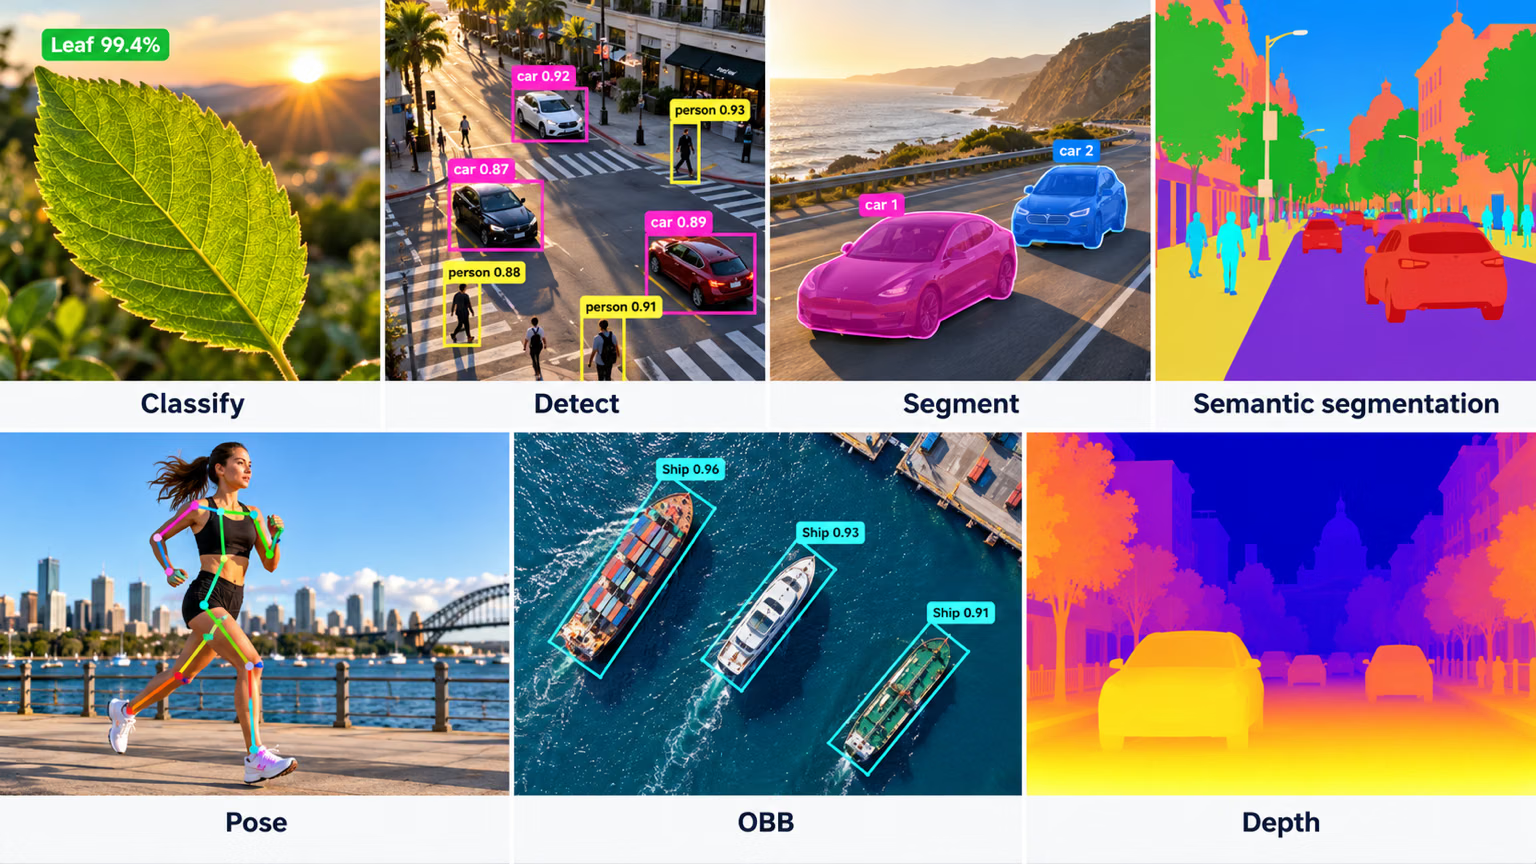
Depending on the specific requirements of a computer vision task, there are different types of data annotation. Here are some examples:
- Bounding Boxes: Rectangular boxes drawn around objects in an image, used primarily for object detection tasks. These boxes are defined by their top-left and bottom-right coordinates.
- Polygons: Detailed outlines for objects, allowing for more precise annotation than bounding boxes. Polygons are used in tasks like instance segmentation, where the shape of the object is important.
- Masks: Binary masks where each pixel is either part of an object or the background. Masks are used in semantic segmentation tasks to provide pixel-level detail.
- Keypoints: Specific points marked within an image to identify locations of interest. Keypoints are used in tasks like pose estimation and facial landmark detection.
- Oriented Bounding Boxes: Rectangles that carry a rotation angle, used in OBB tasks where objects appear at arbitrary orientations, such as aerial imagery.
Common Annotation Formats#
After selecting a type of annotation, it's important to choose the appropriate format for storing and sharing annotations. The most common formats are:
| Format | File structure | Commonly used for |
|---|---|---|
| COCO | Single JSON file | Object detection, instance segmentation, keypoint detection, stuff and panoptic segmentation, image captioning |
| Pascal VOC | One XML file per image | Object detection |
| YOLO | One .txt file per image | Object detection, segmentation, pose, and oriented boxes |
The YOLO format stores one row per object with class indices starting from 0. For object detection the row is class x_center y_center width height with normalized 0–1 coordinates. A segmentation row replaces the box with the object's normalized polygon points, while a pose row keeps the box and appends the keypoint coordinates after it, with a visibility flag per keypoint when the dataset declares kpt_shape: [n, 3]. An OBB row stores class x1 y1 x2 y2 x3 y3 x4 y4 using normalized corner coordinates.
If your annotation tool exports COCO JSON, you can either convert it to YOLO .txt labels or train on the JSON directly with a custom dataset class.
Setting Annotation Guidelines#
With a type of annotation and format chosen, the next step is to establish clear and objective labeling rules. These rules act as a roadmap for consistency and accuracy throughout the annotation process. Key aspects of these rules include:
- Clarity and Detail: Make sure your instructions are clear. Use examples and illustrations to show what's expected.
- Consistency: Keep your annotations uniform. Set standard criteria for annotating different types of data, so all annotations follow the same rules.
- Reducing Bias: Stay neutral. Train yourself to be objective and minimize personal biases to ensure fair annotations.
- Efficiency: Use tools and workflows that automate repetitive tasks, making the annotation process faster and more efficient.
Regularly reviewing and updating your labeling rules will help keep your annotations accurate, consistent, and aligned with your project goals.
Annotation Tools#
A good annotation tool lets you label every type your task needs, enforces consistent guidelines, and exports labels in a training-ready format. Ultralytics Platform provides a built-in annotation editor covering detection, instance segmentation, semantic segmentation, classification, pose, and OBB, with SAM-powered smart annotation that turns a single click into a mask for detection, instance segmentation, semantic segmentation, and OBB tasks. Because annotations are saved in the layout each task expects — YOLO .txt rows for the spatial tasks and class folders for classification — your labeled dataset moves straight into training with no conversion step.
Annotation Quality: Accuracy, Precision, and Outliers#
Before annotating at scale, it helps to understand accuracy, precision, outliers, and quality control, so you don't label your data in a counterproductive way.
Understanding Accuracy and Precision#
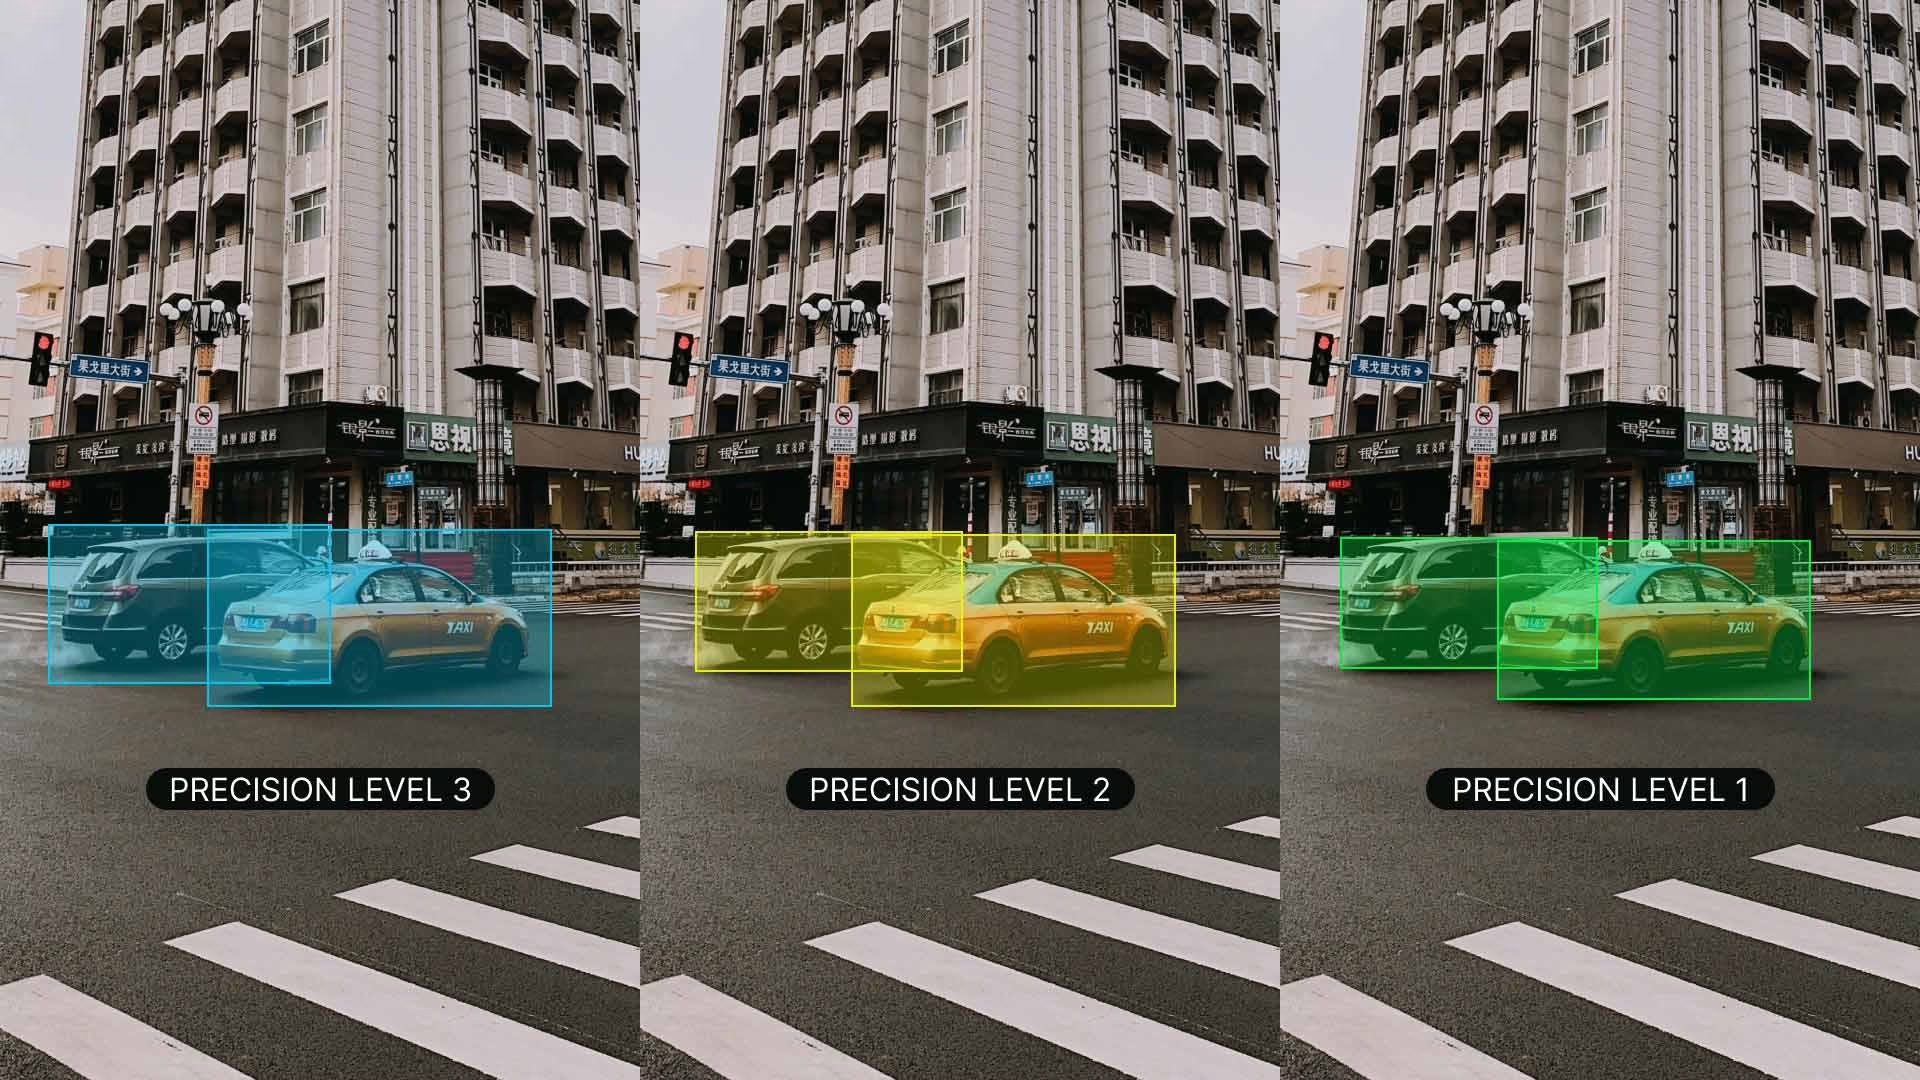
It's important to understand the difference between accuracy and precision and how it relates to annotation. Accuracy refers to how close the annotated data is to the true values. It helps us measure how closely the labels reflect real-world scenarios. Precision indicates the consistency of annotations. It checks if you are giving the same label to the same object or feature throughout the dataset. High accuracy and precision lead to better-trained models by reducing noise and improving the model's ability to generalize from the training data.
Identifying Outliers#
Outliers are data points that deviate quite a bit from other observations in the dataset. With respect to annotations, an outlier could be an incorrectly labeled image or an annotation that doesn't fit with the rest of the dataset. Outliers are concerning because they can distort the model's learning process, leading to inaccurate predictions and poor generalization.
You can use various methods to detect and correct outliers:
- Statistical Techniques: To detect outliers in numerical features like pixel values, bounding box coordinates, or object sizes, you can use methods such as box plots, histograms, or z-scores.
- Visual Techniques: To spot anomalies in categorical features like object classes, colors, or shapes, use visual methods like plotting images, labels, or heat maps.
- Algorithmic Methods: Use tools like clustering (e.g., K-means clustering, DBSCAN) and anomaly detection algorithms to identify outliers based on data distribution patterns.
Quality Control of Annotated Data#
Just like other technical projects, quality control is a must for annotated data. It is a good practice to regularly check annotations to make sure they are accurate and consistent. This can be done in a few different ways:
- Reviewing samples of annotated data
- Using automated tools to spot common errors
- Having another person double-check the annotations
If you are working with multiple people, consistency between different annotators is important. Good inter-annotator agreement means that the guidelines are clear and everyone is following them the same way. It keeps everyone on the same page and the annotations consistent.
While reviewing, if you find errors, correct them and update the guidelines to avoid future mistakes. Provide feedback to annotators and offer regular training to help reduce errors. Having a strong process for handling errors keeps your dataset accurate and reliable.
Efficient Data Labeling Strategies#
To make the process of data labeling smoother and more effective, consider implementing these strategies:
- Clear Annotation Guidelines: Provide detailed instructions with examples to ensure all annotators interpret tasks consistently. For instance, when labeling birds, specify whether to include the entire bird or just specific parts.
- Regular Quality Checks: Set benchmarks and use specific metrics to review work, maintaining high standards through continuous feedback.
- Use Pre-annotation Tools: Many modern annotation platforms offer AI-assisted pre-annotation features that can significantly speed up the process by automatically generating initial annotations that humans can then refine.
- Implement Active Learning: This approach prioritizes labeling the most informative samples first, which can reduce the total number of annotations needed while maintaining model performance.
- Batch Processing: Group similar images together for annotation to maintain consistency and improve efficiency.
These strategies can help maintain high-quality annotations while reducing the time and resources required for the labeling process.
Conclusion#
Collecting diverse, unbiased data and annotating it consistently with the right tools is the foundation of a reliable computer vision model. With your dataset collected and labeled, continue to the steps of a computer vision project guide to move into training and evaluation. If questions come up along the way, ask the community on the Ultralytics GitHub repository or the Ultralytics Discord server.
FAQ#
To minimize bias, collect data from diverse sources, ensure balanced representation across all relevant groups (such as different ages, genders, and ethnicities), regularly review and update your dataset to catch emerging biases, and apply mitigation techniques like oversampling underrepresented classes, data augmentation, and fairness-aware algorithms. Avoiding bias this way keeps your computer vision model performing well across varied real-world scenarios and improves its generalization capability.
Establish clear, objective labeling guidelines with detailed instructions, examples, and illustrations, then apply them uniformly across all data types so every annotation follows the same rules. Train annotators to stay neutral to reduce personal bias, review and update the guidelines regularly, and use automated consistency checks plus inter-annotator feedback to keep accuracy high and aligned with your project goals.
A few hundred annotated objects per class is enough to start experimenting with transfer learning, but for reliable real-world performance Ultralytics recommends at least 1,500 images and 10,000 labeled instances per class. Pair a sufficiently large dataset with a reasonable training schedule — around 300 epochs is a common starting point, reduced if the model overfits early — and keep your annotations rigorous and aligned with your project's specific goals. Explore detailed training strategies in the YOLO26 training guide.
Yes. Ultralytics Platform includes a built-in annotation editor that supports bounding boxes, polygons, keypoints, oriented boxes, and classification labels in a single workspace. SAM-powered smart annotation speeds up labeling for detection, instance segmentation, semantic segmentation, and OBB tasks by generating masks from a single click; pose datasets can use YOLO pose models for smart annotation, and classification is annotated manually. Annotations are stored in the layout each task expects — YOLO
.txtrows for the spatial tasks, class folders for classification — ready for training.Match the annotation type to the task you intend to train. Bounding boxes are the fastest to draw and are all object detection needs. Polygons and masks cost noticeably more time per object but are required for instance segmentation when an object's exact shape matters. Keypoints suit pose estimation and landmark detection, and oriented boxes suit OBB tasks such as aerial imagery, where an axis-aligned rectangle would enclose too much background. Annotating for the tightest task you actually need keeps labeling effort proportional to the result.


Comments16
Ask a question, share your results, or help someone else.
 Letícia Rama
Hello,
Has anyone worked with oriented object detection using a multisource dataset that combines satellite and UAV imagery?
I am currently developing a scientific project focused on oriented detection of fishing vessels. As part of this work, I conducted two systematic reviews: one covering existing oriented detection models and another covering publicly available datasets. So far, I have identified multisource datasets that combine imagery from multiple satellite platforms; however, I have not found datasets that explicitly integrate both satellite and UAV images.
I understand the importance of source diversity to mitigate dataset bias and improve model generalization. That said, I would appreciate insights from the community on whether combining UAV and satellite imagery might introduce excessive domain variability (e.g., differences in spatial resolution, viewing angles, and sensor characteristics), potentially hindering model training and convergence.
Any experiences, references, or best practices related to this type of multisource setup would be highly appreciated.
 Glenn JocherUltralytics
Great question—mixing UAV + satellite can increase domain shift (GSD/resolution, look-angle, sensor PSF), but it’s usually manageable if you control the dataset and evaluation: keep one unified, very explicit labeling policy (same object extent/rotation rules) and balanced sampling as described in our Data Collection and Annotation guide, then train with per-source “slice” validation (sat-only/UAV-only) and consider staged training (pretrain on the larger domain, then fine-tune on the smaller) rather than a single fully-mixed run; if you’re using Ultralytics YOLO for oriented detection, the OBB task docs cover the expected label format and training flow—feel free to share your planned split strategy and a couple example tiles (UAV + satellite) here and the team/community can sanity-check the setup.
1- Letícia Rama
Hi Glenn,
To be more specific,
I am using a pretrained yolo26 m obb to perform detection of a single class: ships of a particular type (fishing boats).
I have a dataset with satellite optical images collected from google earth pro counting 331 pairs of images/labels. The total number of instances is 5974. Images size are fixed at 4823 height x 8192 width. The bounding boxes have 0.075 height x 0.04 width (according to yolo train results). Resolution varies from very-low to very-high. The images were captured with an altitude between 200-400 meters.
I also have 21 very-high resolution images collected from UAV. Images size are fixed at 3072 height x 4096 width. The images were captured with an altitude of 120 meters.
I would like to test if incorporating UAV images in training data would improved the models hability to detect the objects.
From what you proposed, please confirm if I understood correctly:
- Should the train set be mixed (sat+UAV) and the validation set be separate (sat-only/UAV-only)?
- If so, is this separation configured the staged training you are refering? That is, pretrain with sat+UAV as the train set and sat-only as validation subset, and further fine-tune with the same train subset (sat+UAV) but now using the uav-only as the validation set?
Thanks
- Letícia Rama
OBS.: sorry, sometimes I wrote 'train subset', and 'validation subset' but all of them was supposed to be written as 'train set', and 'validation set'.
- Glenn JocherUltralytics
Your first interpretation is correct: compare a satellite-only baseline against mixed satellite+UAV training while keeping fixed, disjoint satellite-only and UAV-only evaluation sets. This is not staged training—changing only the validation set does not fine-tune the model. Staged training would first train on satellite data, then continue from that checkpoint using only the UAV training split with a lower learning rate, evaluating both domains afterward. With only 21 UAV images, split by original scene before tiling to prevent leakage, and consider grouped k-fold validation because a single UAV split will be unstable.
1 - Letícia Rama
Understood, thanks.
Sudharsanam-1
hello ! For detecting 31 Chinese symbols (16 true and 15 fake), how many classes should be used in the model? Is it more efficient to detect the true symbols using only true class , or should we also include the fake symbols as separate classes?
Team-Q-Botix
I’m working on Robocon 2026 (Kung Fu Quest) and using YOLO-seg for detecting KFS symbols — ancient Chinese oracle bone characters. There are 15 true symbols, 15 fake ones (random patterns mimicking the real ones), plus 1 “other” class → total 31 classes.
Do you think instance segmentation (YOLOv8-seg / YOLOv11-seg) is the right approach for these detailed 2D symbols, or would box detection + contour refinement be better? Also, any advice on which model to start with and how large a dataset (per class) you’d recommend for good mask performance on Jetson Orin?
robert-hardman
Hello In object recognition with YOLO11 If we label images by drawing polygons: When training, does YOLO11 convert polygon coordinates to boxes? How does Inference handle polygon coordinates?
- Glenn JocherUltralytics
@robert-hardman yOLO11 does not inherently convert polygon annotations to bounding boxes during training. Polygons are used directly for tasks like instance segmentation, while bounding boxes are utilized for object detection. During inference, polygon annotations are retained for segmentation tasks, ensuring accurate object shape representation. For more on annotation types, refer to Data Annotation Guide.
1
ghost
Hello, thanks for the info ! I would like to know how to perform active learning, specifically what are the metrics to choose the most informative images when the task is multi-instance multi-class object detection ?
 Paula DerrengerUltralytics(edited)
@cawilchesp hello! Great question on active learning for multi-instance multi-class object detection. Active learning can significantly enhance your model by iteratively selecting the most informative samples for annotation. Here are some key metrics and strategies to consider:
Metrics for Selecting Informative Images:
-
Uncertainty Sampling: Choose images where the model is least confident. This can be measured using:
- Entropy: High entropy indicates uncertainty in predictions.
- Margin Sampling: Select samples where the difference between the top two class probabilities is smallest.
- Least Confidence: Select samples with the lowest maximum class probability.
-
Diversity Sampling: Ensure a diverse set of samples to avoid redundancy.
- Core-Set Selection: Use clustering techniques to select a diverse subset of data points.
- Representative Sampling: Choose samples that represent the overall data distribution.
-
Error-Based Sampling: Focus on samples where the model previously made errors.
- Misclassified Samples: Select images where the model's predictions were incorrect.
- High Loss Samples: Choose samples with high loss values during training.
Implementing Active Learning:
Here's a basic example using least-confidence uncertainty sampling for detection, based on each image's mean box confidence (
result.probsis only available for classification models):import numpy as np from ultralytics import YOLO # Load your model model = YOLO('yolo26n.pt') # Predict on a batch of images results = model(['image1.jpg', 'image2.jpg', 'image3.jpg']) # Mean box confidence per image (0 if nothing was detected) scores = [r.boxes.conf.mean().item() if len(r.boxes) else 0.0 for r in results] # Select the image with the lowest confidence most_informative_image = results[int(np.argmin(scores))]Additional Resources:
For more detailed strategies and examples, you can refer to our Data Collection and Annotation Strategies.
Feel free to experiment with these methods and see which works best for your specific use case. If you have any further questions or need more examples, don't hesitate to ask! 😊
-
MoAbbasid
Hello, Im looking for an open source annotation tool similar to labelme that exports directly to YOLOv8 format, something other than labelme?
- Glenn JocherUltralytics
@MoAbbasid hello! For an open-source annotation tool that exports directly to YOLOv8 format, you might want to try CVAT. It's quite versatile and supports exporting annotations directly into YOLO format among others. Another good option could be Label Studio, which offers flexibility in configuring export formats, including YOLO. Both tools provide robust features for efficient data labeling and are well-suited for various annotation tasks. Happy annotating! 😊
1 @glenn-jocher do they offer polygon annotations for instance segmentation?
- Glenn JocherUltralytics(edited)
Hello @MoAbbasid,
Yes, Ultralytics YOLO does support polygon annotations for instance segmentation. This allows for more precise labeling of objects compared to traditional bounding boxes, which can be particularly useful for complex shapes and detailed segmentation tasks.
To create polygon annotations, you can use tools like Roboflow Annotate or CVAT. Both of these tools support polygon annotations and can export the data in a format compatible with Ultralytics YOLO.
Here's a brief overview of how you can use Roboflow for this purpose:
- Create a Project: Start by creating a new project in Roboflow.
- Upload Images: Upload your images to the project.
- Annotate Images: Use the polygon tool to draw detailed outlines around objects. Roboflow also offers a SAM-based label assistant to speed up the annotation process.
- Export Annotations: Once your annotations are complete, you can export the dataset in YOLO format.
For more detailed steps on using Roboflow for data annotation and management, you can refer to the Roboflow documentation.
Here's a quick example of how to load and use a dataset with polygon annotations:
from ultralytics import YOLO

# Load a YOLO26 segmentation model
model = YOLO('yolo26n-seg.pt')

# Train the model on your custom dataset
model.train(data='path/to/your/dataset.yaml', epochs=100, imgsz=640)

# Validate the model
metrics = model.val()

# Make predictions
results = model.predict(source='path/to/your/images')

# Visualize results
results[0].show()
Feel free to reach out if you have any more questions or need further assistance. Happy annotating! 😊
1