Link to this sectionObject Counting in Regions with Ultralytics YOLO26#
The RegionCounter solution in Ultralytics YOLO26 tracks objects across video frames and, on every frame, counts the objects whose bounding-box center falls inside each region you define. Each region is drawn on the frame with its own live count, so you can monitor several zones, such as store aisles, road lanes, or production areas, with a single Python call or CLI command.
Watch: Object Counting in Different Regions using Ultralytics YOLO | Ultralytics Solutions
Link to this sectionWhy Use Region Counting?#
- Several zones in one pass: Pass a dictionary of named polygons and each zone gets an independent count drawn on the frame, so one video stream covers every area you care about.
- Tracking built in: The solution runs YOLO26 detection and object tracking internally, so there is no separate tracking pipeline to wire up.
- Counts you can read programmatically: Every processed frame returns a results object with a dictionary of region counts, ready for dashboards, alerts, or logging.
Link to this sectionReal World Applications#
| Retail | Market Streets |
|---|---|
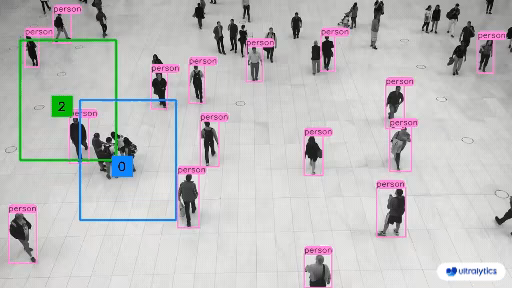 | 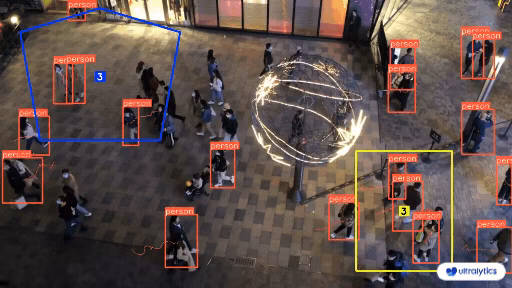 |
| Ultralytics YOLO People Counting in Regions | Ultralytics YOLO Crowd Counting in Regions |
Link to this sectionHow to Count Objects in Regions with Ultralytics YOLO#
Run the RegionCounter solution on a video source from the CLI or Python. A region can be a list of points (a single zone) or a dictionary that maps zone names to point lists. The Python example below counts objects in two named regions and writes the processed frames to an output video file:
# Run a region counting example
yolo solutions region show=True

# Pass a source video
yolo solutions region source="path/to/video.mp4"

# Pass a custom region
yolo solutions region region="[(20, 400), (1080, 400), (1080, 360), (20, 360)]"
Link to this sectionRegionCounter() Arguments#
Here's a table with the RegionCounter arguments:
| Argument | Type | Default | Description |
|---|---|---|---|
model | str | None | Path to an Ultralytics YOLO model file. |
region | list or dict | None | Points defining the region of interest, either a list of (x, y) tuples or a dictionary mapping region names to point lists for multiple regions (RegionCounter only). When None, solutions that require a region fall back to a predefined default. |
The RegionCounter solution enables the use of object tracking parameters:
| Argument | Type | Default | Description |
|---|---|---|---|
tracker | str | 'botsort.yaml' | Specifies the tracking algorithm to use. Built-in options: botsort.yaml, bytetrack.yaml, ocsort.yaml, deepocsort.yaml, fasttrack.yaml, tracktrack.yaml. |
conf | float | 0.1 | Sets the confidence threshold for detections; lower values allow more objects to be tracked but may include false positives. |
iou | float | 0.7 | Sets the Intersection over Union (IoU) threshold for filtering overlapping detections. |
classes | list | None | Filters results by class index. For example, classes=[0, 2, 3] only tracks the specified classes. |
verbose | bool | True | Controls the display of tracking results, providing a visual output of tracked objects. |
device | str | None | Specifies the device for inference (e.g., cpu, cuda:0 or 0). Allows users to select between CPU, a specific GPU, or other compute devices for model execution. |
Additionally, the following visualization settings are supported:
| Argument | Type | Default | Description |
|---|---|---|---|
show | bool | False | If True, displays the annotated images or videos in a window. Useful for immediate visual feedback during development or testing. |
line_width | int or None | None | Specifies the line width of bounding boxes. If None, the line width is automatically adjusted based on the image size. Provides visual customization for clarity. |
show_conf | bool | True | Displays the confidence score for each detection alongside the label. Gives insight into the model's certainty for each detection. |
show_labels | bool | True | Displays labels for each detection in the visual output. Provides immediate understanding of detected objects. |
Link to this sectionHow Region Counting Works#
The RegionCounter solution turns each region you pass into a polygon, with at least three points per region. A plain list of points becomes a single zone named Region#01, while a dictionary keeps your own zone names; each zone is drawn in its own color from the Ultralytics palette. Every frame is then processed in three steps:
- YOLO26 tracking detects and follows every object in the frame
- For each tracked object, the solution computes the bounding-box center and checks which region polygons contain it
- Each region's count is drawn at its center, and the counts reset before the next frame
Because counts restart every frame, the number shown on a region is its current occupancy, meaning how many objects are inside it right now, not a running total. To count objects crossing a boundary cumulatively, use the ObjectCounter solution instead.
Each call also returns a results object whose plot_im attribute holds the annotated frame and whose region_counts dictionary maps region names to their counts, so you can feed the numbers into your own application logic.
Link to this sectionConclusion#
The Ultralytics YOLO26 RegionCounter solution monitors live object counts in as many named zones as you need with a few lines of code. To go further, count boundary crossings with object counting, follow objects inside a single zone with TrackZone, or explore the other Ultralytics Solutions.
Link to this sectionFAQ#
Link to this sectionHow does object counting in regions work in Ultralytics YOLO26?#
Ultralytics YOLO26 counts objects in regions by tracking every object in the frame and testing whether its bounding-box center lies inside each user-defined polygon. The count shown on a region is its current occupancy for that frame, not a cumulative total. Configuration options are listed in the RegionCounter() Arguments section.
Link to this sectionHow do I count objects in multiple regions at once?#
Pass the region argument as a dictionary that maps zone names to point lists, as in the main example:
from ultralytics import solutions

region_points = {
    "region-01": [(50, 50), (250, 50), (250, 250), (50, 250)],
    "region-02": [(640, 640), (780, 640), (780, 720), (640, 720)],
}
regioncounter = solutions.RegionCounter(region=region_points, model="yolo26n.pt", show=True)
Each named zone is drawn in its own color with an independent count.
Link to this sectionHow do I get the region counts programmatically?#
The object returned by each regioncounter(im0) call carries a region_counts dictionary that maps region names to their counts, alongside plot_im (the annotated frame) and total_tracks (the number of tracked objects). Print the results object to inspect all available fields.
Link to this sectionCan I count only specific object classes in a region?#
Yes. Pass the classes argument with the class indices to keep, for example classes=[0] to count only persons with a COCO-pretrained model. The full list of tracking-related arguments is in the RegionCounter() Arguments section.
Link to this sectionWhat is the difference between RegionCounter and ObjectCounter?#
RegionCounter shows how many objects are inside each polygonal zone on the current frame, while ObjectCounter counts objects cumulatively as they cross a line or region boundary, tracking in and out totals. Use RegionCounter for live occupancy of one or more zones and ObjectCounter for entry and exit counting; line-shaped regions are supported by ObjectCounter only.