Link to this section实用工具#
ultralytics 软件包提供了一系列实用工具,旨在支持、增强并加速你的工作流程。虽然还有许多其他工具可用,但本指南重点介绍了对开发者最有用的一些工具,作为你使用 Ultralytics 工具进行编程时的实用参考。
Watch: Ultralytics Utilities | Auto Annotation, Explorer API and Dataset Conversion
Link to this section数据#
Link to this section自动标注 / 注释#
数据集标注 是一个资源密集且耗时的过程。如果你有一个基于一定量数据训练好的 Ultralytics YOLO 目标检测 模型,你可以将其与 SAM 结合使用,以分割格式自动标注额外的数据。
from ultralytics.data.annotator import auto_annotate

auto_annotate(
    data="path/to/new/data",
    det_model="yolo26n.pt",
    sam_model="mobile_sam.pt",
    device="cuda",
    output_dir="path/to/save_labels",
)
此函数不返回任何值。详情请见:
- 参阅
annotator.auto_annotate的参考部分,以更深入了解该函数的运作方式。 - 与 函数
segments2boxes结合使用,同样可以生成目标检测的边界框。
Link to this section可视化数据集标注#
此函数可在训练前将 YOLO 标注可视化显示在图像上,有助于识别并纠正可能导致检测结果不准确的错误标注。它会绘制边界框、使用类别名称标记对象,并根据背景亮度调整文字颜色,以实现更好的可读性。
from ultralytics.data.utils import visualize_image_annotations

label_map = {  # Define the label map with all annotated class labels.
    0: "person",
    1: "car",
}

# Visualize
visualize_image_annotations(
    "path/to/image.jpg",  # Input image path.
    "path/to/annotations.txt",  # Annotation file path for the image.
    label_map,
)
Link to this section将分割掩码转换为 YOLO 格式#
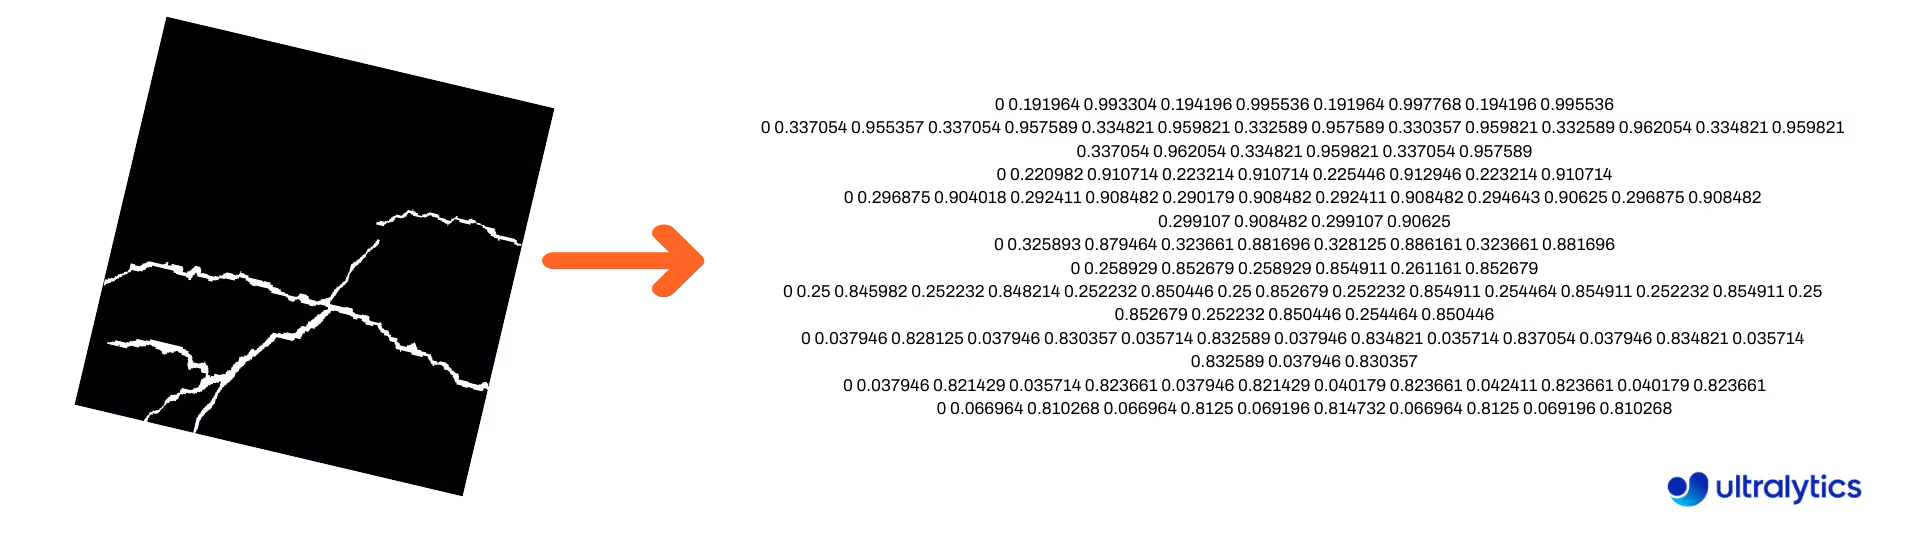
使用此工具将分割掩码图像数据集转换为 Ultralytics YOLO 分割格式。此函数会读取包含二进制格式掩码图像的目录,并将其转换为 YOLO 分割格式。
转换后的掩码将保存到指定的输出目录中。
from ultralytics.data.converter import convert_segment_masks_to_yolo_seg

# The classes here is the total classes in the dataset.
# for COCO dataset we have 80 classes.
convert_segment_masks_to_yolo_seg(masks_dir="path/to/masks_dir", output_dir="path/to/output_dir", classes=80)
Link to this section将 COCO 转换为 YOLO 格式#
使用此工具将 COCO JSON 标注转换为 YOLO 格式。对于目标检测(边界框)数据集,请将 use_segments 和 use_keypoints 均设置为 False。
from ultralytics.data.converter import convert_coco

convert_coco(
    "coco/annotations/",
    use_segments=False,
    use_keypoints=False,
    cls91to80=True,
)
关于 convert_coco 函数的更多信息,请访问参考页面。
Link to this section获取边界框尺寸#
import cv2

from ultralytics import YOLO
from ultralytics.utils.plotting import Annotator

model = YOLO("yolo26n.pt")  # Load pretrain or fine-tune model

# Process the image
source = cv2.imread("path/to/image.jpg")
results = model(source)

# Extract results
annotator = Annotator(source, example=model.names)

for box in results[0].boxes.xyxy.cpu():
    width, height, area = annotator.get_bbox_dimension(box)
    print(f"Bounding Box Width {width.item()}, Height {height.item()}, Area {area.item()}")
Link to this section将边界框转换为分段#
利用现有的 x y w h 边界框数据,使用 yolo_bbox2segment 函数将其转换为分段。请按如下方式组织图像和标注文件:
data
|__ images
    ├─ 001.jpg
    ├─ 002.jpg
    ├─ ..
    └─ NNN.jpg
|__ labels
    ├─ 001.txt
    ├─ 002.txt
    ├─ ..
    └─ NNN.txt
from ultralytics.data.converter import yolo_bbox2segment
yolo_bbox2segment(
im_dir="path/to/images",
save_dir=None, # saved to "labels-segment" in images directory
sam_model="sam_b.pt",
)访问 yolo_bbox2segment 参考页面 以获取关于该函数的更多信息。
Link to this section将分段转换为边界框#
如果你拥有一个使用 分割数据集格式 的数据集,可以使用此函数轻松地将其转换为正向(或水平)边界框(x y w h 格式)。
import numpy as np

from ultralytics.utils.ops import segments2boxes

segments = np.array(
    [
        [805, 392, 797, 400, 812, 402, 808, 714, 808, 392],
        [115, 398, 113, 400, 150, 410, 150, 400, 149, 298],
        [267, 412, 265, 413, 300, 420, 300, 413, 299, 412],
    ],
    dtype=np.float32,
)

segments2boxes([s.reshape(-1, 2) for s in segments])
# >>> array([[804.5, 553. ,  15. , 322. ],
#           [131.5, 354. ,  37. , 112. ],
#           [282.5, 416. ,  35. ,   8. ]],
#           dtype=float32) # xywh bounding boxes
要了解此函数的工作原理,请访问 参考页面。
Link to this section工具#
Link to this section图像压缩#
压缩单个图像文件至较小尺寸,同时保留其长宽比和质量。如果输入图像小于最大尺寸,则不会被调整大小。
from pathlib import Path

from ultralytics.data.utils import compress_one_image

for f in Path("path/to/dataset").rglob("*.jpg"):
    compress_one_image(f)
Link to this section自动拆分数据集#
自动将数据集拆分为 train/val/test,并将结果保存到 autosplit_*.txt 文件中。此函数使用随机采样,当你使用 fraction 参数进行训练 时,该参数会被排除。
from ultralytics.data.split import autosplit

autosplit(
    path="path/to/images",
    weights=(0.9, 0.1, 0.0),  # (train, validation, test) fractional splits
    annotated_only=False,  # split only images with annotation file when True
)
参阅 参考页面 以获取关于此函数的更多详情。
Link to this section将分段多边形转换为二进制掩码#
将单个多边形(作为列表)转换为指定图像大小的二进制掩码。多边形应为一个扁平的 1D 数组,其中包含 N 个交替的 x, y 值,定义多边形的轮廓。
N 必须始终 为偶数。
import numpy as np

from ultralytics.data.utils import polygon2mask

imgsz = (1080, 810)
polygon = np.array([805, 392, 797, 400, ..., 808, 714, 808, 392])  # (238, 2)

mask = polygon2mask(
    imgsz,  # tuple
    [polygon],  # input as list
    color=255,  # 8-bit binary
    downsample_ratio=1,
)
Link to this section边界框#
Link to this section边界框(水平)实例#
为了管理边界框数据,Bboxes 类可以帮助你在不同坐标格式间转换、缩放边界框尺寸、计算面积、包含偏移量等。
import numpy as np

from ultralytics.utils.instance import Bboxes

boxes = Bboxes(
    bboxes=np.array(
        [
            [22.878, 231.27, 804.98, 756.83],
            [48.552, 398.56, 245.35, 902.71],
            [669.47, 392.19, 809.72, 877.04],
            [221.52, 405.8, 344.98, 857.54],
            [0, 550.53, 63.01, 873.44],
            [0.0584, 254.46, 32.561, 324.87],
        ]
    ),
    format="xyxy",
)

boxes.areas()
# >>> array([ 4.1104e+05,       99216,       68000,       55772,       20347,      2288.5])

boxes.convert("xywh")
print(boxes.bboxes)
# >>> array(
#     [[ 413.93, 494.05,  782.1, 525.56],
#      [ 146.95, 650.63,  196.8, 504.15],
#      [  739.6, 634.62, 140.25, 484.85],
#      [ 283.25, 631.67, 123.46, 451.74],
#      [ 31.505, 711.99,  63.01, 322.91],
#      [  16.31, 289.67, 32.503,  70.41]]
# )
参阅 Bboxes 参考部分 以了解更多属性和方法。
以下许多函数(及更多)都可以通过 Bboxes 类 访问,但如果你更喜欢直接操作函数,请参阅后续小节了解如何独立导入它们。
Link to this section缩放边界框#
当放大或缩小图像时,你可以使用 ultralytics.utils.ops.scale_boxes 相应地缩放匹配的边界框坐标。
import cv2 as cv
import numpy as np

from ultralytics.utils.ops import scale_boxes

image = cv.imread("ultralytics/assets/bus.jpg")
h, w, c = image.shape
resized = cv.resize(image, None, (), fx=1.2, fy=1.2)
new_h, new_w, _ = resized.shape

xyxy_boxes = np.array(
    [
        [22.878, 231.27, 804.98, 756.83],
        [48.552, 398.56, 245.35, 902.71],
        [669.47, 392.19, 809.72, 877.04],
        [221.52, 405.8, 344.98, 857.54],
        [0, 550.53, 63.01, 873.44],
        [0.0584, 254.46, 32.561, 324.87],
    ]
)

new_boxes = scale_boxes(
    img1_shape=(h, w),  # original image dimensions
    boxes=xyxy_boxes,  # boxes from original image
    img0_shape=(new_h, new_w),  # resized image dimensions (scale to)
    ratio_pad=None,
    padding=False,
    xywh=False,
)

print(new_boxes)
# >>> array(
#     [[  27.454,  277.52,  965.98,   908.2],
#     [   58.262,  478.27,  294.42,  1083.3],
#     [   803.36,  470.63,  971.66,  1052.4],
#     [   265.82,  486.96,  413.98,    1029],
#     [        0,  660.64,  75.612,  1048.1],
#     [   0.0701,  305.35,  39.073,  389.84]]
# )
Link to this section边界框格式转换#
Link to this sectionXYXY → XYWH#
将边界框坐标从 (x1, y1, x2, y2) 格式转换为 (x, y, width, height) 格式,其中 (x1, y1) 是左上角,(x2, y2) 是右下角。
import numpy as np

from ultralytics.utils.ops import xyxy2xywh

xyxy_boxes = np.array(
    [
        [22.878, 231.27, 804.98, 756.83],
        [48.552, 398.56, 245.35, 902.71],
        [669.47, 392.19, 809.72, 877.04],
        [221.52, 405.8, 344.98, 857.54],
        [0, 550.53, 63.01, 873.44],
        [0.0584, 254.46, 32.561, 324.87],
    ]
)
xywh = xyxy2xywh(xyxy_boxes)

print(xywh)
# >>> array(
#     [[ 413.93,  494.05,   782.1, 525.56],
#     [  146.95,  650.63,   196.8, 504.15],
#     [   739.6,  634.62,  140.25, 484.85],
#     [  283.25,  631.67,  123.46, 451.74],
#     [  31.505,  711.99,   63.01, 322.91],
#     [   16.31,  289.67,  32.503,  70.41]]
# )
Link to this section所有边界框转换#
from ultralytics.utils.ops import (
    ltwh2xywh,
    ltwh2xyxy,
    xywh2ltwh,  # xywh → top-left corner, w, h
    xywh2xyxy,
    xywhn2xyxy,  # normalized → pixel
    xyxy2ltwh,  # xyxy → top-left corner, w, h
    xyxy2xywhn,  # pixel → normalized
)

for func in (ltwh2xywh, ltwh2xyxy, xywh2ltwh, xywh2xyxy, xywhn2xyxy, xyxy2ltwh, xyxy2xywhn):
    print(help(func))  # print function docstrings
查看每个函数的文档字符串或访问 ultralytics.utils.ops 参考页面 以阅读更多信息。
Link to this section绘图#
Link to this section标注工具#
Ultralytics 包含一个用于标注各种数据类型的 Annotator 类。它最适合与 目标检测边界框、姿态关键点 以及 定向边界框 配合使用。
Link to this section框标注#
import cv2 as cv
import numpy as np

from ultralytics.utils.plotting import Annotator, colors

names = {
    0: "person",
    5: "bus",
    11: "stop sign",
}

image = cv.imread("ultralytics/assets/bus.jpg")
ann = Annotator(
    image,
    line_width=None,  # default auto-size
    font_size=None,  # default auto-size
    font="Arial.ttf",  # must be ImageFont compatible
    pil=False,  # use PIL, otherwise uses OpenCV
)

xyxy_boxes = np.array(
    [
        [5, 22.878, 231.27, 804.98, 756.83],  # class-idx x1 y1 x2 y2
        [0, 48.552, 398.56, 245.35, 902.71],
        [0, 669.47, 392.19, 809.72, 877.04],
        [0, 221.52, 405.8, 344.98, 857.54],
        [0, 0, 550.53, 63.01, 873.44],
        [11, 0.0584, 254.46, 32.561, 324.87],
    ]
)

for nb, box in enumerate(xyxy_boxes):
    c_idx, *box = box
    label = f"{str(nb).zfill(2)}:{names.get(int(c_idx))}"
    ann.box_label(box, label, color=colors(c_idx, bgr=True))

image_with_bboxes = ann.result()
Names can be used from model.names when working with detection results.
Also see the Annotator Reference Page for additional insight.
Link to this sectionUltralytics 扫描标注#
import cv2
import numpy as np

from ultralytics import YOLO
from ultralytics.solutions.solutions import SolutionAnnotator
from ultralytics.utils.plotting import colors

# User defined video path and model file
cap = cv2.VideoCapture("path/to/video.mp4")
model = YOLO(model="yolo26s-seg.pt")  # Model file, e.g., yolo26s.pt or yolo26m-seg.pt

if not cap.isOpened():
    print("Error: Could not open video.")
    exit()

# Initialize the video writer object.
w, h, fps = (int(cap.get(x)) for x in (cv2.CAP_PROP_FRAME_WIDTH, cv2.CAP_PROP_FRAME_HEIGHT, cv2.CAP_PROP_FPS))
video_writer = cv2.VideoWriter("ultralytics.avi", cv2.VideoWriter_fourcc(*"mp4v"), fps, (w, h))

masks = None  # Initialize variable to store masks data
f = 0  # Initialize frame count variable for enabling mouse event.
line_x = w  # Store width of line.
dragging = False  # Initialize bool variable for line dragging.
classes = model.names  # Store model classes names for plotting.
window_name = "Ultralytics Sweep Annotator"

def drag_line(event, x, _, flags, param):
    """Mouse callback function to enable dragging a vertical sweep line across the video frame."""
    global line_x, dragging
    if event == cv2.EVENT_LBUTTONDOWN or (flags & cv2.EVENT_FLAG_LBUTTON):
        line_x = max(0, min(x, w))
        dragging = True

while cap.isOpened():  # Loop over the video capture object.
    ret, im0 = cap.read()
    if not ret:
        break
    f = f + 1  # Increment frame count.
    count = 0  # Re-initialize count variable on every frame for precise counts.
    results = model.track(im0, persist=True)[0]

    if f == 1:
        cv2.namedWindow(window_name)
        cv2.setMouseCallback(window_name, drag_line)

    annotator = SolutionAnnotator(im0)

    if results.boxes.is_track:
        if results.masks is not None:
            masks = [np.array(m, dtype=np.int32) for m in results.masks.xy]

        boxes = results.boxes.xyxy.tolist()
        track_ids = results.boxes.id.int().cpu().tolist()
        clss = results.boxes.cls.cpu().tolist()

        for mask, box, cls, t_id in zip(masks or [None] * len(boxes), boxes, clss, track_ids):
            color = colors(t_id, True)  # Assign different color to each tracked object.
            label = f"{classes[cls]}:{t_id}"
            if mask is not None and mask.size > 0:
                if box[0] > line_x:
                    count += 1
                    cv2.polylines(im0, [mask], True, color, 2)
                    x, y = mask.min(axis=0)
                    (w_m, _), _ = cv2.getTextSize(label, cv2.FONT_HERSHEY_SIMPLEX, 0.5, 1)
                    cv2.rectangle(im0, (x, y - 20), (x + w_m, y), color, -1)
                    cv2.putText(im0, label, (x, y - 5), cv2.FONT_HERSHEY_SIMPLEX, 0.5, (255, 255, 255), 1)
            else:
                if box[0] > line_x:
                    count += 1
                    annotator.box_label(box=box, color=color, label=label)

    # Generate draggable sweep line
    annotator.sweep_annotator(line_x=line_x, line_y=h, label=f"COUNT:{count}")

    cv2.imshow(window_name, im0)
    video_writer.write(im0)
    if cv2.waitKey(1) & 0xFF == ord("q"):
        break

# Release the resources
cap.release()
video_writer.release()
cv2.destroyAllWindows()
关于 sweep_annotator 方法的更多详细信息,请查看我们的参考部分此处。
Link to this section自适应标签标注#
从 Ultralytics v8.3.167 开始,circle_label 和 text_label 已被统一的 adaptive_label 函数取代。你现在可以使用 shape 参数指定标注类型:
- 矩形:
annotator.adaptive_label(box, label=names[int(cls)], color=colors(cls, True), shape="rect") - 圆形:
annotator.adaptive_label(box, label=names[int(cls)], color=colors(cls, True), shape="circle")
Watch: In-Depth Guide to Text & Circle Annotations with Python Live Demos | Ultralytics Annotations 🚀
import cv2

from ultralytics import YOLO
from ultralytics.solutions.solutions import SolutionAnnotator
from ultralytics.utils.plotting import colors

model = YOLO("yolo26s.pt")
names = model.names
cap = cv2.VideoCapture("path/to/video.mp4")

w, h, fps = (int(cap.get(x)) for x in (cv2.CAP_PROP_FRAME_WIDTH, cv2.CAP_PROP_FRAME_HEIGHT, cv2.CAP_PROP_FPS))
writer = cv2.VideoWriter("Ultralytics circle annotation.avi", cv2.VideoWriter_fourcc(*"MJPG"), fps, (w, h))

while True:
    ret, im0 = cap.read()
    if not ret:
        break

    annotator = SolutionAnnotator(im0)
    results = model.predict(im0)[0]
    boxes = results.boxes.xyxy.cpu()
    clss = results.boxes.cls.cpu().tolist()

    for box, cls in zip(boxes, clss):
        annotator.adaptive_label(box, label=names[int(cls)], color=colors(cls, True), shape="circle")
    writer.write(im0)
    cv2.imshow("Ultralytics circle annotation", im0)

    if cv2.waitKey(1) & 0xFF == ord("q"):
        break

writer.release()
cap.release()
cv2.destroyAllWindows()
参阅 SolutionAnnotator 参考页面 以获取更多见解。
Link to this section其他#
Link to this section代码性能分析#
使用 with 语句或装饰器来检查代码运行/处理的耗时。
from ultralytics.utils.ops import Profile

with Profile(device="cuda:0") as dt:
    pass  # operation to measure

print(dt)
# >>> "Elapsed time is 9.5367431640625e-07 s"
Link to this sectionUltralytics 支持的格式#
需要在代码中程序化使用 Ultralytics 支持的 图像或视频格式 吗?如有需要,请使用这些常量:
from ultralytics.data.utils import IMG_FORMATS, VID_FORMATS

print(IMG_FORMATS)
# {'avif', 'bmp', 'dng', 'heic', 'heif', 'jp2', 'jpeg', 'jpg', 'mpo', 'png', 'tif', 'tiff', 'webp'}

print(VID_FORMATS)
# {'asf', 'avi', 'gif', 'm4v', 'mkv', 'mov', 'mp4', 'mpeg', 'mpg', 'ts', 'wmv', 'webm'}
Link to this section整除计算#
计算大于或等于 x 且能被 y 整除的最小整数。
from ultralytics.utils.ops import make_divisible

make_divisible(7, 3)
# >>> 9
make_divisible(7, 2)
# >>> 8
Link to this section常见问题解答#
Link to this sectionUltralytics 软件包中包含了哪些用于增强机器学习工作流程的实用工具?#
The Ultralytics package includes utilities designed to streamline and optimize machine learning workflows. Key utilities include auto-annotation for labeling datasets, converting COCO to YOLO format with convert_coco, compressing images, and dataset auto-splitting. These tools reduce manual effort, ensure consistency, and enhance data processing efficiency.
Link to this section我该如何使用 Ultralytics 自动标注我的数据集?#
如果你有一个预训练好的 Ultralytics YOLO 目标检测模型,你可以将其与 SAM 模型结合使用,以分割格式自动标注你的数据集。以下是一个示例:
from ultralytics.data.annotator import auto_annotate

auto_annotate(
    data="path/to/new/data",
    det_model="yolo26n.pt",
    sam_model="mobile_sam.pt",
    device="cuda",
    output_dir="path/to/save_labels",
)
更多详情,请查看 auto_annotate 参考部分,或者使用 Ultralytics Platform 作为托管的无代码替代方案,通过 SAM 2.1 或 SAM 3 进行基于点击的掩码标注,或者获取预训练和微调后的 YOLO 模型在检测、分割和 OBB 任务中的预测结果。
Link to this section我该如何在 Ultralytics 中将 COCO 数据集标注转换为 YOLO 格式?#
要将 COCO JSON 标注转换为 YOLO 格式以进行目标检测,可以使用 convert_coco 工具。这是一个示例代码片段:
from ultralytics.data.converter import convert_coco

convert_coco(
    "coco/annotations/",
    use_segments=False,
    use_keypoints=False,
    cls91to80=True,
)
获取更多信息,请访问 convert_coco 参考页面。
Link to this section我该如何分析数据集的组成和分布?#
Ultralytics Platform 提供自动数据集分析功能:Charts 选项卡显示拆分分布、顶级类别计数、图像尺寸直方图以及标注位置的 2D 热图,帮助你在训练前发现不平衡和异常值。
Link to this section我该如何在 Ultralytics 中将边界框转换为分段?#
要将现有的边界框数据(x y w h 格式)转换为分段,可以使用 yolo_bbox2segment 函数。请确保你的文件已按图像和标签的独立目录组织好。
from ultralytics.data.converter import yolo_bbox2segment

yolo_bbox2segment(
    im_dir="path/to/images",
    save_dir=None,  # saved to "labels-segment" in the images directory
    sam_model="sam_b.pt",
)
更多信息,请访问 yolo_bbox2segment 参考页面。