Link to this sectionUltralytics YOLO26による分析#
Ultralytics YOLO26 を使用した分析により、object detection およびトラッキングの結果をリアルタイムのチャートに変換できるため、ビデオフレームごとにオブジェクト数がどのように変化するかを監視できます。このガイドでは、4つのdata visualizationタイプ(折れ線グラフ、棒グラフ、円グラフ、面グラフ)を解説し、PythonおよびCLIの共通の例を用いてこれらを切り替える方法を示します。
Watch: How to generate Analytical Graphs using Ultralytics | Line Graphs, Bar Plots, Area and Pie Charts
Link to this section可視化のサンプル#
| 折れ線グラフ | 棒グラフ | 円グラフ |
|---|---|---|
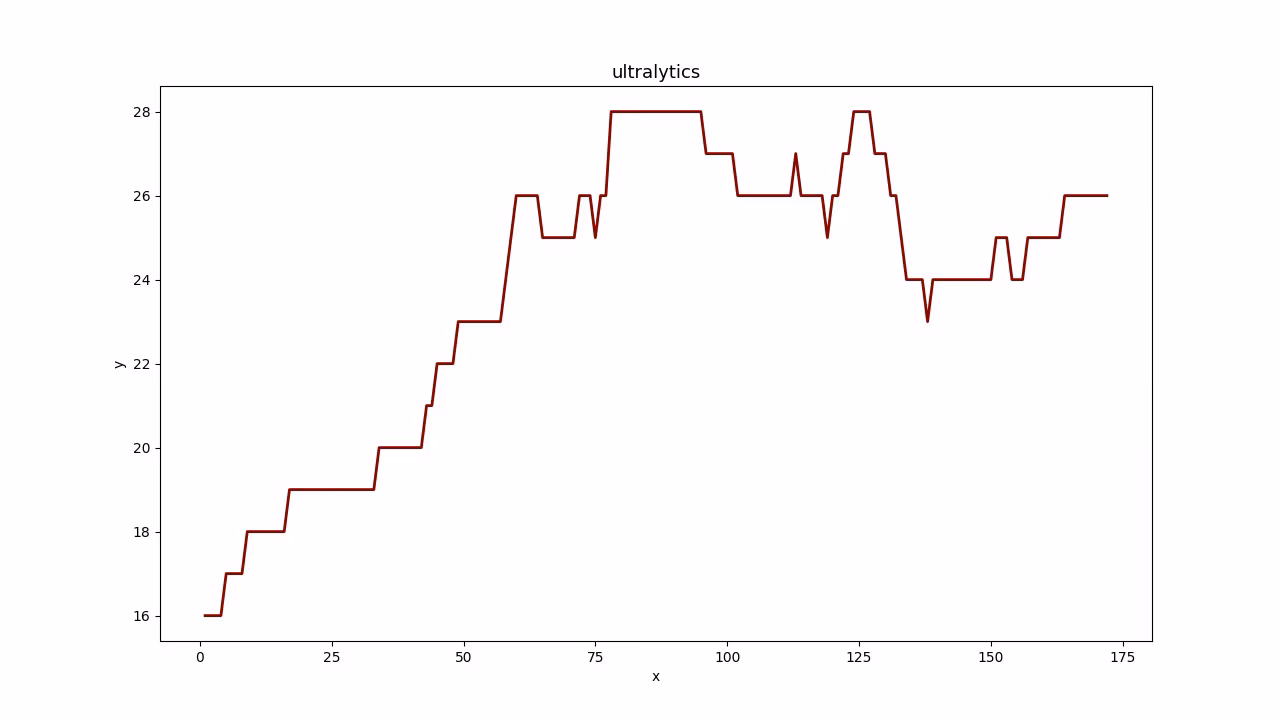 | 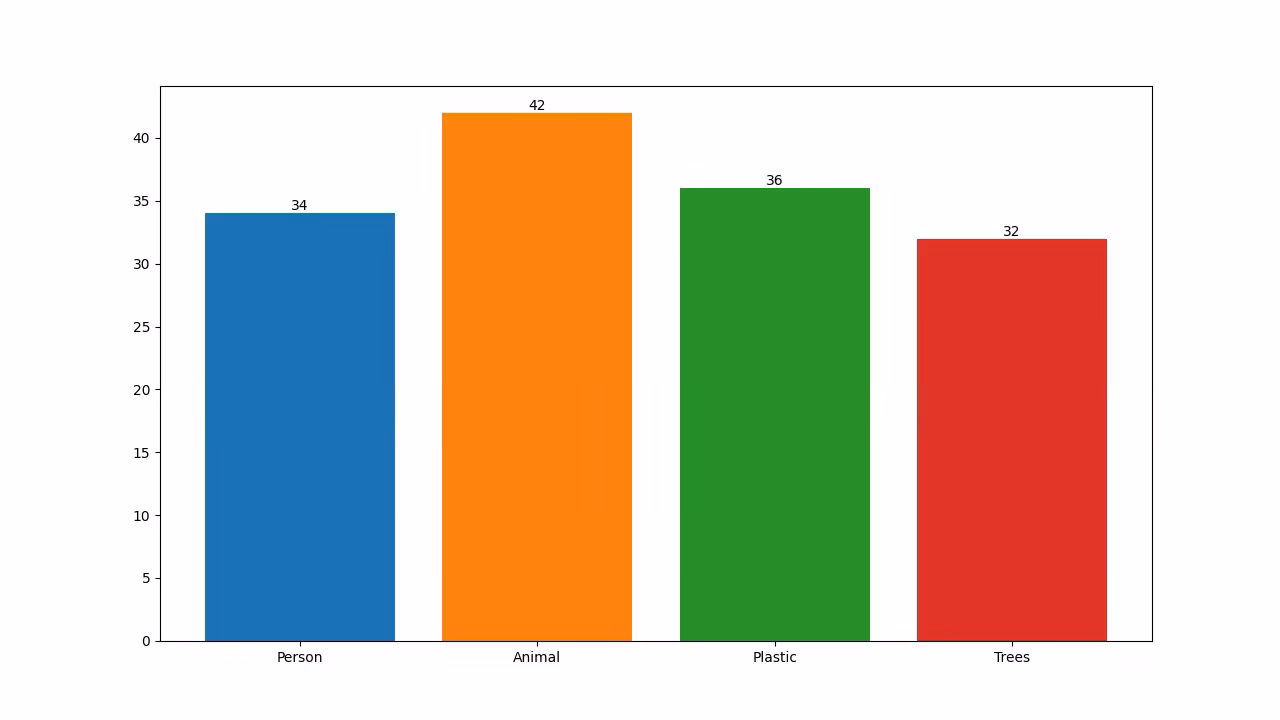 | 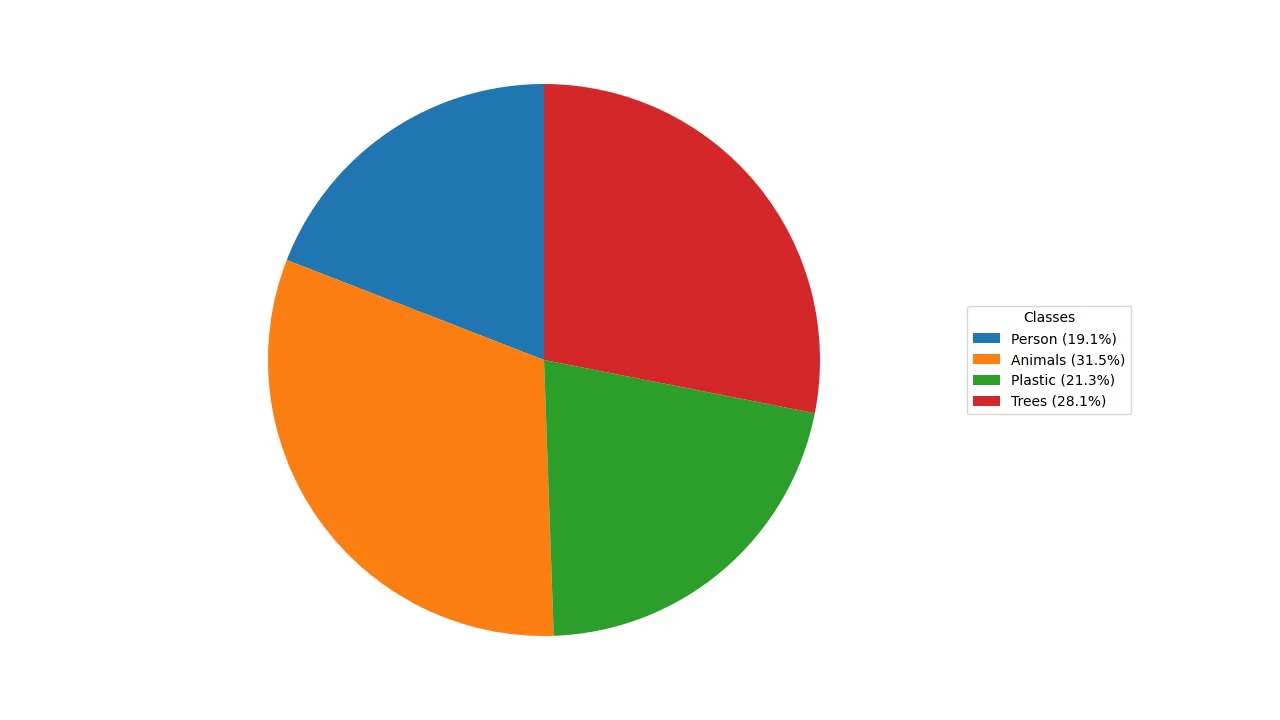 |
Link to this section検出データを可視化する理由とは?#
- 折れ線グラフは、短期間および長期間にわたる変化の追跡や、同じ期間における複数のグループ間の変化の比較に最適です。
- 棒グラフは、異なるカテゴリ間での数量の比較や、カテゴリとその数値の関係を示すのに適しています。
- 円グラフは、カテゴリ間の比率を説明したり、全体に対する割合を示すのに効果的です。
- 面グラフは折れ線グラフの下部を塗りつぶすため、クラスごとのオブジェクト数の推移を一目で把握しやすくなります。
Link to this section分析グラフの生成#
ビデオを Analytics ソリューションに渡し、analytics_type でチャートを選択します。このソリューションはすべてのフレームで検出とトラッキングを実行し、(デフォルトで)1280×720のチャートを描画して出力ビデオに直接書き込むことができます。"line"、"bar"、"pie"、"area" の切り替えは、引数を1つ指定するだけです。
yolo solutions analytics show=True

# Pass the source
yolo solutions analytics source="path/to/video.mp4"

# Generate the pie chart
yolo solutions analytics analytics_type="pie" show=True

# Generate the bar plots
yolo solutions analytics analytics_type="bar" show=True

# Generate the area plots
yolo solutions analytics analytics_type="area" show=True
Link to this sectionAnalyticsの引数#
以下は、Analyticsの引数をまとめた表です。
| 引数 | タイプ | デフォルト | 説明 |
|---|---|---|---|
model | str | None | Ultralytics YOLOモデルファイルへのパス。 |
analytics_type | str | 'line' | グラフのタイプ(line、bar、area、または pieなど)。 |
You can also leverage different track arguments in the Analytics solution.
| 引数 | タイプ | デフォルト | 説明 |
|---|---|---|---|
tracker | str | 'tracktrack.yaml' | 使用するトラッキングアルゴリズムを指定します。組み込みのオプションは、botsort.yaml、bytetrack.yaml、ocsort.yaml、deepocsort.yaml、fasttrack.yaml、tracktrack.yamlです。 |
conf | float | 0.1 | 検出の信頼度しきい値を設定します。低い値を設定するとより多くの物体を追跡できますが、誤検知が含まれる可能性があります。 |
iou | float | 0.7 | 重なり合う検出をフィルタリングするためのIntersection over Union(IoU)しきい値を設定します。 |
classes | list | None | クラスインデックスで結果をフィルタリングします。例えば、classes=[0, 2, 3]と設定すると、指定されたクラスのみを追跡します。 |
verbose | bool | True | 追跡結果の表示を制御し、追跡された物体の視覚的な出力を行います。 |
device | str | None | 推論に使用するデバイスを指定します(例:cpu、cuda:0、または 0)。CPU、特定のGPU、その他の演算デバイスをモデル実行用に選択できます。 |
さらに、以下の可視化引数がサポートされています。
| 引数 | タイプ | デフォルト | 説明 |
|---|---|---|---|
show | bool | False | Trueの場合、注釈付きの画像や動画をウィンドウに表示します。開発やテスト中の即時的な視覚フィードバックに役立ちます。 |
line_width | int or None | None | バウンディングボックスの線の太さを指定します。Noneの場合、線の太さは画像サイズに基づいて自動的に調整されます。明瞭さのための視覚的なカスタマイズが可能です。 |
Link to this section結論#
いつ、どのように異なる種類の可視化手法を使用すべきかを理解することは、効果的なデータ分析において重要です。折れ線グラフ、棒グラフ、円グラフは、データのストーリーをより明確かつ効果的に伝えるための基本的なツールです。Ultralytics YOLO26のAnalyticsソリューションは、物体検出や追跡結果からこれらの可視化を生成するための合理的な方法を提供し、視覚的なデータから意味のある洞察を抽出しやすくします。
Link to this sectionよくある質問 (FAQ)#
Link to this sectionUltralytics YOLO26 Analyticsを使用して折れ線グラフを作成するにはどうすればよいですか?#
Ultralytics YOLO26 Analyticsを使用して折れ線グラフを作成するには、以下の手順に従ってください。
- YOLO26モデルを読み込み、ビデオファイルを開きます。
- Initialize the
Analyticsclass withanalytics_type="line". - ビデオフレームをループ処理し、フレームごとにソリューションを呼び出して、オブジェクト数などのデータで折れ線グラフを更新します。
results.plot_imを出力ビデオに書き込んで、チャートを保存します。
開始点として上記のPythonの例を使用してください。これには既に完全なフレームループが含まれており、analytics_type のデフォルトは折れ線グラフになっています。
Link to this sectionUltralytics YOLO26を使用して棒グラフを作成する利点は何ですか?#
Ultralytics YOLO26を使用して棒グラフを作成することには、いくつかの利点があります。
- リアルタイムのデータ可視化: 物体検出結果をシームレスに棒グラフに統合し、動的に更新できます。
- 使いやすさ: シンプルなAPIと関数により、実装やデータ可視化が容易です。
- カスタマイズ性: タイトル、ラベル、色などを個別の要件に合わせてカスタマイズ可能です。
- 効率性: 大量のデータを効率的に処理し、ビデオ処理中にリアルタイムでグラフを更新できます。
To generate a bar plot, set analytics_type="bar" in the Python example above — the rest of the frame loop is identical. See the Visual Samples section for a preview.
Link to this sectionデータ可視化プロジェクトで円グラフを作成するためにUltralytics YOLO26を使用すべき理由は何ですか?#
Ultralytics YOLO26が円グラフ作成に適している理由は以下の通りです。
- 物体検出との統合: 物体検出結果を直接円グラフに統合し、即座に洞察を得ることができます。
- ユーザーフレンドリーなAPI: 最小限のコードで設定および使用が可能です。
- カスタマイズ可能: 色やラベルなど、多様なカスタマイズオプションがあります。
- リアルタイム更新: ビデオ分析プロジェクトに最適な、リアルタイムでのデータ処理と可視化が可能です。
To generate a pie chart, set analytics_type="pie" in the Python example above. For more information, refer to the Visual Samples section in the guide.
Link to this sectionUltralytics YOLO26を使用して物体を追跡し、可視化を動的に更新することはできますか?#
はい、トラッキング機能は Analytics ソリューションに組み込まれています。リアルタイムで複数のオブジェクトを追跡し、フレームごとにトラッキングデータからチャートを更新するため、折れ線グラフ、棒グラフ、円グラフ、面グラフのすべてにライブカウントが反映されます。これは上記のPythonの例内のフレームループがまさに実行していることです。基盤となるトラッキング機能については、Trackingセクションを参照してください。
Link to this sectionUltralytics YOLO26は、OpenCVやTensorFlowのような他の物体検出ソリューションと何が違いますか?#
Ultralytics YOLO26がOpenCVやTensorFlowのような他の物体検出ソリューションと一線を画す理由は、以下の通り複数あります。
- 最先端の精度: YOLO26は、物体検出、インスタンスセグメンテーション、セマンティックセグメンテーション、および分類タスクにおいて優れた精度を提供します。
- 使いやすさ: ユーザーフレンドリーなAPIにより、大規模なコーディングを必要とせず、迅速な実装と統合が可能です。
- リアルタイム性能: 高速推論に最適化されており、リアルタイムアプリケーションに適しています。
- 多様な用途: 多目的追跡、カスタムモデルトレーニング、ONNX、TensorRT、CoreMLなどの様々なフォーマットへのエクスポートを含む様々なタスクをサポートしています。
- 包括的なドキュメント: ユーザーがすべてのステップを進めるための詳細なドキュメントおよびブログリソース。
より詳細な比較やユースケースについては、Ultralyticsブログをご覧ください。