Phân tích bằng Ultralytics YOLO26
Analytics với Ultralytics YOLO26 chuyển kết quả phát hiện đối tượng và tracking thành biểu đồ theo thời gian thực, giúp bạn theo dõi số lượng đối tượng thay đổi qua từng frame video. Hướng dẫn này trình bày bốn loại trực quan hóa dữ liệu — biểu đồ đường, biểu đồ cột, biểu đồ tròn và biểu đồ miền — đồng thời hướng dẫn cách chuyển đổi giữa các loại bằng những ví dụ dùng chung cho Python và CLI.
Xem: Cách tạo biểu đồ phân tích bằng Ultralytics | Biểu đồ đường, biểu đồ cột, biểu đồ vùng và biểu đồ tròn
Ví dụ trực quan#
| Biểu đồ đường | Biểu đồ cột | Biểu đồ tròn |
|---|---|---|
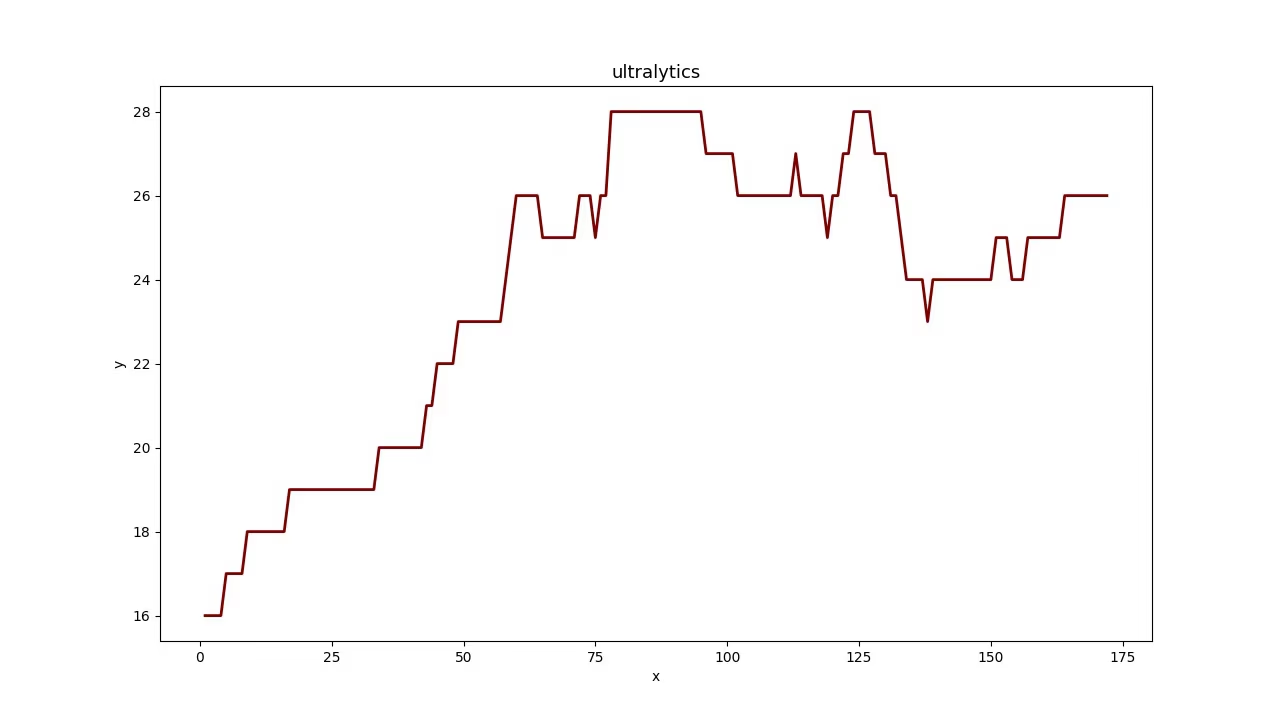 | 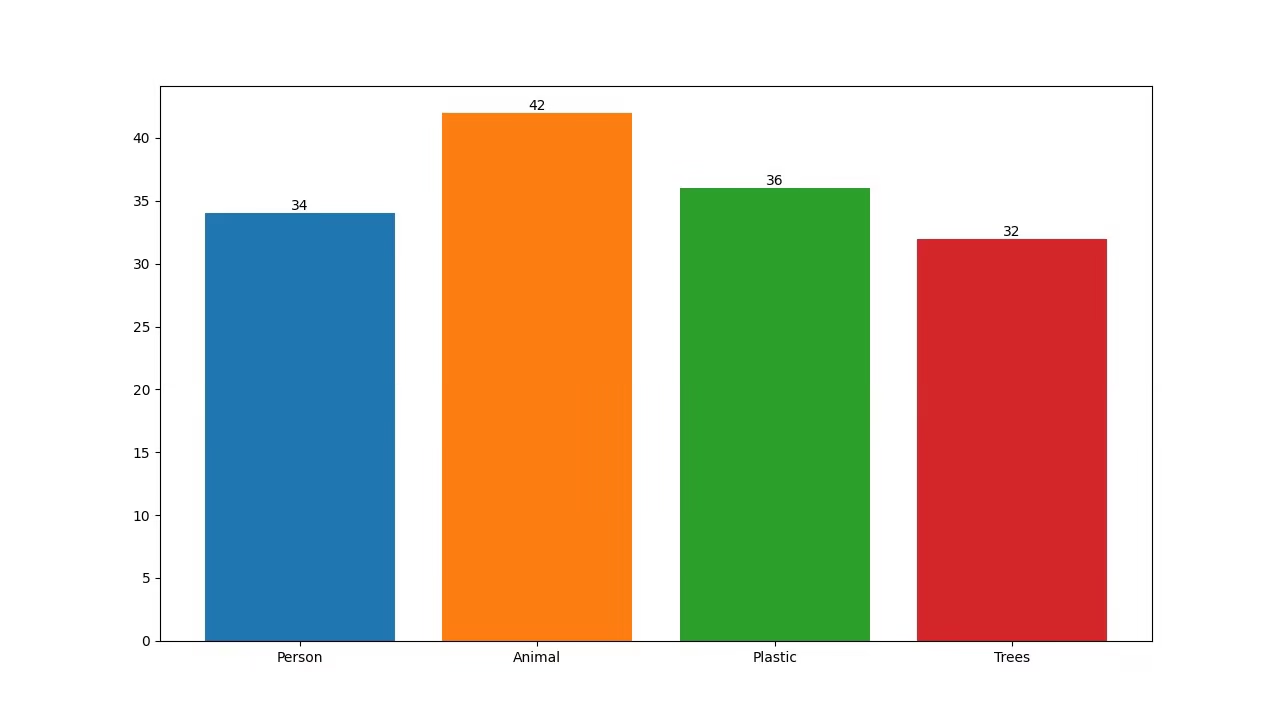 | 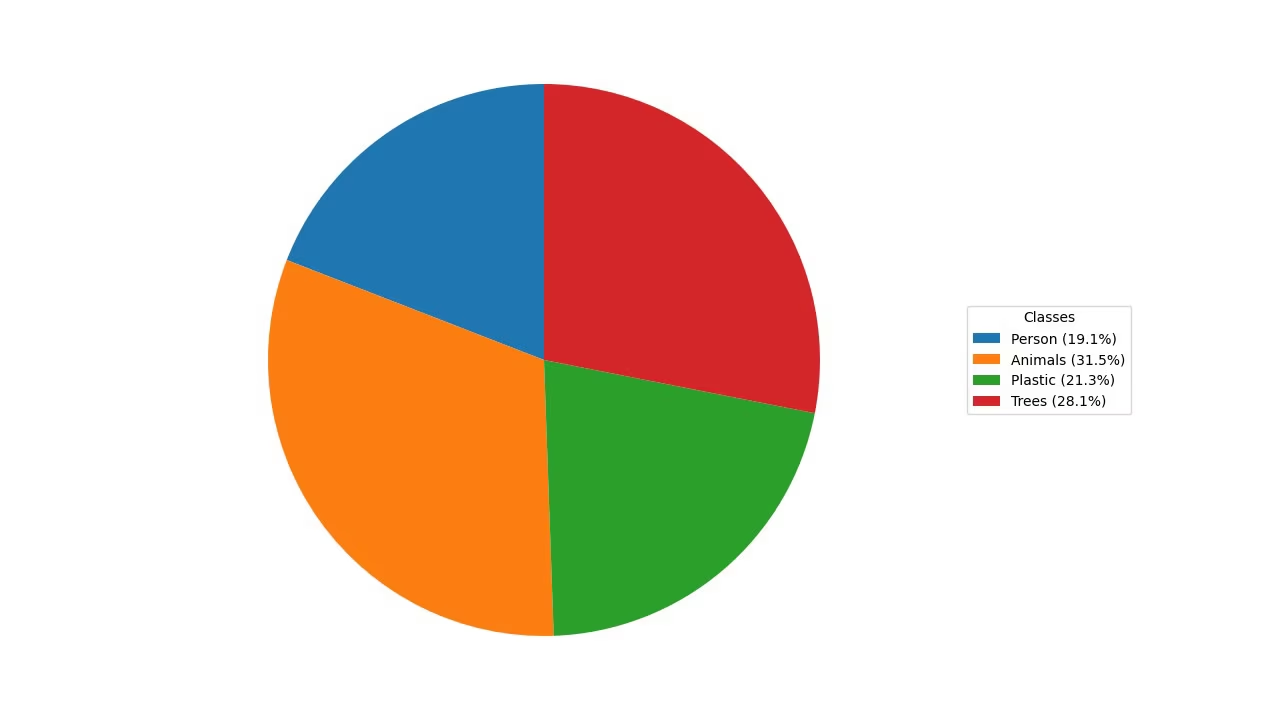 |
Tại sao cần trực quan hóa dữ liệu phát hiện?#
- Biểu đồ đường rất phù hợp để theo dõi các thay đổi trong khoảng thời gian ngắn và dài, cũng như so sánh thay đổi của nhiều nhóm trong cùng một khoảng thời gian.
- Biểu đồ cột phù hợp để so sánh số lượng giữa các danh mục khác nhau và thể hiện mối quan hệ giữa một danh mục với giá trị số tương ứng.
- Biểu đồ tròn giúp minh họa hiệu quả tỷ trọng giữa các danh mục và thể hiện các phần cấu thành một tổng thể.
- Biểu đồ miền tô màu vùng bên dưới đường biểu đồ, giúp dễ dàng đọc lướt số lượng đối tượng theo từng class qua thời gian.
Tạo biểu đồ phân tích#
Truyền video của bạn vào solution Analytics và chọn biểu đồ bằng analytics_type. Solution chạy phát hiện và tracking trên từng frame, sau đó vẽ biểu đồ kích thước 1280×720 (theo mặc định) để bạn có thể ghi trực tiếp vào video đầu ra. Chuyển đổi giữa "line", "bar", "pie" và "area" chỉ với một đối số.
yolo solutions analytics show=True

# Pass the source
yolo solutions analytics source="path/to/video.mp4"

# Generate the pie chart
yolo solutions analytics analytics_type="pie" show=True

# Generate the bar plots
yolo solutions analytics analytics_type="bar" show=True

# Generate the area plots
yolo solutions analytics analytics_type="area" show=True
Các đối số của Analytics#
Dưới đây là bảng liệt kê các đối số của Analytics:
| Đối số | Kiểu | Mặc định | Mô tả |
|---|---|---|---|
model | str | None | Đường dẫn đến tệp model Ultralytics YOLO. |
analytics_type | str | 'line' | Loại biểu đồ, tức là line, bar, area hoặc pie. |
figsize | tuple[float, float] | (12.8, 7.2) | Kích thước hình tính bằng inch cho biểu đồ Analytics; (12.8, 7.2) hiển thị khung hình 1280×720. |
line_width | int | 2 | Độ dày đường viền của box, keypoint và số đếm mà giải pháp vẽ. |
verbose | bool | True | Bật nhật ký theo từng frame của giải pháp, gồm shape đầu vào, số lượng class và tốc độ xử lý. Bản thân lệnh gọi tracking luôn không ghi nhật ký. |
Bạn cũng có thể sử dụng các đối số track trong giải pháp Analytics.
| Đối số | Kiểu | Mặc định | Mô tả |
|---|---|---|---|
tracker | str | 'tracktrack.yaml' | Chỉ định thuật toán theo dõi cần sử dụng. Các tùy chọn tích hợp sẵn: botsort.yaml, bytetrack.yaml, ocsort.yaml, deepocsort.yaml, fasttrack.yaml, tracktrack.yaml. |
conf | float | 0.25 | Đặt ngưỡng confidence cho các đối tượng được phát hiện; giá trị thấp hơn cho phép theo dõi nhiều đối tượng hơn nhưng có thể bao gồm cả kết quả dương tính giả. |
iou | float | 0.5 | Đặt ngưỡng Intersection over Union (IoU) để lọc các đối tượng phát hiện bị chồng lấn. |
classes | list | None | Lọc kết quả theo chỉ mục class. Ví dụ: classes=[0, 2, 3] chỉ theo dõi các class được chỉ định. |
device | str | None | Chỉ định thiết bị dùng để suy luận (ví dụ: cpu, cuda:0 hoặc 0). Cho phép người dùng chọn CPU, một GPU cụ thể hoặc thiết bị tính toán khác để chạy model. |
imgsz | int or tuple | 640 | Kích thước ảnh suy luận mục tiêu: số nguyên cho ảnh vuông hoặc cặp (height, width). Kích thước sẽ được điều chỉnh theo stride của model. |
max_det | int | 300 | Số lượng đối tượng phát hiện tối đa được giữ lại trong mỗi khung hình trước khi theo dõi, giới hạn số đối tượng mà một giải pháp xử lý trong các cảnh dày đặc. |
quantize | int or str | None | Độ chính xác suy luận: 16 (FP16) hoặc 32/unset (FP32) cho model PyTorch và TorchScript khi chạy ngoài CPU; các định dạng khác sử dụng độ chính xác do artifact và runtime của chúng lựa chọn. Thay thế đối số half đã lỗi thời. |
Ngoài ra, các đối số trực quan hóa sau đây cũng được hỗ trợ:
| Đối số | Kiểu | Mặc định | Mô tả |
|---|---|---|---|
show | bool | False | Nếu True, hiển thị ảnh hoặc video đã được chú thích trong một cửa sổ. Hữu ích để nhận phản hồi trực quan ngay lập tức trong quá trình phát triển hoặc kiểm thử. |
Kết luận#
Hiểu thời điểm và cách sử dụng các loại biểu đồ trực quan khác nhau là yếu tố quan trọng để phân tích dữ liệu hiệu quả. Biểu đồ đường, biểu đồ cột, biểu đồ tròn và biểu đồ vùng là những công cụ cơ bản giúp truyền tải câu chuyện từ dữ liệu rõ ràng và hiệu quả hơn. Giải pháp Analytics của Ultralytics YOLO26 cung cấp cách đơn giản hóa để tạo các biểu đồ này từ kết quả phát hiện và theo dõi đối tượng, giúp bạn dễ dàng rút ra thông tin chuyên sâu có ý nghĩa từ dữ liệu hình ảnh.
Câu hỏi thường gặp#
Để tạo biểu đồ đường bằng Ultralytics YOLO26 Analytics, hãy làm theo các bước sau:
- Tải model YOLO26 và mở tệp video.
- Khởi tạo class
Analyticsvớianalytics_type="line". - Lặp qua các frame video, gọi solution trên từng frame để cập nhật biểu đồ đường bằng dữ liệu như số lượng đối tượng.
- Ghi
results.plot_imvào video đầu ra để lưu biểu đồ.
Dùng ví dụ Python ở trên làm điểm bắt đầu — ví dụ đã chạy đầy đủ vòng lặp frame, và
analytics_typemặc định là biểu đồ đường.Sử dụng Ultralytics YOLO26 để tạo biểu đồ cột mang lại một số lợi ích:
- Trực quan hóa dữ liệu theo thời gian thực: Tích hợp kết quả phát hiện đối tượng vào biểu đồ cột để cập nhật động.
- Dễ sử dụng: API và các hàm đơn giản giúp việc triển khai và trực quan hóa dữ liệu trở nên dễ dàng.
- Tùy chỉnh: Tùy chỉnh tiêu đề, nhãn, màu sắc, v.v. để đáp ứng yêu cầu cụ thể.
- Hiệu quả: Xử lý hiệu quả lượng lớn dữ liệu và cập nhật biểu đồ theo thời gian thực trong quá trình xử lý video.
Để tạo biểu đồ cột, đặt
analytics_type="bar"trong ví dụ Python ở trên — phần còn lại của vòng lặp frame không thay đổi. Xem mục Ví dụ trực quan để xem trước.Ultralytics YOLO26 là lựa chọn tuyệt vời để tạo biểu đồ tròn vì:
- Tích hợp với phát hiện đối tượng: Tích hợp trực tiếp kết quả phát hiện đối tượng vào biểu đồ tròn để có thông tin chuyên sâu ngay lập tức.
- API thân thiện với người dùng: Dễ thiết lập và sử dụng với rất ít mã.
- Có thể tùy chỉnh: Nhiều tùy chọn tùy chỉnh màu sắc, nhãn, v.v.
- Cập nhật theo thời gian thực: Xử lý và trực quan hóa dữ liệu theo thời gian thực, phù hợp với các dự án phân tích video.
Để tạo biểu đồ tròn, đặt
analytics_type="pie"trong ví dụ Python ở trên. Để biết thêm thông tin, hãy tham khảo mục Ví dụ trực quan trong hướng dẫn.Có. Tracking được tích hợp trong solution
Analytics: solution theo dõi nhiều đối tượng theo thời gian thực và làm mới biểu đồ từ dữ liệu đối tượng đã tracking sau mỗi 30 frame, nhờ đó biểu đồ đường, biểu đồ cột, biểu đồ tròn và biểu đồ miền đều phản ánh số lượng trực tiếp. Vòng lặp frame trong ví dụ Python ở trên thực hiện chính xác điều này. Để tìm hiểu về chức năng tracking nền tảng, hãy xem mục Tracking.Ultralytics YOLO26 nổi bật hơn các giải pháp phát hiện đối tượng khác như OpenCV và TensorFlow vì nhiều lý do:
- Độ chính xác tiên tiến nhất: YOLO26 mang lại độ chính xác vượt trội trong các tác vụ phát hiện đối tượng, phân đoạn instance, phân đoạn ngữ nghĩa và phân loại.
- Dễ sử dụng: API thân thiện với người dùng cho phép triển khai và tích hợp nhanh chóng mà không cần viết quá nhiều mã.
- Hiệu năng thời gian thực: Được tối ưu hóa để suy luận tốc độ cao, phù hợp với các ứng dụng thời gian thực.
- Ứng dụng đa dạng: Hỗ trợ tracking nhiều đối tượng, huấn luyện model tùy chỉnh và xuất sang các định dạng khác nhau như ONNX, TensorRT và CoreML.
- Tài liệu toàn diện: Tài liệu và tài nguyên blog phong phú hướng dẫn người dùng qua từng bước.


Bình luận17
Đặt câu hỏi, chia sẻ kết quả hoặc giúp đỡ người khác.
 User
Hello @glenn-jocher How we can optimize/modify the code for YOLO predict, so it can also give final compiled result of prediction as graph. In case of counting objects/cells classed as different categories in images stored in a root folder. Not just the images with the prediction boxes.
yolo train model=yolo11n.pt data=coco8.yaml epochs=100 imgsz=640
yolo predict model=yolo11n.pt source=path/to/bus.jpg
Like the count graph YOLO makes after training or bar/pie chart?
Thanks
- User
@pderrenger Greetings
- User
Hello,
In relation to the above question, will this code work?
#!/usr/bin/env python3 """ yolo_predict_results.py
Run YOLO predictions on a single image or a directory of images, save annotated images, export per-image and aggregate counts to CSV, and save plots (aggregate bar chart and optional stacked per-image bar chart).
Requirements: pip install ultralytics pandas matplotlib pillow
Usage (recommended - command line): # Single image python yolo_predict_results.py --model /path/to/yolo11n.pt --source /path/to/bus.jpg --output results --save-annotated --plot-aggregate
# Directory (batch)
python yolo_predict_results.py --model /path/to/yolo11n.pt --source /path/to/images_dir --output results --save-annotated --plot-per-image --plot-aggregate
This file includes clearly highlighted comments showing exactly where to set your model path and images directory if you prefer to hardcode them in the script instead of using CLI args. """
import argparse from collections import Counter from pathlib import Path import sys
import numpy as np import pandas as pd import matplotlib.pyplot as plt from PIL import Image
try: from ultralytics import YOLO except Exception as e: print("Please install ultralytics (pip install ultralytics).") raise
IMAGE_EXTS = {".jpg", ".jpeg", ".png", ".bmp", ".tif", ".tiff", ".webp"}
def find_images(directory: Path): return [str(p) for p in sorted(directory.rglob("*")) if p.suffix.lower() in IMAGE_EXTS]
def predict_images(model, paths, conf=0.25, imgsz=640, device=None, save_annotated=False, out_dir=None): """ Run prediction per-image (keeps mapping simple). Returns list of dicts: {'file': path, 'counts': Counter, 'total': int} """ out_dir = Path(out_dir) if out_dir is not None else None annotated_dir = (out_dir / "annotated") if (save_annotated and out_dir is not None) else None if annotated_dir: annotated_dir.mkdir(parents=True, exist_ok=True)
results = []
for p in paths:
    print(f"Predicting: {p}")
    res_list = model.predict(source=p, conf=conf, imgsz=imgsz, device=device, verbose=False)
    if not res_list:
        print(f"Warning: no result for {p}")
        continue
    r = res_list[0]

    counts = Counter()
    try:
        box_cls = getattr(r.boxes, "cls", None)
        if box_cls is not None:
            try:
                arr = box_cls.cpu().numpy()
            except Exception:
                arr = np.array(box_cls)
            arr = arr.astype(int).flatten()
            for c in arr:
                name = model.names.get(int(c), str(int(c)))
                counts[name] += 1
    except Exception as e:
        print(f"Warning: could not parse classes for {p}: {e}")

    total = sum(counts.values())
    results.append({"file": p, "counts": counts, "total": total})

    if save_annotated and annotated_dir:
        try:
            ann = r.plot()
            if isinstance(ann, np.ndarray):
                img_out = Image.fromarray(ann)
            else:
                img_out = ann
            out_path = annotated_dir / (Path(p).stem + "_annotated" + Path(p).suffix)
            img_out.save(out_path)
        except Exception as e:
            print(f"Warning: failed to save annotated image for {p}: {e}")

return results
def build_dataframe(summary): all_classes = set() for row in summary: all_classes.update(row["counts"].keys()) classes = sorted(all_classes)
rows = []
for row in summary:
    data = {cls: row["counts"].get(cls, 0) for cls in classes}
    data["file"] = row["file"]
    data["total"] = row["total"]
    rows.append(data)

if not rows:
    # Return empty dataframe
    df = pd.DataFrame(columns=["file", "total"] + classes)
else:
    df = pd.DataFrame(rows)
    cols = ["file"] + classes + ["total"]
    df = df[cols]
return df, classes
def save_csvs(summary, out_dir: Path): df, classes = build_dataframe(summary) out_dir.mkdir(parents=True, exist_ok=True) csv1 = out_dir / "counts_per_image.csv" df.to_csv(csv1, index=False) print(f"Saved per-image counts to: {csv1}")
agg = Counter()
for r in summary:
    agg.update(r["counts"])
agg_series = pd.Series(dict(agg)).sort_values(ascending=False)
csv2 = out_dir / "aggregate_counts.csv"
agg_series.to_csv(csv2, header=["count"])
print(f"Saved aggregate counts to: {csv2}")
return df, classes, agg
def plot_aggregate(agg_counter, out_path: Path): names = list(agg_counter.keys()) counts = [agg_counter[n] for n in names] fig, ax = plt.subplots(figsize=(max(6, len(names) * 0.6), 5)) ax.bar(names, counts, color="tab:blue") ax.set_ylabel("Count") ax.set_title("Aggregate object counts") plt.xticks(rotation=45, ha="right") plt.tight_layout() out_path.parent.mkdir(parents=True, exist_ok=True) fig.savefig(out_path) plt.close(fig) print(f"Saved aggregate plot to: {out_path}")
def plot_stacked_per_image(df: pd.DataFrame, classes, out_path: Path, top_n=50): if df.empty: print("No per-image data to plot.") return plot_df = df.copy() if top_n and len(plot_df) > top_n: plot_df = plot_df.sort_values("total", ascending=False).head(top_n) x = plot_df["file"].apply(lambda p: Path(p).name).tolist() bottoms = np.zeros(len(plot_df)) fig, ax = plt.subplots(figsize=(max(8, len(x) * 0.6), 6)) for cls in classes: vals = plot_df[cls].values ax.bar(x, vals, bottom=bottoms, label=cls) bottoms += vals ax.set_ylabel("Counts") ax.set_title("Per-image stacked counts") ax.legend(bbox_to_anchor=(1.05, 1), loc="upper left") plt.xticks(rotation=45, ha="right") plt.tight_layout() out_path.parent.mkdir(parents=True, exist_ok=True) fig.savefig(out_path) plt.close(fig) print(f"Saved per-image stacked plot to: {out_path}")
def main(): ap = argparse.ArgumentParser(description="YOLO predict -> save CSV + plots") ap.add_argument("--model", required=False, help="Path to YOLO model (.pt) (e.g., yolo11n.pt)") ap.add_argument("--source", required=False, help="Image file or directory of images") ap.add_argument("--output", required=False, help="Output directory", default="results") ap.add_argument("--conf", type=float, default=0.25, help="Confidence threshold") ap.add_argument("--imgsz", type=int, default=640, help="Image size for inference") ap.add_argument("--device", type=str, default=None, help="Device (e.g., 0 or 'cpu')") ap.add_argument("--save-annotated", action="store_true", help="Save annotated images") ap.add_argument("--plot-per-image", action="store_true", help="Save stacked per-image plot") ap.add_argument("--plot-aggregate", action="store_true", help="Save aggregate bar chart") ap.add_argument("--top-n", type=int, default=50, help="Top N images for per-image plot when many images")
# Parse CLI args (recommended usage)
args = ap.parse_args()

# -------------------------------------------------------------------------
# HIGHLIGHT 1: If you want to hardcode paths, replace the `args = ap.parse_args()` line
# with the block below. Edit the two highlighted lines inside the block:
#    model="..."   <-- SET YOUR MODEL FILE PATH HERE
#    source="..."  <-- SET YOUR IMAGE FILE OR IMAGES DIRECTORY PATH HERE
#
# Example (UNCOMMENT and EDIT, then COMMENT OUT or REMOVE the args = ap.parse_args() above):
#
# args = argparse.Namespace(
#     model="/path/to/yolo11n.pt",       # <<< HIGHLIGHT: set model path here (absolute or relative)
#     source="/path/to/images_or_image", # <<< HIGHLIGHT: set image file or images directory path here
#     output="results",
#     conf=0.25,
#     imgsz=640,
#     device=None,
#     save_annotated=True,
#     plot_per_image=True,
#     plot_aggregate=True,
#     top_n=50
# )
# -------------------------------------------------------------------------

# -------------------------------------------------------------------------
# HIGHLIGHT 2: If you prefer using the command-line, supply these two args when
# running the script:
#   --model /path/to/yolo11n.pt
#   --source /path/to/images_or_image
# These correspond to the variables used below: args.model and args.source
# -------------------------------------------------------------------------

if not args.model or not args.source:
    print("Error: --model and --source are required (or hardcode them in the script).")
    print("Example:")
    print("  python yolo_predict_results.py --model /path/to/yolo11n.pt --source /path/to/images --output results --save-annotated --plot-aggregate")
    sys.exit(1)

model_path = Path(args.model)
source = Path(args.source)
out_dir = Path(args.output)
out_dir.mkdir(parents=True, exist_ok=True)

print(f"Loading model: {model_path}")
model = YOLO(str(model_path))

if source.is_dir():
    files = find_images(source)
    if not files:
        print(f"No images found under {source}")
        sys.exit(1)
elif source.is_file():
    files = [str(source)]
else:
    print(f"Source path not found: {source}")
    sys.exit(1)

summary = predict_images(
    model=model,
    paths=files,
    conf=args.conf,
    imgsz=args.imgsz,
    device=args.device,
    save_annotated=args.save_annotated,
    out_dir=out_dir,
)

if not summary:
    print("No predictions were produced.")
    sys.exit(0)

df, classes, agg = save_csvs(summary, out_dir)

if args.plot_aggregate:
    plot_aggregate(agg, out_dir / "aggregate_counts.png")

if args.plot_per_image:
    plot_stacked_per_image(df, classes, out_dir / "per_image_stacked_counts.png", top_n=args.top_n)

print("All done. Results in:", out_dir.resolve())
if name == "main": main()
 Glenn JocherUltralytics
@MUK003 great question, and thanks for sharing the script in detail.
The short answer is: yes, this is a reasonable way to get per-image and aggregate count graphs from YOLO11 predictions, since
YOLO('yolo11n.pt')returnsResultsobjects wherer.boxes.clsholds the class indices and yourCounter/CSV/Matplotlib logic will work on top of that. I’d recommend first running it on a very small image folder and confirming that the numbers incounts_per_image.csvandaggregate_counts.csvmatch what you expect from a few sample images.From the Ultralytics side there’s currently no built-in
yolo predictCLI flag that directly produces those bar/pie charts like training; your Python approach (or, for video streams, thesolutions.Analyticscharts) is the right pattern. For reference on how analytics is structured inside Ultralytics, you can also glance at the Analytics solution API docs.- User
@glenn-jocher Many thanks :)
yeongnamtan
thank you very much @glenn-jocher
How to integrate the code for line graph with line counter ?
- Glenn JocherUltralytics(đã chỉnh sửa)
@yeongnamtan to integrate the line graph with a line counter, use the
Analyticsclass to update the line graph with the total object counts per frame. Ensure you initialize theAnalyticswithanalytics_type="line"and update it within your video processing loop. For detailed guidance, please refer to the analytics section in the documentation.
Peymankar
Hi, how can i count number of left turns or right turns in an intersection?
- Glenn JocherUltralytics
@Peymankar hello!
To count the number of left or right turns at an intersection using Ultralytics YOLO, you can set up a tracking system that identifies and follows each vehicle's trajectory. Here’s a brief outline on how you might approach this:
-
Track Vehicles: Use the YOLO model to detect and track vehicles. You can use the
model.track()function to keep track of each vehicle's movement frame by frame. -
Define Zones: Define areas or lines within the video frame that represent the boundaries of different turn directions (left, right).
-
Analyze Trajectories: Analyze the paths of tracked vehicles to determine when they cross these defined zones. This can be done by checking the intersection of vehicle tracks with these zones and classifying the movement as a left or right turn based on the zone they intersect.
-
Count Turns: Maintain a count of how many vehicles make left or right turns based on these intersections.
For a more detailed guide on setting up vehicle tracking and analyzing trajectories, you might find the tracking and analytics features in the Ultralytics documentation helpful. Implementing this will require some custom coding to define zones and analyze paths relative to these zones.
If you need further assistance or more specific guidance, feel free to ask. Happy coding! 😊
-
ani = FuncAnimation(fig, animate, frames=range(int(cap.get(cv2.CAP_PROP_FRAME_COUNT))), blit=False, interval=1000/fps, repeat=False)
plt.show()
The code is still not working... I
error meesage ... WARNING ⚠️ best.pt appears to require 'dill', which is not in ultralytics requirements. AutoInstall will run now for 'dill' but this feature will be removed in the future. Recommend fixes are to train a new model using the latest 'ultralytics' package or to run a command with an official YOLOv8 model, i.e. 'yolo predict model=yolov8n.pt' requirements: Ultralytics requirement ['dill'] not found, attempting AutoUpdate... Collecting dill Downloading dill-0.3.8-py3-none-any.whl (116 kB) ━━━━━━━━━━━━━━━━━━━━━━━━━━━━━━━━━━━━━━━━ 116.3/116.3 kB 4.9 MB/s eta 0:00:00 Installing collected packages: dill Successfully installed dill-0.3.8
requirements: AutoUpdate success ✅ 5.8s, installed 1 package: ['dill'] requirements: ⚠️ Restart runtime or rerun command for updates to take effect
requirements: Ultralytics requirement ['lapx>=0.5.2'] not found, attempting AutoUpdate... Collecting lapx>=0.5.2 Downloading lapx-0.5.9-cp310-cp310-manylinux_2_5_x86_64.manylinux1_x86_64.manylinux_2_17_x86_64.manylinux2014_x86_64.whl (1.7 MB) ━━━━━━━━━━━━━━━━━━━━━━━━━━━━━━━━━━━━━━━━ 1.7/1.7 MB 11.8 MB/s eta 0:00:00 Requirement already satisfied: numpy>=1.21.6 in /usr/local/lib/python3.10/dist-packages (from lapx>=0.5.2) (1.25.2) Installing collected packages: lapx Successfully installed lapx-0.5.9
requirements: AutoUpdate success ✅ 7.4s, installed 1 package: ['lapx>=0.5.2'] requirements: ⚠️ Restart runtime or rerun command for updates to take effect
0: 384x640 2 fishs, 134.7ms Speed: 13.4ms preprocess, 134.7ms inference, 747.7ms postprocess per image at shape (1, 3, 384, 640)
DisabledFunctionError Traceback (most recent call last) in <cell line: 26>() 37 clswise_count[model.names[int(cls)]] = 1 38 ---> 39 analytics.update_bar(clswise_count) 40 cv2_imshow('Bar Plot', frame) 41 clswise_count = {}
1 frames /usr/local/lib/python3.10/dist-packages/google/colab/_import_hooks/_cv2.py in wrapped(*args, **kwargs) 46 def wrapped(*args, **kwargs): 47 if not os.environ.get(env_var, False): ---> 48 raise DisabledFunctionError(message, name or func.name) 49 return func(*args, **kwargs) 50
DisabledFunctionError: cv2.imshow() is disabled in Colab, because it causes Jupyter sessions to crash; see https://github.com/jupyter/notebook/issues/3935. As a substitution, consider using from google.colab.patches import cv2_imshow
 Paula DerrengerUltralytics
Hello,
Thank you for sharing the details of the issue you're encountering. It seems like the
dillandlapxpackages were missing but have now been successfully installed. Please ensure you restart your runtime or rerun your command to allow the updates to take effect, as suggested by the AutoUpdate messages.Regarding the
DisabledFunctionErrorforcv2.imshow()in Colab, this function is indeed disabled because it can cause Jupyter sessions to crash. As an alternative, you can usecv2_imshowfrom thegoogle.colab.patchesmodule to display images in Colab notebooks. Here’s how you can modify your code:from google.colab.patches import cv2_imshow # Replace cv2.imshow with cv2_imshow cv2_imshow(frame)This should allow you to display images without causing any issues in your Colab environment.
If you have any more questions or need further assistance, feel free to ask. Happy coding! 🚀
thank you
In the code for bar plots , I don't see any cv2.imshow. when I run the code, I get cv2.imshow error.
- Paula DerrengerUltralytics
@yeongnamtan hello,
It seems like you're encountering an issue with
cv2.imshownot being present in the bar plot code example. This function is indeed necessary to display the frames with the visualizations in real-time. To resolve the error, you can add the following line just after updating the bar plot in the loop:cv2.imshow('Bar Plot', frame)Make sure to include this inside the loop where frames are being processed, and it will display the updated frame with the bar plot. Additionally, ensure that you have the line
if cv2.waitKey(1) & 0xFF == ord('q'):to handle the window closure properly.If you need further assistance or have more questions, feel free to ask!
I tried to use google colab but it is giving me error because of cv2.imshow... How can I modify it to use cv2_imshow instead ... from google.colab.patches import cv2_imshow # Import cv2_imshow from google.colab.patches
DisabledFunctionError: cv2.imshow() is disabled in Colab, because it causes Jupyter sessions to crash; see https://github.com/jupyter/notebook/issues/3935. As a substitution, consider using from google.colab.patches import cv2_imshow
- Paula DerrengerUltralytics
Hello! To use
cv2_imshowinstead ofcv2.imshowin Google Colab, you can make a simple modification to your code. First, ensure you importcv2_imshowfromgoogle.colab.patchesas you've mentioned. Then, replace all instances ofcv2.imshowwithcv2_imshow. Here’s how you can do it:-
Import the function:
from google.colab.patches import cv2_imshow -
Replace
cv2.imshowwithcv2_imshow:# Instead of cv2.imshow("Frame", frame) cv2_imshow(frame)
This change should resolve the issue with displaying images in Google Colab. Let me know if there's anything else you need help with! 😊
-