DVCLive를 활용한 고급 YOLO26 실험 track
머신러닝에서 실험 추적은 모델 개발 및 평가에 매우 중요합니다. 여기에는 수많은 학습 실행에서 다양한 매개변수, 메트릭 및 결과를 기록하고 분석하는 작업이 포함됩니다. 이 프로세스는 모델 성능을 이해하고 모델을 개선하고 최적화하기 위한 데이터 기반 의사 결정을 내리는 데 필수적입니다.
Ultralytics YOLO26와 DVCLive를 통합하면 실험이 track되고 관리되는 방식이 변화합니다. 이 통합은 주요 실험 세부 정보를 자동으로 로깅하고, 여러 실행 간의 결과를 비교하며, 심층 분석을 위해 데이터를 시각화하는 원활한 솔루션을 제공합니다. 이 가이드에서는 DVCLive를 사용하여 프로세스를 간소화하는 방법을 알아봅니다.
DVCLive
DVC에서 개발한 DVCLive는 머신러닝 실험 추적을 위한 혁신적인 오픈 소스 도구입니다. Git 및 DVC와 원활하게 통합되어 모델 파라미터 및 훈련 메트릭과 같은 중요한 실험 데이터의 로깅을 자동화합니다. 단순성을 위해 설계된 DVCLive를 사용하면 여러 실행을 간편하게 비교 및 분석할 수 있어 직관적인 데이터 시각화 및 분석 도구를 통해 머신러닝 프로젝트의 효율성을 향상시킬 수 있습니다.
DVCLive를 활용한 YOLO26 학습
DVCLive를 사용하여 YOLO26 훈련 세션을 효과적으로 모니터링할 수 있습니다. 또한 DVC는 모든 track된 실험에서 metric plot을 비교할 수 있는 보고서 생성을 포함하여 이러한 실험을 시각화하기 위한 필수적인 기능을 제공하여 훈련 프로세스에 대한 포괄적인 시야를 제공합니다.
설치
필수 패키지를 설치하려면 다음을 실행합니다:
설치
# Install the required packages for YOLO26 and DVCLive
pip install ultralytics dvclive
설치 프로세스와 관련된 자세한 지침 및 모범 사례는 YOLO26 설치 가이드를 확인하십시오. YOLO26에 필요한 패키지를 설치하는 동안 어려움이 발생하면 해결책 및 팁을 위해 일반적인 문제 가이드를 참조하십시오.
DVCLive 구성
필요한 패키지를 설치했으면 다음 단계는 필요한 자격 증명을 사용하여 환경을 설정하고 구성하는 것입니다. 이 설정을 통해 기존 워크플로우에 DVCLive를 원활하게 통합할 수 있습니다.
Git은 코드와 DVCLive 구성 모두에 대한 버전 제어에서 중요한 역할을 하므로 Git 저장소를 초기화하는 것으로 시작합니다.
초기 환경 설정
# Initialize a Git repository
git init -q

# Configure Git with your details
git config --local user.email "you@example.com"
git config --local user.name "Your Name"

# Initialize DVCLive in your project
dvc init -q

# Commit the DVCLive setup to your Git repository
git commit -m "DVC init"
이 명령에서 "you@example.com"를 Git 계정과 연결된 이메일 주소로, "사용자 이름"을 Git 계정 사용자 이름으로 바꿔야 합니다.
사용법
사용 지침을 살펴보기 전에 Ultralytics에서 제공하는 YOLO26 모델의 범위를 확인하십시오. 이는 프로젝트 요구 사항에 가장 적합한 모델을 선택하는 데 도움이 될 것입니다.
DVCLive를 사용한 YOLO26 모델 훈련
YOLO26 훈련 세션을 실행하는 것으로 시작합니다. 프로젝트 요구 사항에 맞게 다양한 모델 구성과 훈련 매개변수를 사용할 수 있습니다. 예를 들어:
# Example training commands for YOLO26 with varying configurations
yolo train model=yolo26n.pt data=coco8.yaml epochs=5 imgsz=512
yolo train model=yolo26n.pt data=coco8.yaml epochs=5 imgsz=640
특정 요구 사항에 따라 모델, 데이터, epochs 및 imgsz 매개변수를 조정하십시오. 모델 훈련 프로세스 및 모범 사례에 대한 자세한 내용은 YOLO26 모델 훈련 가이드를 참조하십시오.
DVCLive를 이용한 실험 모니터링
DVCLive는 주요 metric의 track 및 시각화를 가능하게 하여 훈련 프로세스를 향상시킵니다. 설치되면 Ultralytics YOLO26는 실험 track을 위해 DVCLive와 자동으로 통합되며, 이를 통해 나중에 성능 통찰력을 분석할 수 있습니다. 훈련 중 사용되는 특정 성능 metric에 대한 포괄적인 이해를 위해 성능 metric에 대한 자세한 가이드를 살펴보십시오.
결과 분석
YOLO26 훈련 세션이 완료되면 DVCLive의 강력한 시각화 도구를 활용하여 결과를 심층적으로 분석할 수 있습니다. DVCLive 통합은 모든 훈련 metric이 체계적으로 로깅되도록 보장하여 모델 성능에 대한 포괄적인 평가를 용이하게 합니다.
분석을 시작하려면 DVC의 API를 사용하여 실험 데이터를 추출하고 Pandas로 처리하여 더 쉽게 다루고 시각화할 수 있습니다.
import dvc.api
import pandas as pd

# Define the columns of interest
columns = ["Experiment", "epochs", "imgsz", "model", "metrics.mAP50-95(B)"]

# Retrieve experiment data
df = pd.DataFrame(dvc.api.exp_show(), columns=columns)

# Clean the data
df.dropna(inplace=True)
df.reset_index(drop=True, inplace=True)

# Display the DataFrame
print(df)
위 코드 스니펫의 출력은 YOLO26 모델로 수행된 다양한 실험에 대한 명확한 표 형식 보기를 제공합니다. 각 행은 실험 이름, epoch 수, 이미지 크기(imgsz), 사용된 특정 모델 및 mAP50-95(B) metric을 자세히 설명하는 다른 훈련 실행을 나타냅니다. 이 metric은 모델의 정확도를 평가하는 데 중요하며, 값이 높을수록 성능이 우수함을 나타냅니다.
Plotly를 이용한 결과 시각화
실험 결과에 대한 보다 상호 작용적이고 시각적인 분석을 위해 Plotly의 평행 좌표 플롯을 사용할 수 있습니다. 이 플롯은 다양한 매개변수와 메트릭 간의 관계 및 상충 관계를 이해하는 데 특히 유용합니다.
from plotly.express import parallel_coordinates

# Create a parallel coordinates plot
fig = parallel_coordinates(df, columns, color="metrics.mAP50-95(B)")

# Display the plot
fig.show()
위 코드 스니펫의 출력은 에포크, 이미지 크기, 모델 유형 및 해당 mAP50-95(B) 점수 간의 관계를 시각적으로 나타내는 플롯을 생성하여 실험 데이터의 추세와 패턴을 파악할 수 있도록 합니다.
DVC를 사용한 비교 시각화 생성
DVC는 실험에 대한 비교 플롯을 생성하는 데 유용한 명령을 제공합니다. 이는 다양한 학습 실행에서 여러 모델의 성능을 비교하는 데 특히 유용할 수 있습니다.
# Generate DVC comparative plots
dvc plots diff $(dvc exp list --names-only)
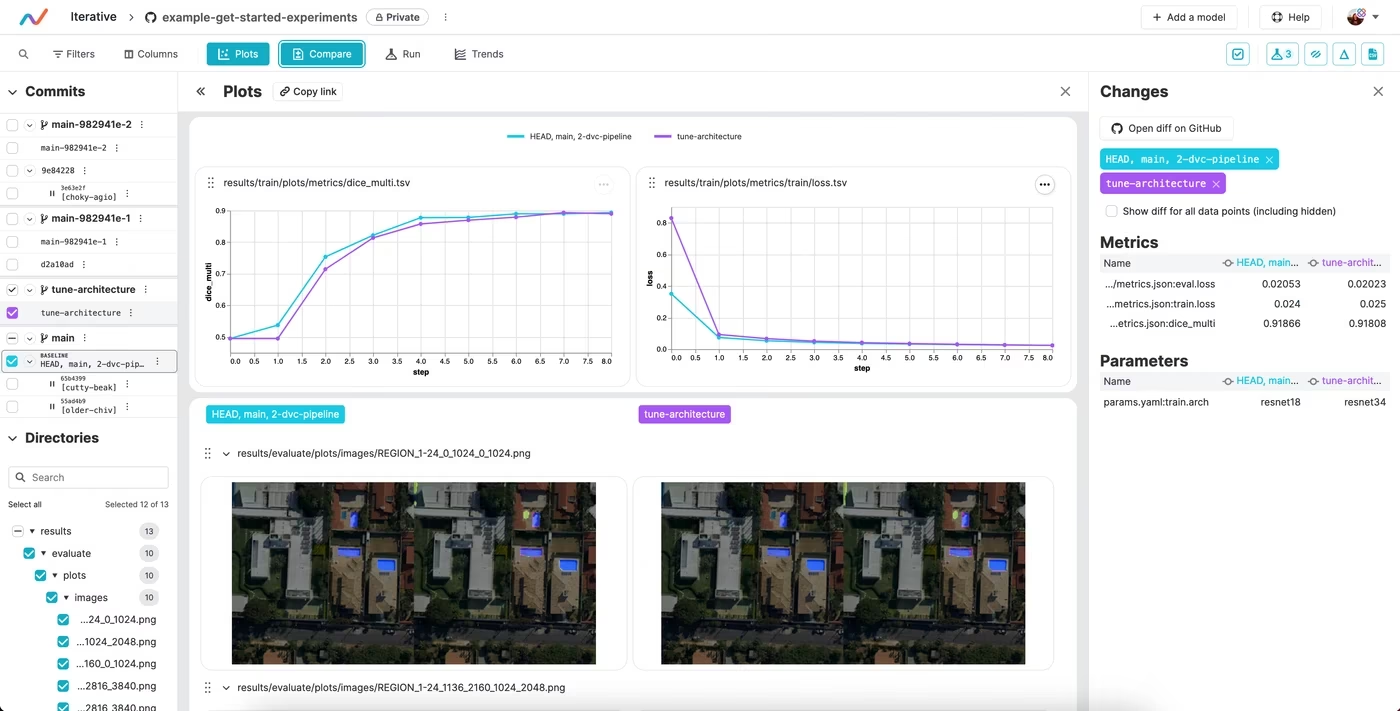
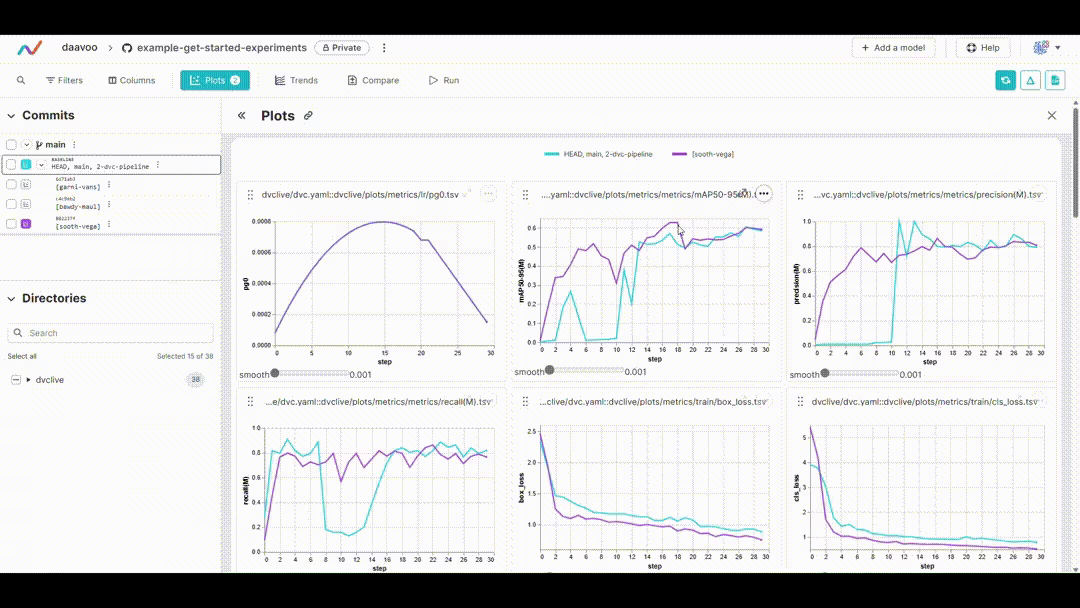
이 명령을 실행하면 DVC는 여러 실험에 걸친 지표를 비교하는 플롯을 생성하며, 이 플롯은 HTML 파일로 저장됩니다. 아래는 이 프로세스에 의해 생성되는 일반적인 플롯을 보여주는 예시 이미지입니다. 이미지는 mAP, 재현율, 정밀도, 손실 값 등을 나타내는 다양한 그래프를 보여주며, 주요 성능 지표에 대한 시각적 개요를 제공합니다.
DVC 플롯 표시
Jupyter Notebook을 사용 중이고 생성된 DVC 플롯을 표시하려면 IPython 디스플레이 기능을 사용할 수 있습니다.
from IPython.display import HTML

# Display the DVC plots as HTML
HTML(filename="./dvc_plots/index.html")
이 코드는 DVC 플롯이 포함된 HTML 파일을 Jupyter Notebook에서 직접 렌더링하여 시각화된 실험 데이터를 쉽고 편리하게 분석할 수 있도록 합니다.
데이터 기반 의사 결정
이러한 시각화 자료에서 얻은 통찰력을 활용하여 모델 최적화, 하이퍼파라미터 튜닝 및 기타 수정 사항에 대한 정보를 바탕으로 의사 결정을 내려 모델 성능을 향상시키세요.
실험 반복
분석을 바탕으로 실험을 반복합니다. 모델 구성, 학습 파라미터 또는 데이터 입력까지 조정하고 학습 및 분석 프로세스를 반복합니다. 이 반복적인 접근 방식은 최상의 성능을 위해 모델을 개선하는 데 핵심입니다.
요약
이 가이드는 Ultralytics의 YOLO26와 DVCLive를 통합하는 과정을 안내했습니다. 머신러닝 작업에서 DVCLive의 기능을 활용하여 상세한 실험 모니터링, 효과적인 시각화 및 통찰력 있는 분석을 수행하는 방법을 배웠습니다.
사용법에 대한 자세한 내용은 DVCLive 공식 문서를 참조하십시오.
또한 Ultralytics 통합 가이드 페이지를 방문하여 Ultralytics의 더 많은 통합 및 기능을 살펴보십시오. 이 페이지는 훌륭한 리소스와 통찰력 모음입니다.
FAQ
실험 track을 위해 DVCLive를 Ultralytics YOLO26와 어떻게 통합하나요?
Ultralytics YOLO26와 DVCLive를 통합하는 것은 간단합니다. 필요한 패키지를 설치하는 것으로 시작하십시오:
설치
pip install ultralytics dvclive
다음으로, Git 저장소를 초기화하고 프로젝트에서 DVCLive를 구성합니다.
초기 환경 설정
git init -q
git config --local user.email "you@example.com"
git config --local user.name "Your Name"
dvc init -q
git commit -m "DVC init"
자세한 설정 지침은 YOLO26 설치 가이드를 따르십시오.
YOLO26 실험 track을 위해 DVCLive를 왜 사용해야 하나요?
YOLO26와 함께 DVCLive를 사용하면 다음과 같은 여러 이점을 제공합니다:
- 자동 로깅: DVCLive는 모델 파라미터 및 메트릭과 같은 주요 실험 세부 정보를 자동으로 기록합니다.
- 쉬운 비교: 다양한 실행 결과에 대한 비교를 용이하게 합니다.
- 시각화 도구: 심층 분석을 위해 DVCLive의 강력한 데이터 시각화 기능을 활용합니다.
자세한 내용은 YOLO26 모델 훈련 및 YOLO 성능 metric에 대한 가이드를 참조하여 실험 track 효율성을 극대화하십시오.
DVCLive가 YOLO26 훈련 세션의 결과 분석을 어떻게 개선할 수 있나요?
YOLO26 훈련 세션을 완료한 후 DVCLive는 결과를 효과적으로 시각화하고 분석하는 데 도움을 줍니다. 실험 데이터를 로드하고 표시하는 예시 코드:
import dvc.api
import pandas as pd

# Define columns of interest
columns = ["Experiment", "epochs", "imgsz", "model", "metrics.mAP50-95(B)"]

# Retrieve experiment data
df = pd.DataFrame(dvc.api.exp_show(), columns=columns)

# Clean data
df.dropna(inplace=True)
df.reset_index(drop=True, inplace=True)

# Display DataFrame
print(df)
결과를 대화식으로 시각화하려면 Plotly의 평행 좌표 플롯을 사용하십시오.
from plotly.express import parallel_coordinates

fig = parallel_coordinates(df, columns, color="metrics.mAP50-95(B)")
fig.show()
더 많은 예시와 모범 사례는 DVCLive를 사용한 YOLO26 훈련 가이드를 참조하십시오.
DVCLive와 YOLO26 통합을 위한 환경 구성 단계는 무엇인가요?
DVCLive와 YOLO26의 원활한 통합을 위해 환경을 구성하려면 다음 단계를 따르십시오:
- 필수 패키지 설치: 사용
pip install ultralytics dvclive. - Git 저장소 초기화: 실행
git init -q. - DVCLive 설치: 실행
dvc init -q. - Git에 커밋: 사용
git commit -m "DVC init".
이러한 단계를 통해 적절한 버전 관리와 실험 추적 설정을 보장할 수 있습니다. 자세한 구성 정보는 구성 가이드를 참조하십시오.
DVCLive를 사용하여 YOLO26 실험 결과를 어떻게 시각화하나요?
DVCLive는 YOLO26 실험 결과를 시각화하는 강력한 도구를 제공합니다. 비교 plot을 생성하는 방법은 다음과 같습니다:
비교 플롯 생성
dvc plots diff $(dvc exp list --names-only)
Jupyter Notebook에서 이러한 플롯을 표시하려면 다음을 사용하십시오:
from IPython.display import HTML

# Display plots as HTML
HTML(filename="./dvc_plots/index.html")
이러한 시각화는 추세를 파악하고 모델 성능을 최적화하는 데 도움이 됩니다. 포괄적인 단계와 예시는 YOLO26 실험 분석에 대한 자세한 가이드를 확인하십시오.


