Análise com Ultralytics YOLO26
A análise com Ultralytics YOLO26 transforma os resultados da detecção de objetos e do rastreamento em gráficos em tempo real, permitindo acompanhar como as contagens de objetos mudam a cada quadro do vídeo. Este guia aborda quatro tipos de visualização de dados — gráficos de linhas, gráficos de barras, gráficos de pizza e gráficos de área — e mostra como alternar entre eles com exemplos compartilhados de Python e CLI.
Assista: Como gerar gráficos analíticos usando Ultralytics | Gráficos de linhas, barras, áreas e setores
Exemplos visuais#
| Gráfico de linhas | Gráfico de barras | Gráfico de pizza |
|---|---|---|
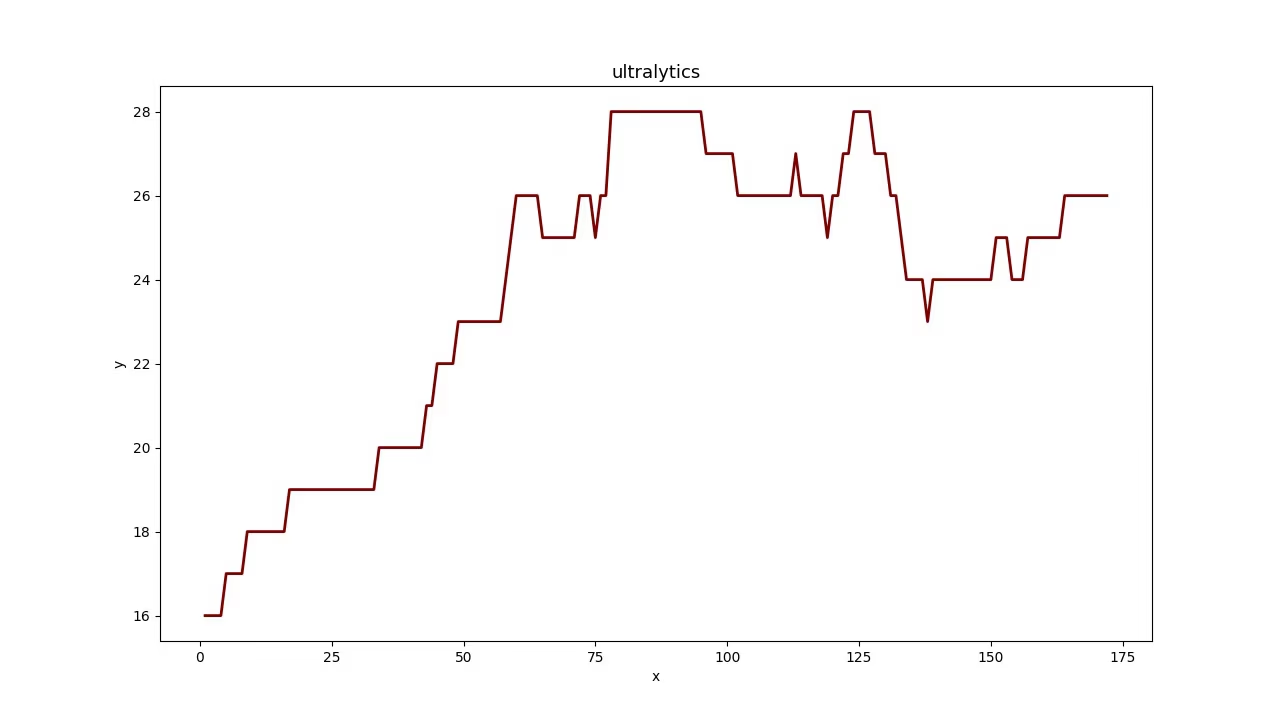 | 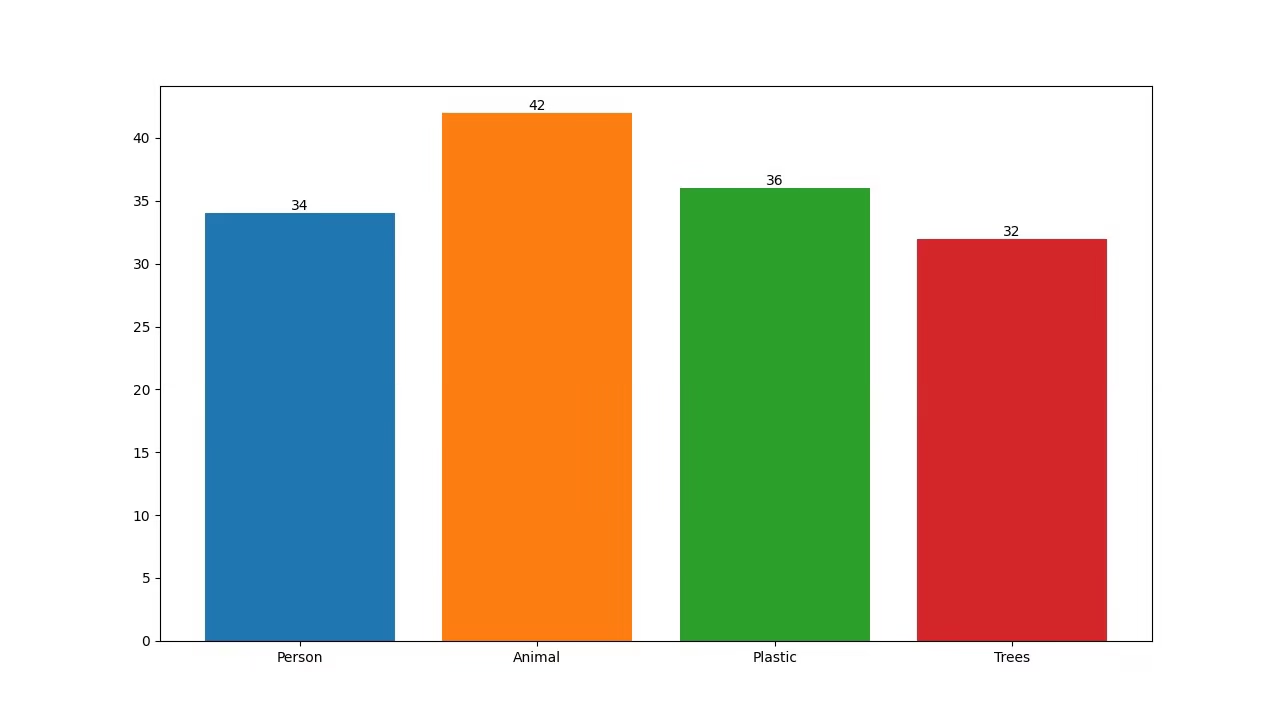 | 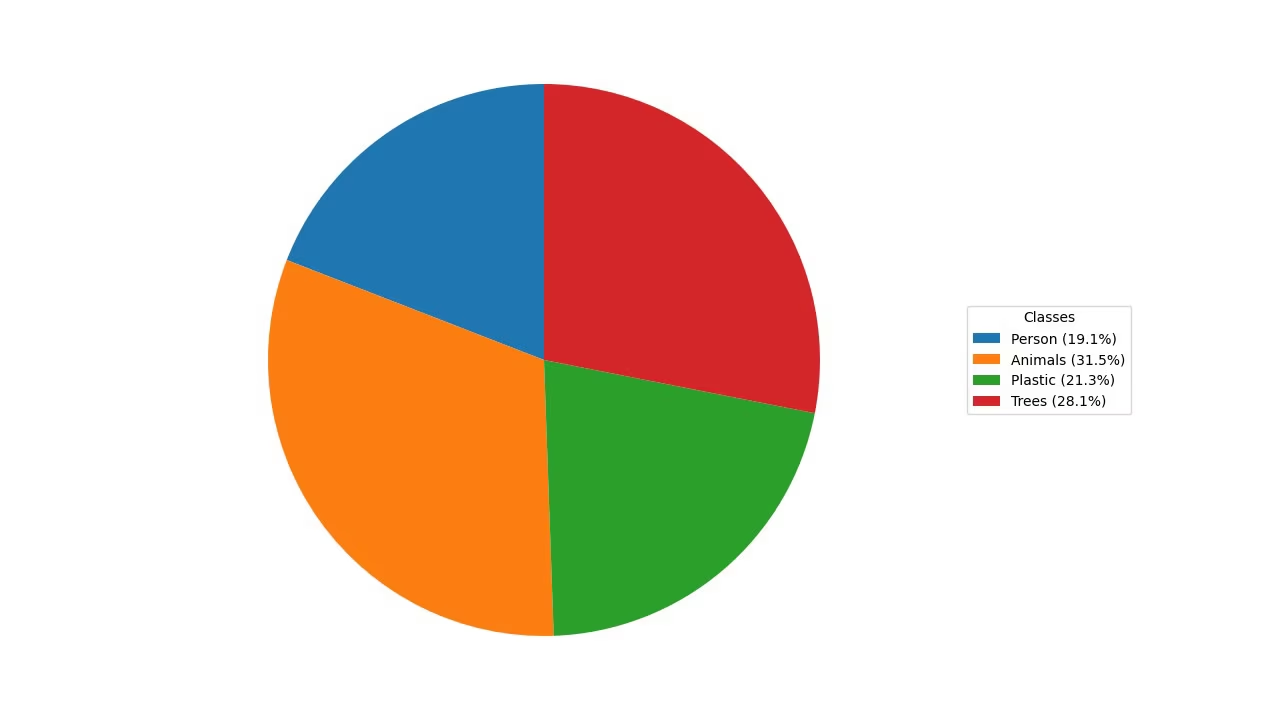 |
Por que visualizar dados de detecção?#
- Gráficos de linhas são ideais para acompanhar mudanças em períodos curtos e longos e para comparar as mudanças de vários grupos durante o mesmo período.
- Gráficos de barras são adequados para comparar quantidades entre diferentes categorias e mostrar relações entre uma categoria e seu valor numérico.
- Gráficos de pizza são eficazes para ilustrar proporções entre categorias e mostrar as partes de um todo.
- Gráficos de área preenchem a área sob o gráfico de linhas, facilitando a leitura rápida das contagens de objetos por classe ao longo do tempo.
Gerar gráficos de análise#
Envia o teu vídeo para a solução Analytics e seleciona um gráfico com analytics_type. A solução executa a detecção e o rastreamento em cada quadro e renderiza um gráfico de 1280×720 (por padrão), que podes gravar diretamente em um vídeo de saída. Alterna entre "line", "bar", "pie" e "area" com um único argumento.
yolo solutions analytics show=True

# Pass the source
yolo solutions analytics source="path/to/video.mp4"

# Generate the pie chart
yolo solutions analytics analytics_type="pie" show=True

# Generate the bar plots
yolo solutions analytics analytics_type="bar" show=True

# Generate the area plots
yolo solutions analytics analytics_type="area" show=True
Argumentos de Analytics#
Segue uma tabela com os argumentos de análise:
| Argumento | Tipo | Padrão | Descrição |
|---|---|---|---|
model | str | None | Caminho para um arquivo de modelo Ultralytics YOLO. |
analytics_type | str | 'line' | Tipo de gráfico, por exemplo, line, bar, area ou pie. |
figsize | tuple[float, float] | (12.8, 7.2) | Tamanho da figura em polegadas para gráficos Analytics; (12.8, 7.2) renderiza um fotograma de 1280×720. |
line_width | int | 2 | Espessura das linhas das caixas, dos pontos-chave e das contagens desenhados pela solução. |
verbose | bool | True | Ativa o registro por quadro da solução, com o formato da entrada, as contagens por classe e a velocidade de processamento. A chamada de rastreamento em si é sempre silenciosa. |
Você também pode usar argumentos track na solução Analytics.
| Argumento | Tipo | Padrão | Descrição |
|---|---|---|---|
tracker | str | 'tracktrack.yaml' | Especifica o algoritmo de rastreamento a utilizar. Opções integradas: botsort.yaml, bytetrack.yaml, ocsort.yaml, deepocsort.yaml, fasttrack.yaml, tracktrack.yaml. |
conf | float | 0.25 | Define o limiar de confiança das deteções; valores mais baixos permitem rastrear mais objetos, mas podem incluir falsos positivos. |
iou | float | 0.5 | Define o limiar de interseção sobre união (IoU) para filtrar deteções sobrepostas. |
classes | list | None | Filtra os resultados pelo índice da classe. Por exemplo, classes=[0, 2, 3] rastreia apenas as classes especificadas. |
device | str | None | Especifica o dispositivo para a inferência (por exemplo, cpu, cuda:0 ou 0). Permite escolher entre CPU, uma GPU específica ou outros dispositivos de computação para executar o modelo. |
imgsz | int or tuple | 640 | Tamanho da imagem de destino para a inferência: um número inteiro para uma imagem quadrada ou um par (height, width). As dimensões são ajustadas ao stride do modelo. |
max_det | int | 300 | Número máximo de deteções mantidas por fotograma antes do rastreamento, limitando os objetos que uma solução processa em cenas densas. |
quantize | int or str | None | Precisão de inferência: 16 (FP16) ou 32/unset (FP32) para modelos PyTorch e TorchScript fora da CPU; os outros formatos usam a precisão selecionada pelo artefato e pelo ambiente de execução. Substitui o argumento obsoleto half. |
Além disso, há suporte para os seguintes argumentos de visualização:
| Argumento | Tipo | Padrão | Descrição |
|---|---|---|---|
show | bool | False | Se True, exibe as imagens ou os vídeos anotados em uma janela. Útil para obter feedback visual imediato durante o desenvolvimento ou os testes. |
Conclusão#
Entender quando e como usar diferentes tipos de visualização é fundamental para uma análise de dados eficaz. Gráficos de linhas, barras, setores e áreas são ferramentas essenciais que ajudam a comunicar a história dos seus dados de forma mais clara e eficiente. A solução Analytics do Ultralytics YOLO26 oferece uma maneira simplificada de gerar essas visualizações a partir dos resultados de detecção e rastreamento de objetos, facilitando a extração de informações relevantes dos seus dados visuais.
Perguntas frequentes#
Para criar um gráfico de linhas usando o Ultralytics YOLO26 Analytics, segue estas etapas:
- Carrega um modelo YOLO26 e abre o teu arquivo de vídeo.
- Inicializa a classe
Analyticscomanalytics_type="line". - Percorre os quadros do vídeo, chamando a solução em cada quadro para atualizar o gráfico de linhas com dados como as contagens de objetos.
- Grava
results.plot_imem um vídeo de saída para salvar o gráfico.
Usa o exemplo de Python acima como ponto de partida — ele já executa o loop completo dos quadros, e o gráfico de linhas é o
analytics_typepadrão.Usar o Ultralytics YOLO26 para criar gráficos de barras oferece vários benefícios:
- Visualização de dados em tempo real: integre os resultados da detecção de objetos em gráficos de barras para atualizações dinâmicas.
- Facilidade de uso: a API e as funções simples facilitam a implementação e a visualização dos dados.
- Personalização: personaliza títulos, rótulos, cores e muito mais para atender às tuas necessidades específicas.
- Eficiência: processe grandes volumes de dados com eficiência e atualize os gráficos em tempo real durante o processamento de vídeo.
Para gerar um gráfico de barras, define
analytics_type="bar"no exemplo de Python acima — o restante do loop dos quadros é idêntico. Consulta a seção Exemplos visuais para ver uma prévia.O Ultralytics YOLO26 é uma excelente opção para criar gráficos de pizza porque:
- Integração com a detecção de objetos: integra diretamente os resultados da detecção de objetos aos gráficos de pizza para obter informações imediatas.
- API fácil de usar: é simples de configurar e usar, exigindo pouco código.
- Personalizável: oferece várias opções de personalização de cores, rótulos e muito mais.
- Atualizações em tempo real: processe e visualize dados em tempo real, algo ideal para projetos de análise de vídeo.
Para gerar um gráfico de pizza, define
analytics_type="pie"no exemplo de Python acima. Para mais informações, consulta a seção Exemplos visuais do guia.Sim. O rastreamento está integrado à solução
Analytics: ela rastreia vários objetos em tempo real e atualiza o gráfico com os dados dos objetos rastreados a cada 30 quadros, fazendo com que os gráficos de linhas, barras, pizza e área reflitam as contagens ao vivo. É exatamente isso que o loop de quadros do exemplo de Python acima faz. Para saber mais sobre a funcionalidade de rastreamento subjacente, consulta a seção Rastreamento.O Ultralytics YOLO26 se destaca de outras soluções de detecção de objetos, como OpenCV e TensorFlow, por vários motivos:
- Precisão de ponta: o YOLO26 oferece precisão superior em tarefas de detecção de objetos, segmentação de instâncias, segmentação semântica e classificação.
- Facilidade de uso: a API fácil de usar permite implementação e integração rápidas sem exigir muita programação.
- Desempenho em tempo real: otimizado para inferência de alta velocidade, adequado para aplicações em tempo real.
- Aplicações diversas: oferece suporte ao rastreamento de vários objetos, ao treinamento de modelos personalizados e à exportação para diferentes formatos, como ONNX, TensorRT e CoreML.
- Documentação abrangente: documentação extensa (documentation) e recursos do blog para orientar os usuários em cada etapa.


Comentários17
Faz uma pergunta, partilha os teus resultados ou ajuda alguém.
 User
Hello @glenn-jocher How we can optimize/modify the code for YOLO predict, so it can also give final compiled result of prediction as graph. In case of counting objects/cells classed as different categories in images stored in a root folder. Not just the images with the prediction boxes.
yolo train model=yolo11n.pt data=coco8.yaml epochs=100 imgsz=640
yolo predict model=yolo11n.pt source=path/to/bus.jpg
Like the count graph YOLO makes after training or bar/pie chart?
Thanks
- User
@pderrenger Greetings
- User
Hello,
In relation to the above question, will this code work?
#!/usr/bin/env python3 """ yolo_predict_results.py
Run YOLO predictions on a single image or a directory of images, save annotated images, export per-image and aggregate counts to CSV, and save plots (aggregate bar chart and optional stacked per-image bar chart).
Requirements: pip install ultralytics pandas matplotlib pillow
Usage (recommended - command line): # Single image python yolo_predict_results.py --model /path/to/yolo11n.pt --source /path/to/bus.jpg --output results --save-annotated --plot-aggregate
# Directory (batch)
python yolo_predict_results.py --model /path/to/yolo11n.pt --source /path/to/images_dir --output results --save-annotated --plot-per-image --plot-aggregate
This file includes clearly highlighted comments showing exactly where to set your model path and images directory if you prefer to hardcode them in the script instead of using CLI args. """
import argparse from collections import Counter from pathlib import Path import sys
import numpy as np import pandas as pd import matplotlib.pyplot as plt from PIL import Image
try: from ultralytics import YOLO except Exception as e: print("Please install ultralytics (pip install ultralytics).") raise
IMAGE_EXTS = {".jpg", ".jpeg", ".png", ".bmp", ".tif", ".tiff", ".webp"}
def find_images(directory: Path): return [str(p) for p in sorted(directory.rglob("*")) if p.suffix.lower() in IMAGE_EXTS]
def predict_images(model, paths, conf=0.25, imgsz=640, device=None, save_annotated=False, out_dir=None): """ Run prediction per-image (keeps mapping simple). Returns list of dicts: {'file': path, 'counts': Counter, 'total': int} """ out_dir = Path(out_dir) if out_dir is not None else None annotated_dir = (out_dir / "annotated") if (save_annotated and out_dir is not None) else None if annotated_dir: annotated_dir.mkdir(parents=True, exist_ok=True)
results = []
for p in paths:
    print(f"Predicting: {p}")
    res_list = model.predict(source=p, conf=conf, imgsz=imgsz, device=device, verbose=False)
    if not res_list:
        print(f"Warning: no result for {p}")
        continue
    r = res_list[0]

    counts = Counter()
    try:
        box_cls = getattr(r.boxes, "cls", None)
        if box_cls is not None:
            try:
                arr = box_cls.cpu().numpy()
            except Exception:
                arr = np.array(box_cls)
            arr = arr.astype(int).flatten()
            for c in arr:
                name = model.names.get(int(c), str(int(c)))
                counts[name] += 1
    except Exception as e:
        print(f"Warning: could not parse classes for {p}: {e}")

    total = sum(counts.values())
    results.append({"file": p, "counts": counts, "total": total})

    if save_annotated and annotated_dir:
        try:
            ann = r.plot()
            if isinstance(ann, np.ndarray):
                img_out = Image.fromarray(ann)
            else:
                img_out = ann
            out_path = annotated_dir / (Path(p).stem + "_annotated" + Path(p).suffix)
            img_out.save(out_path)
        except Exception as e:
            print(f"Warning: failed to save annotated image for {p}: {e}")

return results
def build_dataframe(summary): all_classes = set() for row in summary: all_classes.update(row["counts"].keys()) classes = sorted(all_classes)
rows = []
for row in summary:
    data = {cls: row["counts"].get(cls, 0) for cls in classes}
    data["file"] = row["file"]
    data["total"] = row["total"]
    rows.append(data)

if not rows:
    # Return empty dataframe
    df = pd.DataFrame(columns=["file", "total"] + classes)
else:
    df = pd.DataFrame(rows)
    cols = ["file"] + classes + ["total"]
    df = df[cols]
return df, classes
def save_csvs(summary, out_dir: Path): df, classes = build_dataframe(summary) out_dir.mkdir(parents=True, exist_ok=True) csv1 = out_dir / "counts_per_image.csv" df.to_csv(csv1, index=False) print(f"Saved per-image counts to: {csv1}")
agg = Counter()
for r in summary:
    agg.update(r["counts"])
agg_series = pd.Series(dict(agg)).sort_values(ascending=False)
csv2 = out_dir / "aggregate_counts.csv"
agg_series.to_csv(csv2, header=["count"])
print(f"Saved aggregate counts to: {csv2}")
return df, classes, agg
def plot_aggregate(agg_counter, out_path: Path): names = list(agg_counter.keys()) counts = [agg_counter[n] for n in names] fig, ax = plt.subplots(figsize=(max(6, len(names) * 0.6), 5)) ax.bar(names, counts, color="tab:blue") ax.set_ylabel("Count") ax.set_title("Aggregate object counts") plt.xticks(rotation=45, ha="right") plt.tight_layout() out_path.parent.mkdir(parents=True, exist_ok=True) fig.savefig(out_path) plt.close(fig) print(f"Saved aggregate plot to: {out_path}")
def plot_stacked_per_image(df: pd.DataFrame, classes, out_path: Path, top_n=50): if df.empty: print("No per-image data to plot.") return plot_df = df.copy() if top_n and len(plot_df) > top_n: plot_df = plot_df.sort_values("total", ascending=False).head(top_n) x = plot_df["file"].apply(lambda p: Path(p).name).tolist() bottoms = np.zeros(len(plot_df)) fig, ax = plt.subplots(figsize=(max(8, len(x) * 0.6), 6)) for cls in classes: vals = plot_df[cls].values ax.bar(x, vals, bottom=bottoms, label=cls) bottoms += vals ax.set_ylabel("Counts") ax.set_title("Per-image stacked counts") ax.legend(bbox_to_anchor=(1.05, 1), loc="upper left") plt.xticks(rotation=45, ha="right") plt.tight_layout() out_path.parent.mkdir(parents=True, exist_ok=True) fig.savefig(out_path) plt.close(fig) print(f"Saved per-image stacked plot to: {out_path}")
def main(): ap = argparse.ArgumentParser(description="YOLO predict -> save CSV + plots") ap.add_argument("--model", required=False, help="Path to YOLO model (.pt) (e.g., yolo11n.pt)") ap.add_argument("--source", required=False, help="Image file or directory of images") ap.add_argument("--output", required=False, help="Output directory", default="results") ap.add_argument("--conf", type=float, default=0.25, help="Confidence threshold") ap.add_argument("--imgsz", type=int, default=640, help="Image size for inference") ap.add_argument("--device", type=str, default=None, help="Device (e.g., 0 or 'cpu')") ap.add_argument("--save-annotated", action="store_true", help="Save annotated images") ap.add_argument("--plot-per-image", action="store_true", help="Save stacked per-image plot") ap.add_argument("--plot-aggregate", action="store_true", help="Save aggregate bar chart") ap.add_argument("--top-n", type=int, default=50, help="Top N images for per-image plot when many images")
# Parse CLI args (recommended usage)
args = ap.parse_args()

# -------------------------------------------------------------------------
# HIGHLIGHT 1: If you want to hardcode paths, replace the `args = ap.parse_args()` line
# with the block below. Edit the two highlighted lines inside the block:
#    model="..."   <-- SET YOUR MODEL FILE PATH HERE
#    source="..."  <-- SET YOUR IMAGE FILE OR IMAGES DIRECTORY PATH HERE
#
# Example (UNCOMMENT and EDIT, then COMMENT OUT or REMOVE the args = ap.parse_args() above):
#
# args = argparse.Namespace(
#     model="/path/to/yolo11n.pt",       # <<< HIGHLIGHT: set model path here (absolute or relative)
#     source="/path/to/images_or_image", # <<< HIGHLIGHT: set image file or images directory path here
#     output="results",
#     conf=0.25,
#     imgsz=640,
#     device=None,
#     save_annotated=True,
#     plot_per_image=True,
#     plot_aggregate=True,
#     top_n=50
# )
# -------------------------------------------------------------------------

# -------------------------------------------------------------------------
# HIGHLIGHT 2: If you prefer using the command-line, supply these two args when
# running the script:
#   --model /path/to/yolo11n.pt
#   --source /path/to/images_or_image
# These correspond to the variables used below: args.model and args.source
# -------------------------------------------------------------------------

if not args.model or not args.source:
    print("Error: --model and --source are required (or hardcode them in the script).")
    print("Example:")
    print("  python yolo_predict_results.py --model /path/to/yolo11n.pt --source /path/to/images --output results --save-annotated --plot-aggregate")
    sys.exit(1)

model_path = Path(args.model)
source = Path(args.source)
out_dir = Path(args.output)
out_dir.mkdir(parents=True, exist_ok=True)

print(f"Loading model: {model_path}")
model = YOLO(str(model_path))

if source.is_dir():
    files = find_images(source)
    if not files:
        print(f"No images found under {source}")
        sys.exit(1)
elif source.is_file():
    files = [str(source)]
else:
    print(f"Source path not found: {source}")
    sys.exit(1)

summary = predict_images(
    model=model,
    paths=files,
    conf=args.conf,
    imgsz=args.imgsz,
    device=args.device,
    save_annotated=args.save_annotated,
    out_dir=out_dir,
)

if not summary:
    print("No predictions were produced.")
    sys.exit(0)

df, classes, agg = save_csvs(summary, out_dir)

if args.plot_aggregate:
    plot_aggregate(agg, out_dir / "aggregate_counts.png")

if args.plot_per_image:
    plot_stacked_per_image(df, classes, out_dir / "per_image_stacked_counts.png", top_n=args.top_n)

print("All done. Results in:", out_dir.resolve())
if name == "main": main()
 Glenn JocherUltralytics
@MUK003 great question, and thanks for sharing the script in detail.
The short answer is: yes, this is a reasonable way to get per-image and aggregate count graphs from YOLO11 predictions, since
YOLO('yolo11n.pt')returnsResultsobjects wherer.boxes.clsholds the class indices and yourCounter/CSV/Matplotlib logic will work on top of that. I’d recommend first running it on a very small image folder and confirming that the numbers incounts_per_image.csvandaggregate_counts.csvmatch what you expect from a few sample images.From the Ultralytics side there’s currently no built-in
yolo predictCLI flag that directly produces those bar/pie charts like training; your Python approach (or, for video streams, thesolutions.Analyticscharts) is the right pattern. For reference on how analytics is structured inside Ultralytics, you can also glance at the Analytics solution API docs.- User
@glenn-jocher Many thanks :)
yeongnamtan
thank you very much @glenn-jocher
How to integrate the code for line graph with line counter ?
- Glenn JocherUltralytics(editado)
@yeongnamtan to integrate the line graph with a line counter, use the
Analyticsclass to update the line graph with the total object counts per frame. Ensure you initialize theAnalyticswithanalytics_type="line"and update it within your video processing loop. For detailed guidance, please refer to the analytics section in the documentation.
Peymankar
Hi, how can i count number of left turns or right turns in an intersection?
- Glenn JocherUltralytics
@Peymankar hello!
To count the number of left or right turns at an intersection using Ultralytics YOLO, you can set up a tracking system that identifies and follows each vehicle's trajectory. Here’s a brief outline on how you might approach this:
-
Track Vehicles: Use the YOLO model to detect and track vehicles. You can use the
model.track()function to keep track of each vehicle's movement frame by frame. -
Define Zones: Define areas or lines within the video frame that represent the boundaries of different turn directions (left, right).
-
Analyze Trajectories: Analyze the paths of tracked vehicles to determine when they cross these defined zones. This can be done by checking the intersection of vehicle tracks with these zones and classifying the movement as a left or right turn based on the zone they intersect.
-
Count Turns: Maintain a count of how many vehicles make left or right turns based on these intersections.
For a more detailed guide on setting up vehicle tracking and analyzing trajectories, you might find the tracking and analytics features in the Ultralytics documentation helpful. Implementing this will require some custom coding to define zones and analyze paths relative to these zones.
If you need further assistance or more specific guidance, feel free to ask. Happy coding! 😊
-
ani = FuncAnimation(fig, animate, frames=range(int(cap.get(cv2.CAP_PROP_FRAME_COUNT))), blit=False, interval=1000/fps, repeat=False)
plt.show()
The code is still not working... I
error meesage ... WARNING ⚠️ best.pt appears to require 'dill', which is not in ultralytics requirements. AutoInstall will run now for 'dill' but this feature will be removed in the future. Recommend fixes are to train a new model using the latest 'ultralytics' package or to run a command with an official YOLOv8 model, i.e. 'yolo predict model=yolov8n.pt' requirements: Ultralytics requirement ['dill'] not found, attempting AutoUpdate... Collecting dill Downloading dill-0.3.8-py3-none-any.whl (116 kB) ━━━━━━━━━━━━━━━━━━━━━━━━━━━━━━━━━━━━━━━━ 116.3/116.3 kB 4.9 MB/s eta 0:00:00 Installing collected packages: dill Successfully installed dill-0.3.8
requirements: AutoUpdate success ✅ 5.8s, installed 1 package: ['dill'] requirements: ⚠️ Restart runtime or rerun command for updates to take effect
requirements: Ultralytics requirement ['lapx>=0.5.2'] not found, attempting AutoUpdate... Collecting lapx>=0.5.2 Downloading lapx-0.5.9-cp310-cp310-manylinux_2_5_x86_64.manylinux1_x86_64.manylinux_2_17_x86_64.manylinux2014_x86_64.whl (1.7 MB) ━━━━━━━━━━━━━━━━━━━━━━━━━━━━━━━━━━━━━━━━ 1.7/1.7 MB 11.8 MB/s eta 0:00:00 Requirement already satisfied: numpy>=1.21.6 in /usr/local/lib/python3.10/dist-packages (from lapx>=0.5.2) (1.25.2) Installing collected packages: lapx Successfully installed lapx-0.5.9
requirements: AutoUpdate success ✅ 7.4s, installed 1 package: ['lapx>=0.5.2'] requirements: ⚠️ Restart runtime or rerun command for updates to take effect
0: 384x640 2 fishs, 134.7ms Speed: 13.4ms preprocess, 134.7ms inference, 747.7ms postprocess per image at shape (1, 3, 384, 640)
DisabledFunctionError Traceback (most recent call last) in <cell line: 26>() 37 clswise_count[model.names[int(cls)]] = 1 38 ---> 39 analytics.update_bar(clswise_count) 40 cv2_imshow('Bar Plot', frame) 41 clswise_count = {}
1 frames /usr/local/lib/python3.10/dist-packages/google/colab/_import_hooks/_cv2.py in wrapped(*args, **kwargs) 46 def wrapped(*args, **kwargs): 47 if not os.environ.get(env_var, False): ---> 48 raise DisabledFunctionError(message, name or func.name) 49 return func(*args, **kwargs) 50
DisabledFunctionError: cv2.imshow() is disabled in Colab, because it causes Jupyter sessions to crash; see https://github.com/jupyter/notebook/issues/3935. As a substitution, consider using from google.colab.patches import cv2_imshow
 Paula DerrengerUltralytics
Hello,
Thank you for sharing the details of the issue you're encountering. It seems like the
dillandlapxpackages were missing but have now been successfully installed. Please ensure you restart your runtime or rerun your command to allow the updates to take effect, as suggested by the AutoUpdate messages.Regarding the
DisabledFunctionErrorforcv2.imshow()in Colab, this function is indeed disabled because it can cause Jupyter sessions to crash. As an alternative, you can usecv2_imshowfrom thegoogle.colab.patchesmodule to display images in Colab notebooks. Here’s how you can modify your code:from google.colab.patches import cv2_imshow # Replace cv2.imshow with cv2_imshow cv2_imshow(frame)This should allow you to display images without causing any issues in your Colab environment.
If you have any more questions or need further assistance, feel free to ask. Happy coding! 🚀
thank you
In the code for bar plots , I don't see any cv2.imshow. when I run the code, I get cv2.imshow error.
- Paula DerrengerUltralytics
@yeongnamtan hello,
It seems like you're encountering an issue with
cv2.imshownot being present in the bar plot code example. This function is indeed necessary to display the frames with the visualizations in real-time. To resolve the error, you can add the following line just after updating the bar plot in the loop:cv2.imshow('Bar Plot', frame)Make sure to include this inside the loop where frames are being processed, and it will display the updated frame with the bar plot. Additionally, ensure that you have the line
if cv2.waitKey(1) & 0xFF == ord('q'):to handle the window closure properly.If you need further assistance or have more questions, feel free to ask!
I tried to use google colab but it is giving me error because of cv2.imshow... How can I modify it to use cv2_imshow instead ... from google.colab.patches import cv2_imshow # Import cv2_imshow from google.colab.patches
DisabledFunctionError: cv2.imshow() is disabled in Colab, because it causes Jupyter sessions to crash; see https://github.com/jupyter/notebook/issues/3935. As a substitution, consider using from google.colab.patches import cv2_imshow
- Paula DerrengerUltralytics
Hello! To use
cv2_imshowinstead ofcv2.imshowin Google Colab, you can make a simple modification to your code. First, ensure you importcv2_imshowfromgoogle.colab.patchesas you've mentioned. Then, replace all instances ofcv2.imshowwithcv2_imshow. Here’s how you can do it:-
Import the function:
from google.colab.patches import cv2_imshow -
Replace
cv2.imshowwithcv2_imshow:# Instead of cv2.imshow("Frame", frame) cv2_imshow(frame)
This change should resolve the issue with displaying images in Google Colab. Let me know if there's anything else you need help with! 😊
-