Link to this sectionObject Tracking Heatmaps with Ultralytics YOLO26#
![]()
The Heatmap solution in Ultralytics YOLO26 tracks objects across video frames and overlays their accumulated movement intensity onto each frame, so busy areas glow in warm colors while quiet areas stay cool. Built on YOLO26 object tracking, it turns any video into a spatial activity map that reveals traffic flow, crowd movement, and dwell zones with a single Python call or CLI command.
Watch: Heatmaps using Ultralytics YOLO26
Link to this sectionWhy Use Heatmaps for Video Analytics?#
- Spot activity patterns at a glance: Intensity accumulates wherever tracked objects spend time, so high-traffic lanes, popular shelves, or crowd bottlenecks stand out without manual frame-by-frame review.
- Tracking built in: The solution runs YOLO26 detection and tracking internally, so there is no separate tracking pipeline to wire up.
- Counting in the same pass: Pass a
regionto count objects entering and exiting a zone while the heatmap builds, combining two analytics tasks in one run.
Link to this sectionReal World Applications#
| Transportation | Retail |
|---|---|
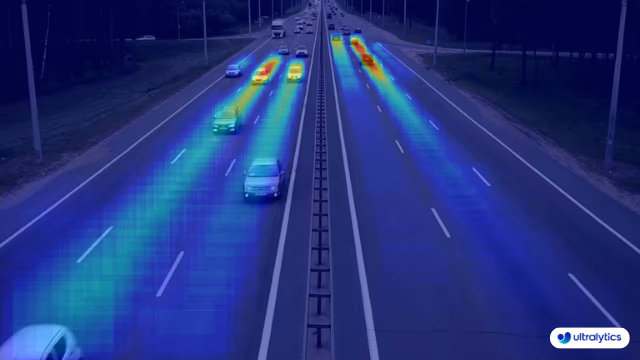 | 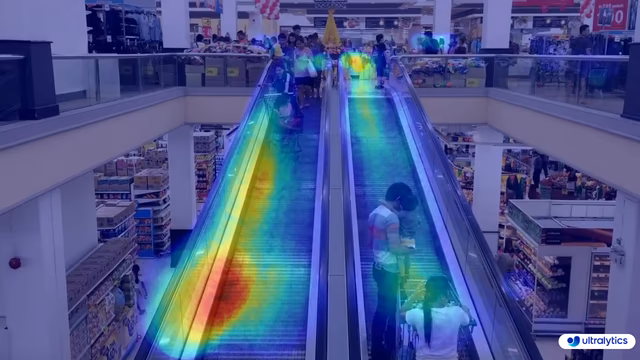 |
| Ultralytics YOLO Transportation Heatmap | Ultralytics YOLO Retail Heatmap |
Link to this sectionHow to Generate Heatmaps with Ultralytics YOLO#
Run the Heatmap solution on a video source from the CLI or Python. The Python example writes the processed frames to an output video file:
# Run a heatmap example
yolo solutions heatmap show=True

# Pass a source video
yolo solutions heatmap source="path/to/video.mp4"

# Pass a custom colormap
yolo solutions heatmap colormap=cv2.COLORMAP_INFERNO

# Heatmaps + object counting
yolo solutions heatmap region="[(20, 400), (1080, 400), (1080, 360), (20, 360)]"
Link to this sectionHeatmap() Arguments#
Here's a table with the Heatmap arguments:
| Argument | Type | Default | Description |
|---|---|---|---|
model | str | None | Path to an Ultralytics YOLO model file. |
colormap | int | cv2.COLORMAP_DEEPGREEN | Colormap to use for the heatmap. |
show_in | bool | True | Flag to control whether to display the in counts on the video stream. |
show_out | bool | True | Flag to control whether to display the out counts on the video stream. |
region | list or dict | None | Points defining the region of interest, either a list of (x, y) tuples or a dictionary mapping region names to point lists for multiple regions (RegionCounter only). When None, solutions that require a region fall back to a predefined default. |
You can also apply different track arguments in the Heatmap solution.
| Argument | Type | Default | Description |
|---|---|---|---|
tracker | str | 'tracktrack.yaml' | Specifies the tracking algorithm to use. Built-in options: botsort.yaml, bytetrack.yaml, ocsort.yaml, deepocsort.yaml, fasttrack.yaml, tracktrack.yaml. |
conf | float | 0.1 | Sets the confidence threshold for detections; lower values allow more objects to be tracked but may include false positives. |
iou | float | 0.7 | Sets the Intersection over Union (IoU) threshold for filtering overlapping detections. |
classes | list | None | Filters results by class index. For example, classes=[0, 2, 3] only tracks the specified classes. |
verbose | bool | True | Controls the display of tracking results, providing a visual output of tracked objects. |
device | str | None | Specifies the device for inference (e.g., cpu, cuda:0 or 0). Allows users to select between CPU, a specific GPU, or other compute devices for model execution. |
Additionally, the supported visualization arguments are listed below:
| Argument | Type | Default | Description |
|---|---|---|---|
show | bool | False | If True, displays the annotated images or videos in a window. Useful for immediate visual feedback during development or testing. |
line_width | int or None | None | Specifies the line width of bounding boxes. If None, the line width is automatically adjusted based on the image size. Provides visual customization for clarity. |
show_conf | bool | True | Displays the confidence score for each detection alongside the label. Gives insight into the model's certainty for each detection. |
show_labels | bool | True | Displays labels for each detection in the visual output. Provides immediate understanding of detected objects. |
Link to this sectionHeatmap Colormaps#
The colormap argument accepts any OpenCV colormap. Pass the constant from the cv2 module, for example colormap=cv2.COLORMAP_INFERNO:
| Colormap Name | Description |
|---|---|
cv2.COLORMAP_AUTUMN | Autumn color map |
cv2.COLORMAP_BONE | Bone color map |
cv2.COLORMAP_JET | Jet color map |
cv2.COLORMAP_WINTER | Winter color map |
cv2.COLORMAP_RAINBOW | Rainbow color map |
cv2.COLORMAP_OCEAN | Ocean color map |
cv2.COLORMAP_SUMMER | Summer color map |
cv2.COLORMAP_SPRING | Spring color map |
cv2.COLORMAP_COOL | Cool color map |
cv2.COLORMAP_HSV | HSV (Hue, Saturation, Value) color map |
cv2.COLORMAP_PINK | Pink color map |
cv2.COLORMAP_HOT | Hot color map |
cv2.COLORMAP_PARULA | Parula color map |
cv2.COLORMAP_MAGMA | Magma color map |
cv2.COLORMAP_INFERNO | Inferno color map |
cv2.COLORMAP_PLASMA | Plasma color map |
cv2.COLORMAP_VIRIDIS | Viridis color map |
cv2.COLORMAP_CIVIDIS | Cividis color map |
cv2.COLORMAP_TWILIGHT | Twilight color map |
cv2.COLORMAP_TWILIGHT_SHIFTED | Shifted Twilight color map |
cv2.COLORMAP_TURBO | Turbo color map |
cv2.COLORMAP_DEEPGREEN | Deep Green color map |
Link to this sectionHow Heatmaps Work#
The Heatmap solution extends the ObjectCounter class. On the first processed frame it creates a blank intensity layer matching the frame size. Each frame is then processed in two steps:
- YOLO26 tracking detects and follows every object in the frame
- For each tracked object, the heatmap intensity increases within a circular region centered in its bounding box
Once per frame, the accumulated intensity layer is normalized, colorized with the selected colormap, and blended with the original frame. The overlay appears as soon as at least one object is tracked; frames without tracked objects are shown without the heatmap overlay.
The result is a dynamic visualization that builds up over time, revealing traffic patterns, crowd movements, or other spatial behaviors in your video data. When a region is set, the solution also counts objects entering and exiting that region while the heatmap builds.
Link to this sectionConclusion#
The Ultralytics YOLO26 Heatmap solution turns object tracking results into an intuitive activity overlay with a few lines of code. To go further, combine it with object counting, explore the other Ultralytics Solutions, or read about the underlying tracking mode.
Link to this sectionFAQ#
Link to this sectionHow does Ultralytics YOLO26 generate heatmaps from a video?#
Ultralytics YOLO26 generates heatmaps by tracking objects across video frames and accumulating an intensity value at each tracked object's location, then colorizing the result and blending it with the original frame. Areas where objects appear frequently or linger build up higher intensity and render in warmer colors. For configuration options, refer to the Heatmap() Arguments section.
Link to this sectionHow do I save the heatmap output to a video file?#
Use OpenCV's cv2.VideoWriter and write results.plot_im for every processed frame, as shown in the main example. The plot_im attribute holds the frame with the heatmap overlay already applied.
Link to this sectionCan I combine heatmaps with object counting?#
Yes. Pass a region argument to Heatmap() with line, rectangle, or polygon points, and the solution counts objects entering and exiting that region while the heatmap builds. The returned results include in_count, out_count, and per-class counts. See the object counting guide for region configuration details.
Link to this sectionHow can I visualize only specific object classes in heatmaps using Ultralytics YOLO26?#
Pass the classes argument to Heatmap() with the class indices you want to keep. For example, classes=[0, 2] builds the heatmap only from persons and cars (COCO class indices 0 and 2):
import cv2

from ultralytics import solutions

cap = cv2.VideoCapture("path/to/video.mp4")
heatmap = solutions.Heatmap(show=True, model="yolo26n.pt", classes=[0, 2])

while cap.isOpened():
    success, im0 = cap.read()
    if not success:
        break
    results = heatmap(im0)
cap.release()
cv2.destroyAllWindows()
Link to this sectionWhat makes Ultralytics YOLO26 heatmaps different from other data visualization tools like those from OpenCV or Matplotlib?#
Ultralytics YOLO26 heatmaps integrate object detection, tracking, intensity accumulation, and overlay rendering into a single call, while generic tools like OpenCV or Matplotlib require you to build that pipeline yourself. The solution processes video streams in real time and supports persistent tracking and customizable colormaps out of the box. For details on the underlying model, see the YOLO26 model page.