Ultralytics를 사용한 K-Fold 교차 검증
소개
이 포괄적인 가이드는 Ultralytics 생태계 내에서 객체 detect 데이터셋에 대한 K-겹 교차 검증 구현을 설명합니다. 저희는 YOLO detect 형식과 sklearn, Pandas, PyYAML과 같은 주요 Python 라이브러리를 활용하여 필요한 설정, 특징 벡터 생성 프로세스, 그리고 K-겹 데이터셋 분할 실행 과정을 안내할 것입니다.
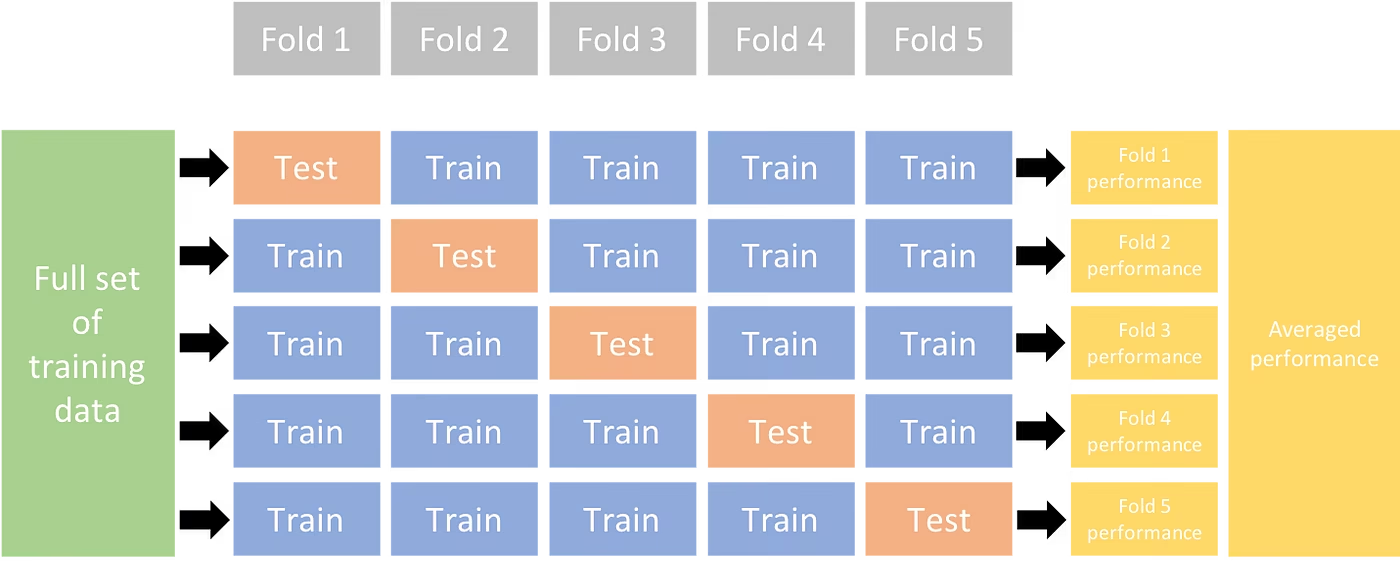
프로젝트에 Fruit Detection 데이터 세트가 포함되든 사용자 지정 데이터 소스가 포함되든, 이 튜토리얼은 K-Fold 교차 검증을 이해하고 적용하여 신뢰성과 견고성을 강화하는 데 도움이 되는 것을 목표로 합니다. 머신 러닝 모델을 적용하는 동안 k=5 이 튜토리얼에서는 folds를 사용하지만, 최적의 folds 수는 데이터 세트와 프로젝트의 세부 사항에 따라 달라질 수 있습니다.
시작해 봅시다.
설치
주석은 YOLO 감지 형식이어야 합니다.
이 가이드에서는 어노테이션 파일을 로컬에서 사용할 수 있다고 가정합니다.
여기서는 과일 감지 데이터 세트를 사용하여 시연합니다.
- 이 데이터 세트는 총 8479개의 이미지를 포함합니다.
- 6개의 클래스 레이블을 포함하며, 각 레이블 아래에 총 인스턴스 수가 나열되어 있습니다.
| 클래스 레이블 | 인스턴스 수 |
|---|---|
| Apple | 7049 |
| 포도 | 7202 |
| 파인애플 | 1613 |
| 주황색 | 15549 |
| 바나나 | 3536 |
| 수박 | 1976 |
필수 python 패키지는 다음과 같습니다.
ultralyticssklearnpandaspyyaml
이 튜토리얼은 다음을 사용하여 작동합니다.
k=5folds를 사용합니다. 그러나 특정 데이터 세트에 가장 적합한 folds 수를 결정해야 합니다.새 python 가상 환경 시작 (
venv)을 프로젝트에 적용하고 활성화합니다. Usepip설치하려면 (또는 선호하는 패키지 관리자)를 사용하세요:- Ultralytics 라이브러리:
pip install -U ultralytics. 또는 공식 버전을 복제할 수 있습니다. repo. - Scikit-learn, pandas, 그리고 PyYAML:
pip install -U scikit-learn pandas pyyaml.
- Ultralytics 라이브러리:
annotation이 YOLO detection format에 있는지 확인하십시오.
- 이 튜토리얼에서는 모든 주석 파일이 다음 위치에 있습니다.
Fruit-Detection/labels디렉터리.
- 이 튜토리얼에서는 모든 주석 파일이 다음 위치에 있습니다.
객체 감지 데이터 세트에 대한 특징 벡터 생성
새로 만들어서 시작하세요.
example.py아래 단계를 위한 Python 파일입니다.데이터 세트에 대한 모든 레이블 파일을 검색합니다.
from pathlib import Path

dataset_path = Path("./Fruit-detection")  # replace with 'path/to/dataset' for your custom data
labels = sorted(dataset_path.rglob("*labels/*.txt"))  # all data in 'labels'
이제 데이터 세트 YAML 파일의 내용을 읽고 클래스 레이블의 인덱스를 추출합니다.
import yaml

yaml_file = "path/to/data.yaml"  # your data YAML with data directories and names dictionary
with open(yaml_file, encoding="utf8") as y:
    classes = yaml.safe_load(y)["names"]
cls_idx = sorted(classes.keys())
빈 값 초기화
pandasDataFrame.import pandas as pd index = [label.stem for label in labels] # uses base filename as ID (no extension) labels_df = pd.DataFrame([], columns=cls_idx, index=index)annotation 파일에 있는 각 클래스 레이블의 인스턴스 수를 계산합니다.
from collections import Counter

for label in labels:
    lbl_counter = Counter()

    with open(label) as lf:
        lines = lf.readlines()

    for line in lines:
        # classes for YOLO label uses integer at first position of each line
        lbl_counter[int(line.split(" ", 1)[0])] += 1

    labels_df.loc[label.stem] = lbl_counter

labels_df = labels_df.fillna(0.0)  # replace `nan` values with `0.0`
다음은 채워진 DataFrame의 샘플 보기입니다.
                                                       0    1    2    3    4    5
'0000a16e4b057580_jpg.rf.00ab48988370f64f5ca8ea4...'  0.0  0.0  0.0  0.0  0.0  7.0
'0000a16e4b057580_jpg.rf.7e6dce029fb67f01eb19aa7...'  0.0  0.0  0.0  0.0  0.0  7.0
'0000a16e4b057580_jpg.rf.bc4d31cdcbe229dd022957a...'  0.0  0.0  0.0  0.0  0.0  7.0
'00020ebf74c4881c_jpg.rf.508192a0a97aa6c4a3b6882...'  0.0  0.0  0.0  1.0  0.0  0.0
'00020ebf74c4881c_jpg.rf.5af192a2254c8ecc4188a25...'  0.0  0.0  0.0  1.0  0.0  0.0
 ...                                                  ...  ...  ...  ...  ...  ...
'ff4cd45896de38be_jpg.rf.c4b5e967ca10c7ced3b9e97...'  0.0  0.0  0.0  0.0  0.0  2.0
'ff4cd45896de38be_jpg.rf.ea4c1d37d2884b3e3cbce08...'  0.0  0.0  0.0  0.0  0.0  2.0
'ff5fd9c3c624b7dc_jpg.rf.bb519feaa36fc4bf630a033...'  1.0  0.0  0.0  0.0  0.0  0.0
'ff5fd9c3c624b7dc_jpg.rf.f0751c9c3aa4519ea3c9d6a...'  1.0  0.0  0.0  0.0  0.0  0.0
'fffe28b31f2a70d4_jpg.rf.7ea16bd637ba0711c53b540...'  0.0  6.0  0.0  0.0  0.0  0.0
행은 레이블 파일을 인덱싱하며, 각 레이블 파일은 데이터 세트의 이미지에 해당하고, 열은 클래스 레이블 인덱스에 해당합니다. 각 행은 의사 특징 벡터를 나타내며, 데이터 세트에 있는 각 클래스 레이블의 개수를 나타냅니다. 이 데이터 구조를 통해 객체 감지 데이터 세트에 K-Fold 교차 검증을 적용할 수 있습니다.
K-Fold 데이터 세트 분할
이제 다음을 사용합니다.
KFold클래스 위치sklearn.model_selection생성하려면k데이터 세트 분할.- 중요:
- 설정
shuffle=True분할에서 클래스의 무작위 분포를 보장합니다. - 설정하면
random_state=M여기서M선택된 정수이며, 반복 가능한 결과를 얻을 수 있습니다.
- 설정
import random from sklearn.model_selection import KFold random.seed(0) # for reproducibility ksplit = 5 kf = KFold(n_splits=ksplit, shuffle=True, random_state=20) # setting random_state for repeatable results kfolds = list(kf.split(labels_df))- 중요:
이제 데이터 세트가 다음과 같이 분할되었습니다.
kfolds는 각각 목록을 가집니다.train및val인덱스. 이러한 결과를 더 명확하게 표시하기 위해 DataFrame을 구성합니다.folds = [f"split_{n}" for n in range(1, ksplit + 1)] folds_df = pd.DataFrame(index=index, columns=folds) for i, (train, val) in enumerate(kfolds, start=1): folds_df[f"split_{i}"].loc[labels_df.iloc[train].index] = "train" folds_df[f"split_{i}"].loc[labels_df.iloc[val].index] = "val"이제 각 폴드에 대한 클래스 레이블의 분포를 존재하는 클래스의 비율로 계산합니다.
val현재 위치에 있는 사람들에게train.fold_lbl_distrb = pd.DataFrame(index=folds, columns=cls_idx) for n, (train_indices, val_indices) in enumerate(kfolds, start=1): train_totals = labels_df.iloc[train_indices].sum() val_totals = labels_df.iloc[val_indices].sum() # To avoid division by zero, we add a small value (1E-7) to the denominator ratio = val_totals / (train_totals + 1e-7) fold_lbl_distrb.loc[f"split_{n}"] = ratio이상적인 시나리오는 모든 클래스 비율이 각 분할 및 클래스에서 상당히 유사한 것입니다. 그러나 이는 데이터 세트의 특정 사항에 따라 달라집니다.
다음으로, 각 분할에 대한 디렉토리 및 데이터 세트 YAML 파일을 만듭니다.
import datetime

supported_extensions = [".jpg", ".jpeg", ".png"]

# Initialize an empty list to store image file paths
images = []

# Loop through supported extensions and gather image files
for ext in supported_extensions:
    images.extend(sorted((dataset_path / "images").rglob(f"*{ext}")))

# Create the necessary directories and dataset YAML files
save_path = Path(dataset_path / f"{datetime.date.today().isoformat()}_{ksplit}-Fold_Cross-val")
save_path.mkdir(parents=True, exist_ok=True)
ds_yamls = []

for split in folds_df.columns:
    # Create directories
    split_dir = save_path / split
    split_dir.mkdir(parents=True, exist_ok=True)
    (split_dir / "train" / "images").mkdir(parents=True, exist_ok=True)
    (split_dir / "train" / "labels").mkdir(parents=True, exist_ok=True)
    (split_dir / "val" / "images").mkdir(parents=True, exist_ok=True)
    (split_dir / "val" / "labels").mkdir(parents=True, exist_ok=True)

    # Create dataset YAML files
    dataset_yaml = split_dir / f"{split}_dataset.yaml"
    ds_yamls.append(dataset_yaml)

    with open(dataset_yaml, "w") as ds_y:
        yaml.safe_dump(
            {
                "path": split_dir.as_posix(),
                "train": "train",
                "val": "val",
                "names": classes,
            },
            ds_y,
        )
마지막으로, 각 분할에 대해 이미지와 라벨을 해당 디렉토리('train' 또는 'val')에 복사합니다.
- 참고: 코드의 이 부분에 필요한 시간은 데이터 세트 크기와 시스템 하드웨어에 따라 다릅니다.
import shutil

from tqdm import tqdm

for image, label in tqdm(zip(images, labels), total=len(images), desc="Copying files"):
    for split, k_split in folds_df.loc[image.stem].items():
        # Destination directory
        img_to_path = save_path / split / k_split / "images"
        lbl_to_path = save_path / split / k_split / "labels"

        # Copy image and label files to new directory (SamefileError if file already exists)
        shutil.copy(image, img_to_path / image.name)
        shutil.copy(label, lbl_to_path / label.name)
레코드 저장 (선택 사항)
선택적으로 K-Fold 분할 및 레이블 분포 DataFrames의 기록을 CSV 파일로 저장하여 나중에 참조할 수 있습니다.
folds_df.to_csv(save_path / "kfold_datasplit.csv")
fold_lbl_distrb.to_csv(save_path / "kfold_label_distribution.csv")
K-Fold 데이터 분할을 사용하여 YOLO 학습
먼저, YOLO 모델을 로드합니다.
from ultralytics import YOLO

weights_path = "path/to/weights.pt"  # use yolo26n.pt for a small model
model = YOLO(weights_path, task="detect")
다음으로, 데이터 세트 YAML 파일을 반복하여 훈련을 실행합니다. 결과는 다음에서 지정한 디렉터리에 저장됩니다.
project및name인수입니다. 기본적으로 이 디렉토리는 '#'이 정수 인덱스인 'runs/detect/train#'입니다.results = {} # Define your additional arguments here batch = 16 project = "kfold_demo" epochs = 100 for k, dataset_yaml in enumerate(ds_yamls): model = YOLO(weights_path, task="detect") results[k] = model.train( data=dataset_yaml, epochs=epochs, batch=batch, project=project, name=f"fold_{k + 1}" ) # include any additional train argumentsUltralytics data.utils.autosplit 함수를 사용하여 데이터세트를 자동으로 분할할 수도 있습니다.
from ultralytics.data.split import autosplit

# Automatically split dataset into train/val/test
autosplit(path="path/to/images", weights=(0.8, 0.2, 0.0), annotated_only=True)
결론
이 가이드에서는 YOLO 객체 감지 모델을 훈련하기 위해 K-Fold 교차 검증을 사용하는 프로세스를 살펴보았습니다. 데이터 세트를 K개의 파티션으로 분할하여 다양한 폴드에서 균형 잡힌 클래스 분포를 보장하는 방법을 배웠습니다.
또한 보고서 데이터프레임을 생성하여 데이터 분할과 이러한 분할 전체의 레이블 분포를 시각화하는 절차를 탐색하여 훈련 및 검증 세트의 구조에 대한 명확한 통찰력을 제공했습니다.
선택적으로 향후 참조를 위해 기록을 저장했는데, 이는 대규모 프로젝트나 모델 성능 문제를 해결할 때 특히 유용할 수 있습니다.
마지막으로, 루프에서 각 분할을 사용하여 실제 모델 학습을 구현하고 추가 분석 및 비교를 위해 학습 결과를 저장했습니다.
K-Fold 교차 검증 기술은 사용 가능한 데이터를 최대한 활용하는 강력한 방법이며, 모델 성능이 다양한 데이터 하위 집합에서 안정적이고 일관되도록 보장하는 데 도움이 됩니다. 이는 특정 데이터 패턴에 과적합될 가능성이 적은 보다 일반화되고 신뢰할 수 있는 모델을 만듭니다.
이 가이드에서 YOLO를 사용했지만, 이 단계들은 대부분 다른 머신러닝 모델에도 적용 가능합니다. 이 단계들을 이해하면 자신의 머신러닝 프로젝트에서 교차 검증을 효과적으로 적용할 수 있습니다.
FAQ
K-Fold 교차 검증이란 무엇이며 객체 감지에서 왜 유용합니까?
K-Fold 교차 검증은 모델 성능을 보다 안정적으로 평가하기 위해 데이터 세트를 'k'개의 하위 집합(폴드)으로 나누는 기술입니다. 각 폴드는 학습 및 검증 데이터로 사용됩니다. 객체 감지에서 K-Fold 교차 검증을 사용하면 Ultralytics YOLO 모델의 성능이 다양한 데이터 분할에서 강력하고 일반화될 수 있도록 보장하여 신뢰성을 향상시키는 데 도움이 됩니다. Ultralytics YOLO를 사용하여 K-Fold 교차 검증을 설정하는 방법에 대한 자세한 지침은 Ultralytics를 사용한 K-Fold 교차 검증을 참조하십시오.
Ultralytics YOLO를 사용하여 K-Fold 교차 검증을 어떻게 구현합니까?
Ultralytics YOLO를 사용하여 K-Fold 교차 검증을 구현하려면 다음 단계를 수행해야 합니다.
- annotation이 YOLO detection format에 있는지 확인하십시오.
- 다음과 같은 python 라이브러리 사용
sklearn,pandas및pyyaml. - 데이터 세트에서 특징 벡터를 생성합니다.
- 다음을 사용하여 데이터 세트 분할
KFold다음에서sklearn.model_selection. - 각 분할에서 YOLO 모델을 학습합니다.
자세한 가이드는 문서의 K-Fold 데이터 세트 분할 섹션을 참조하세요.
객체 감지에 Ultralytics YOLO를 사용해야 하는 이유는 무엇인가요?
Ultralytics YOLO는 높은 정확도와 효율성을 갖춘 최첨단 실시간 객체 detect 기능을 제공합니다. 이는 detect, segment, 분류와 같은 여러 컴퓨터 비전 작업을 지원하는 다재다능한 도구입니다. 또한, 노코드 모델 훈련 및 배포를 위해 Ultralytics Platform과 같은 도구와 원활하게 통합됩니다. 더 자세한 내용은 저희 Ultralytics YOLO 페이지에서 이점과 기능을 살펴보세요.
Ultralytics YOLO에 맞는 올바른 형식으로 주석을 어떻게 만들 수 있습니까?
annotation은 YOLO detection 형식을 따라야 합니다. 각 annotation 파일은 객체 클래스와 이미지 내 bounding box 좌표를 함께 나열해야 합니다. YOLO 형식은 객체 감지 모델 훈련을 위한 효율적이고 표준화된 데이터 처리를 보장합니다. 올바른 annotation 형식에 대한 자세한 내용은 YOLO detection 형식 가이드를 참조하십시오.
Fruit Detection 이외의 사용자 정의 데이터 세트로 K-Fold 교차 검증을 사용할 수 있습니까?
예, 어노테이션이 YOLO 감지 형식인 한 모든 사용자 정의 데이터 세트에서 K-Fold 교차 검증을 사용할 수 있습니다. 데이터 세트 경로와 클래스 레이블을 사용자 정의 데이터 세트에 해당하는 것으로 바꿉니다. 이러한 유연성을 통해 모든 객체 감지 프로젝트가 K-Fold 교차 검증을 사용하여 강력한 모델 평가의 이점을 누릴 수 있습니다. 실제 예제는 기능 벡터 생성 섹션을 검토하십시오.


