Mapas de calor de rastreamento de objetos com Ultralytics YOLO26

A solução de mapa de calor do Ultralytics YOLO26 rastreia objetos entre quadros de vídeo e sobrepõe a intensidade acumulada do movimento em cada quadro. Assim, as áreas movimentadas brilham em cores quentes, enquanto as áreas tranquilas permanecem em tons frios. Desenvolvida com base no rastreamento de objetos do YOLO26, ela transforma qualquer vídeo em um mapa de atividade espacial que revela o fluxo de tráfego, a movimentação de multidões e as áreas de permanência com uma única chamada de Python ou comando da CLI.
Assista: Como criar mapas de calor com Ultralytics YOLO26 | Visualize a atividade de objetos | VisionAI no varejo 🚀
Por que usar mapas de calor para análise de vídeo?#
- Identifique padrões de atividade rapidamente: a intensidade se acumula onde os objetos rastreados permanecem, destacando faixas de tráfego intenso, prateleiras populares ou gargalos de multidões sem precisar revisar manualmente cada quadro.
- Rastreamento integrado: a solução executa internamente a detecção e o rastreamento do YOLO26, sem precisar configurar um pipeline de rastreamento separado.
- Contagem na mesma execução: passe um
regionpara contar os objetos que entram e saem de uma zona enquanto o mapa de calor é gerado, combinando duas tarefas de análise em uma execução.
Aplicações no mundo real#
| Transportes | Retalho |
|---|---|
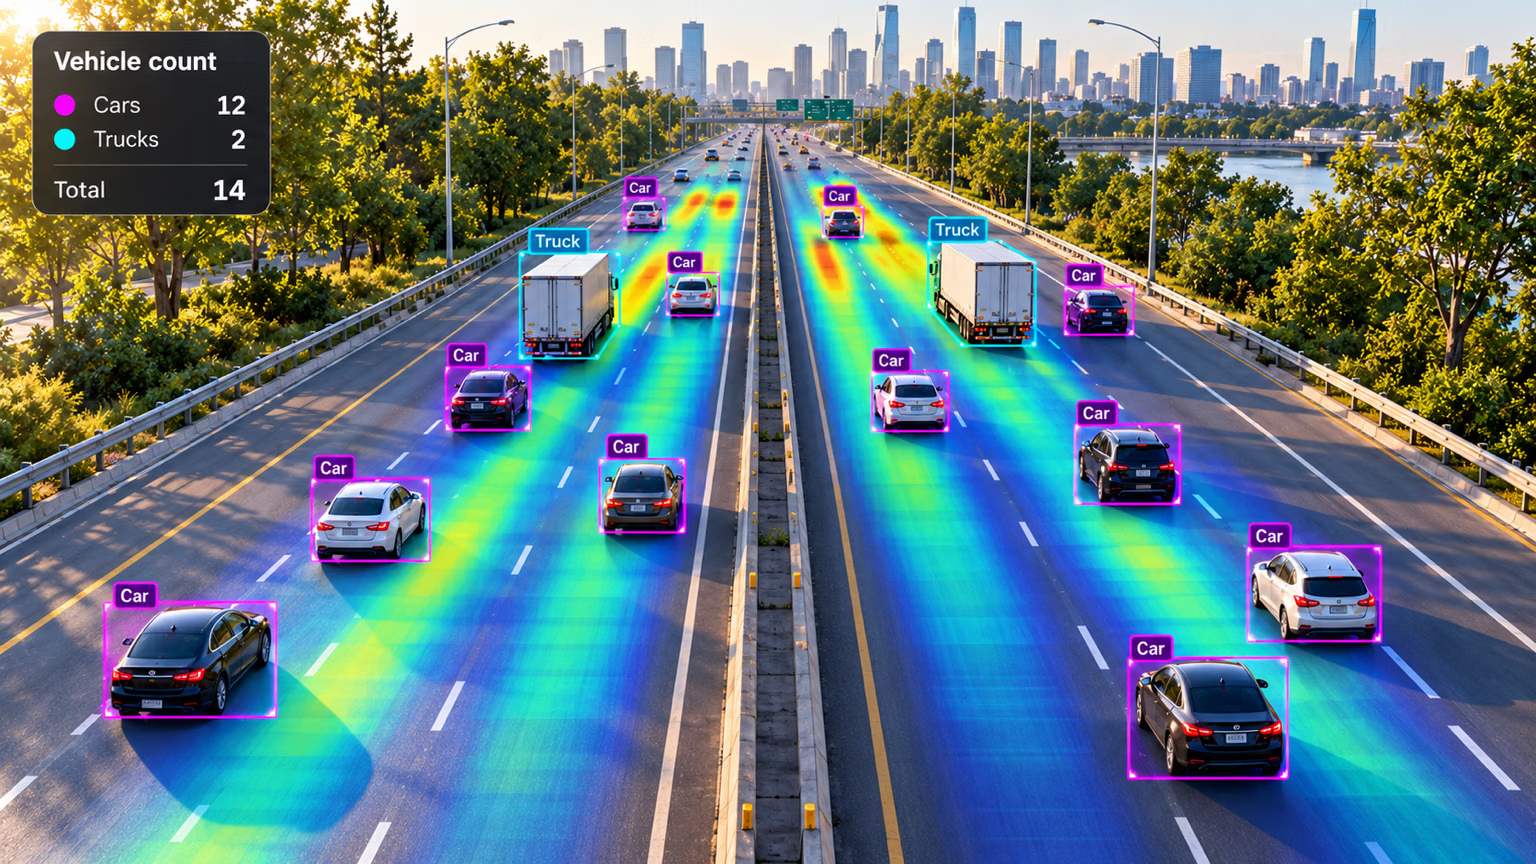 | 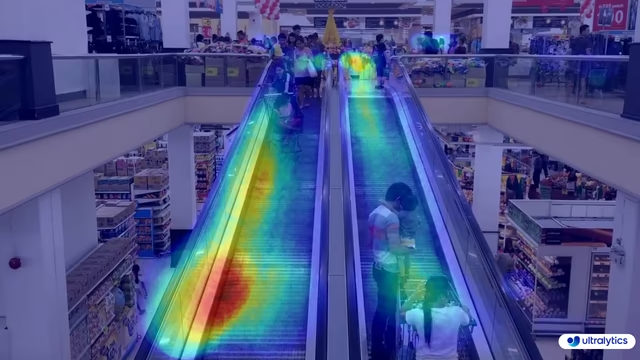 |
| Mapa de calor de transportes do Ultralytics YOLO | Mapa de calor do varejo do Ultralytics YOLO |
Como gerar mapas de calor com Ultralytics YOLO#
Execute a solução de mapa de calor em uma fonte de vídeo pela CLI ou pelo Python. O exemplo em Python grava os quadros processados em um arquivo de vídeo de saída:
# Run a heatmap example
yolo solutions heatmap show=True

# Pass a source video
yolo solutions heatmap source="path/to/video.mp4"

# Pass a custom colormap
yolo solutions heatmap colormap=cv2.COLORMAP_INFERNO

# Heatmaps + object counting
yolo solutions heatmap region="[(20, 400), (1080, 400), (1080, 360), (20, 360)]"
Argumentos de Heatmap()#
Aqui está uma tabela com os argumentos de Heatmap:
| Argumento | Tipo | Padrão | Descrição |
|---|---|---|---|
model | str | None | Caminho para um arquivo de modelo Ultralytics YOLO. |
colormap | int | cv2.COLORMAP_DEEPGREEN | Mapa de cores a usar no mapa de calor. |
show_in | bool | True | Flag que controla se as contagens de entrada são exibidas no fluxo de vídeo. |
show_out | bool | True | Flag que controla se as contagens de saída são exibidas no fluxo de vídeo. |
region | list ou dict | None | Pontos que definem a região de interesse, seja como uma lista de tuplas (x, y) ou como um dicionário que associa nomes de regiões a listas de pontos para várias regiões (somente RegionCounter). Quando None, as soluções que exigem uma região usam uma região padrão predefinida. |
line_width | int | 2 | Espessura das linhas das caixas, dos pontos-chave e das contagens desenhados pela solução. |
verbose | bool | True | Ativa o registro por quadro da solução, com o formato da entrada, as contagens por classe e a velocidade de processamento. A chamada de rastreamento em si é sempre silenciosa. |
Você também pode aplicar diferentes argumentos de track na solução Heatmap.
| Argumento | Tipo | Padrão | Descrição |
|---|---|---|---|
tracker | str | 'tracktrack.yaml' | Especifica o algoritmo de rastreamento a utilizar. Opções integradas: botsort.yaml, bytetrack.yaml, ocsort.yaml, deepocsort.yaml, fasttrack.yaml, tracktrack.yaml. |
conf | float | 0.25 | Define o limiar de confiança das deteções; valores mais baixos permitem rastrear mais objetos, mas podem incluir falsos positivos. |
iou | float | 0.5 | Define o limiar de interseção sobre união (IoU) para filtrar deteções sobrepostas. |
classes | list | None | Filtra os resultados pelo índice da classe. Por exemplo, classes=[0, 2, 3] rastreia apenas as classes especificadas. |
device | str | None | Especifica o dispositivo para a inferência (por exemplo, cpu, cuda:0 ou 0). Permite escolher entre CPU, uma GPU específica ou outros dispositivos de computação para executar o modelo. |
imgsz | int or tuple | 640 | Tamanho da imagem de destino para a inferência: um número inteiro para uma imagem quadrada ou um par (height, width). As dimensões são ajustadas ao stride do modelo. |
max_det | int | 300 | Número máximo de deteções mantidas por fotograma antes do rastreamento, limitando os objetos que uma solução processa em cenas densas. |
quantize | int or str | None | Precisão de inferência: 16 (FP16) ou 32/unset (FP32) para modelos PyTorch e TorchScript fora da CPU; os outros formatos usam a precisão selecionada pelo artefato e pelo ambiente de execução. Substitui o argumento obsoleto half. |
Além disso, os argumentos de visualização compatíveis estão listados abaixo:
| Argumento | Tipo | Padrão | Descrição |
|---|---|---|---|
show | bool | False | Se True, exibe as imagens ou os vídeos anotados em uma janela. Útil para obter feedback visual imediato durante o desenvolvimento ou os testes. |
show_conf | bool | True | Exibe a pontuação de confiança de cada detecção junto ao rótulo. Mostra o grau de certeza do modelo em cada detecção. |
show_labels | bool | True | Exibe os rótulos de cada detecção na saída visual. Permite identificar imediatamente os objetos detectados. |
Mapas de cores para mapas de calor#
O argumento colormap aceita qualquer mapa de cores do OpenCV. Passe a constante do módulo cv2, por exemplo, colormap=cv2.COLORMAP_INFERNO:
| Nome do mapa de cores | Descrição |
|---|---|
cv2.COLORMAP_AUTUMN | Mapa de cores outonal |
cv2.COLORMAP_BONE | Mapa de cores ósseo |
cv2.COLORMAP_JET | Mapa de cores Jet |
cv2.COLORMAP_WINTER | Mapa de cores Winter |
cv2.COLORMAP_RAINBOW | Mapa de cores Rainbow |
cv2.COLORMAP_OCEAN | Mapa de cores Ocean |
cv2.COLORMAP_SUMMER | Mapa de cores Summer |
cv2.COLORMAP_SPRING | Mapa de cores Spring |
cv2.COLORMAP_COOL | Mapa de cores Cool |
cv2.COLORMAP_HSV | Mapa de cores HSV (matiz, saturação, valor) |
cv2.COLORMAP_PINK | Mapa de cores Pink |
cv2.COLORMAP_HOT | Mapa de cores Hot |
cv2.COLORMAP_PARULA | Mapa de cores Parula |
cv2.COLORMAP_MAGMA | Mapa de cores Magma |
cv2.COLORMAP_INFERNO | Mapa de cores Inferno |
cv2.COLORMAP_PLASMA | Mapa de cores Plasma |
cv2.COLORMAP_VIRIDIS | Mapa de cores Viridis |
cv2.COLORMAP_CIVIDIS | Mapa de cores Cividis |
cv2.COLORMAP_TWILIGHT | Mapa de cores Twilight |
cv2.COLORMAP_TWILIGHT_SHIFTED | Mapa de cores Twilight deslocado |
cv2.COLORMAP_TURBO | Mapa de cores Turbo |
cv2.COLORMAP_DEEPGREEN | Mapa de cores Deep Green |
Como os mapas de calor funcionam#
A solução Heatmap estende a classe ObjectCounter. No primeiro quadro processado, ela cria uma camada de intensidade em branco com o mesmo tamanho do quadro. Em seguida, cada quadro é processado em duas etapas:
- O rastreamento do YOLO26 detecta e acompanha cada objeto no quadro
- Para cada objeto rastreado, a intensidade do mapa de calor aumenta em uma região circular centralizada na caixa delimitadora do objeto
Uma vez por quadro, a camada de intensidade acumulada é normalizada, colorida com o mapa de cores selecionado e mesclada com o quadro original. A sobreposição aparece assim que pelo menos um objeto é rastreado; até lá, os quadros são exibidos sem a sobreposição do mapa de calor.
O resultado é uma visualização dinâmica que se desenvolve ao longo do tempo, revelando padrões de tráfego, movimentação de multidões ou outros comportamentos espaciais nos dados de vídeo. Quando uma region é definida, a solução também conta objetos que entram e saem dessa região enquanto o mapa de calor se desenvolve.
Conclusão#
A solução Heatmap do Ultralytics YOLO26 transforma os resultados do rastreamento de objetos em uma sobreposição intuitiva de atividade com poucas linhas de código. Para ir além, combine-a com a contagem de objetos, explore as outras soluções da Ultralytics ou leia sobre o modo de rastreamento subjacente.
Perguntas frequentes#
O Ultralytics YOLO26 gera mapas de calor rastreando objetos entre os quadros do vídeo e acumulando um valor de intensidade na localização de cada objeto rastreado. Em seguida, colore o resultado e o mescla com o quadro original. As áreas onde os objetos aparecem com frequência ou permanecem por mais tempo acumulam maior intensidade e são exibidas em cores mais quentes. Para ver as opções de configuração, consulte a seção Argumentos de
Heatmap().Use
cv2.VideoWriterdo OpenCV e graveresults.plot_impara cada quadro processado, conforme mostrado no exemplo principal. O atributoplot_imcontém o quadro com a sobreposição do mapa de calor já aplicada.Sim. Passe um argumento
regionparaHeatmap()com pontos de linha, retângulo ou polígono, e a solução contará os objetos que entram e saem dessa região enquanto o mapa de calor se desenvolve. Os resultados retornados incluemin_count,out_counte contagens por classe. Consulte o guia de contagem de objetos para ver os detalhes de configuração da região.Passe o argumento
classesparaHeatmap()com os índices das classes que você quer manter. Por exemplo,classes=[0, 2]gera o mapa de calor apenas com pessoas e carros (índices 0 e 2 das classes do COCO):import cv2 from ultralytics import solutions cap = cv2.VideoCapture("path/to/video.mp4") heatmap = solutions.Heatmap(show=True, model="yolo26n.pt", classes=[0, 2]) while cap.isOpened(): success, im0 = cap.read() if not success: break results = heatmap(im0) cap.release() cv2.destroyAllWindows()Os mapas de calor do Ultralytics YOLO26 integram detecção de objetos, rastreamento, acúmulo de intensidade e renderização de sobreposição em uma única chamada, enquanto ferramentas genéricas como OpenCV ou Matplotlib exigem que você crie esse fluxo de processamento. A solução processa fluxos de vídeo em tempo real e oferece rastreamento persistente e mapas de cores personalizáveis prontos para uso.


Comentários65
Faz uma pergunta, partilha os teus resultados ou ajuda alguém.
RizwanMunawar
🎉 Big News Alert! 🚀 Ultralytics Solutions CLI is here from ultralytics>=8.3.28! Now, you can easily harness the power of advanced YOLO solutions straight from the command line. Simplify your workflow, and streamline object detection, tracking, counting, and more—all with just a few commands! Get ready to experience a whole new level of efficiency! 💥
CLI Usage Overview
yolo SOLUTIONS SOLUTION_NAME ARGS- SOLUTIONS is a mandatory keyword.
- SOLUTION_NAME (optional): Choose from ['count', 'heatmap', 'queue', 'speed', 'workout', 'analytics'].
- ARGS (optional): Use custom
arg=valuepairs, likeshow_in=True, to customize settings.
Examples
yolo solutions heatmap show=True  # For object counting

yolo solutions heatmap source="path/to/video/file.mp4"  # Specify a video file path
Start exploring now and let Ultralytics Solutions CLI power up your projects!
4Arjunpixel28
Has any one applied heatmap on instance segmentation ?
2 Glenn JocherUltralytics(editado)
Yes, applying heatmaps to instance segmentation is feasible and offers a vivid way to visualize the density and distribution of detected objects across video frames 🌈. The
Heatmapsolution runs tracking itself with whatever model you give it, including a segmentation model, and accumulates intensity around each tracked object's bounding box (the masks themselves are not used). Here's a simplified example:import cv2 from ultralytics import solutions cap = cv2.VideoCapture("path/to/video.mp4") assert cap.isOpened(), "Failed to open video file or stream!" w, h, fps = (int(cap.get(x)) for x in (cv2.CAP_PROP_FRAME_WIDTH, cv2.CAP_PROP_FRAME_HEIGHT, cv2.CAP_PROP_FPS)) video_writer = cv2.VideoWriter("heatmap_output.avi", cv2.VideoWriter_fourcc(*"mp4v"), fps, (w, h)) # Initialize your heatmap object with a segmentation model heatmap = solutions.Heatmap(show=True, model="yolo26n-seg.pt", colormap=cv2.COLORMAP_PARULA) # Process video frames while cap.isOpened(): success, frame = cap.read() if not success: break # Exit loop if no more frames results = heatmap(frame) video_writer.write(results.plot_im) cap.release() video_writer.release() cv2.destroyAllWindows()This snippet performs tracking with an instance segmentation model on video frames and overlays the accumulated heatmap. Remember, the success of applying heatmaps heavily relies on the quality of your model, so ensure it has been adequately trained or fine-tuned for your instance segmentation task. Happy visualizing! 🚀
 Paula DerrengerUltralytics(editado)
Yes, applying heatmaps to instance segmentation is feasible and offers a vivid way to visualize the density and distribution of detected objects across video frames 🌈. The
Heatmapsolution tracks objects with the model you provide, including a segmentation model, and overlays the accumulated activity on each frame. It builds the heatmap from the tracked objects' bounding boxes rather than the masks.Here's a simplified example:
import cv2

from ultralytics import solutions

# Initialize video capture
cap = cv2.VideoCapture("path/to/your/video.mp4")
assert cap.isOpened(), "Error reading video file"

# Video writer setup
w, h, fps = (int(cap.get(x)) for x in (cv2.CAP_PROP_FRAME_WIDTH, cv2.CAP_PROP_FRAME_HEIGHT, cv2.CAP_PROP_FPS))
video_writer = cv2.VideoWriter("segmentation_heatmap.avi", cv2.VideoWriter_fourcc(*"mp4v"), fps, (w, h))

# Initialize heatmap with a segmentation model
heatmap = solutions.Heatmap(show=True, model="yolo26n-seg.pt", colormap=cv2.COLORMAP_JET)

while cap.isOpened():
    success, im0 = cap.read()
    if not success:
        break

    # Track objects and generate the heatmap overlay
    results = heatmap(im0)

    # Write heatmap output
    video_writer.write(results.plot_im)

# Cleanup
cap.release()
video_writer.release()
cv2.destroyAllWindows()
Feel free to experiment with different configurations, such as
colormap, to meet your specific visualization needs. Happy coding! 🚀Hi ,
heatmap_obj = heatmap.Heatmap(view_img=False, imw=w, imh=h, heatmap_alpha=0.5, colormap=cv2.COLORMAP_JET)
TypeError: Heatmap.__init__() got an unexpected keyword argument 'view_img'
when i tried to run this i got this error !
- Paula DerrengerUltralytics(editado)
Hey there! 👋 It looks like you encountered an unexpected
view_imgargument error. I'm here to help!This happens because the
view_imgargument no longer exists in theHeatmapsolution; it was replaced byshow. Update your Ultralytics library and use the current arguments:heatmap = solutions.Heatmap(show=True, model="yolo26n-seg.pt", colormap=cv2.COLORMAP_JET)To update the library, run:
pip install ultralytics --upgradeThat should do the trick! Keep us posted if you run into any more issues or need further assistance. Happy coding! 🚀
I Tried upgrading the ultralytics also its giving same attribute error heatmap_obj = heatmap.Heatmap(imw=w, imh=h, heatmap_alpha=0.5, colormap=cv2.COLORMAP_JET) TypeError: Heatmap.init() got an unexpected keyword argument 'imw'
- Paula DerrengerUltralytics(editado)
@Arjunpixel28 hi there! 👋 It seems there's a mix-up with the initialization arguments for the
Heatmapclass. You don't need to specifyimwandimh, because the frame size is taken from the frames you process. In current versions, initialize it like this:heatmap = solutions.Heatmap(model="yolo26n.pt", colormap=cv2.COLORMAP_JET, show=True) results = heatmap(frame) # annotated image is in results.plot_imSee the Heatmaps guide for the full list of arguments. This setup should work without errors. Should you face any more issues or have further questions, feel free to reach out! 🚀
Hi Paula Derrenger,
in the earlier response you had only given the parameters of imw and imh and now your saying it should not be used and even now its not working still have issue with that.
heatmap_obj = heatmap.Heatmap(colormap=cv2.COLORMAP_JET, heatmap_alpha=0.5) TypeError: Heatmap.init() got an unexpected keyword argument 'colormap'
I just asked a simple thing to apply heat map on instance segmentation since so many days you guys have not sloved that
- Paula DerrengerUltralytics(editado)
@Arjunpixel28 hey there! I understand your concern and appreciate your patience. The
Heatmapsettings are now passed when you create the object (there is no separateset_args()), and the object is called directly on each frame, running tracking itself:import cv2 from ultralytics import solutions cap = cv2.VideoCapture("path/to/video.mp4") assert cap.isOpened(), "Error reading video file" # Settings such as colormap are set at initialization heatmap = solutions.Heatmap(model="yolo26n.pt", colormap=cv2.COLORMAP_PARULA) while cap.isOpened(): success, frame = cap.read() if not success: break results = heatmap(frame) cv2.imshow("Heatmap", results.plot_im) if cv2.waitKey(1) & 0xFF == ord("q"): break cap.release() cv2.destroyAllWindows()See the Heatmaps guide for all available arguments. If you encounter other issues, please let us know! 🚀
frame_with_heatmap = heatmap_obj.generate_heatmap(frame, tracks) File "/usr/local/lib/python3.10/dist-packages/ultralytics/solutions/heatmap.py", line 163, in generate_heatmap self.heatmap *= self.decay_factor # decay factor TypeError: unsupported operand type(s) for *=: 'NoneType' and 'float' and again i got this error Type error
- Paula DerrengerUltralytics(editado)
@Arjunpixel28 hey there! 👋 It looks like you're encountering a TypeError related to the initialization of the
Heatmapobject. Sorry for the confusion caused by previous responses. TheHeatmapclass lives inultralytics.solutions(it is not importable fromultralyticsdirectly), and arguments such ascolormapandshoware passed when you create it. The object is then called on each frame:import cv2 from ultralytics import solutions cap = cv2.VideoCapture("path/to/your/video.mp4") assert cap.isOpened(), "Failed to open video." heatmap = solutions.Heatmap(model="yolo26n.pt", colormap=cv2.COLORMAP_JET) while True: ret, frame = cap.read() if not ret: break # Exit loop if no more frames results = heatmap(frame) # tracking and heatmap overlay in one call cv2.imshow("Heatmap Visual", results.plot_im) if cv2.waitKey(10) == ord("q"): break cap.release() cv2.destroyAllWindows()If you're still facing issues, check your Ultralytics version with
pip show ultralyticsand upgrade withpip install -U ultralytics. Thanks for your patience, and we're here to help get you through this! from ultralytics import YOLO, Heatmap ImportError: cannot import name 'Heatmap' from 'ultralytics' (/home/safepro/.local/lib/python3.10/site-packages/ultralytics/init.py)
- Paula DerrengerUltralytics(editado)
Hey there! 🌟 It looks like you've encountered an import error when trying to use
Heatmapfrom theultralyticspackage.The heatmap functionality is part of the
ultralytics.solutionsmodule. The current import is:from ultralytics import solutions heatmap = solutions.Heatmap(model="yolo26n.pt", show=True)If
solutionsis not recognized, your installed version is likely too old. Update to the latest version using pip:pip install ultralytics --upgradeSee the Heatmaps guide for a full example. Thanks for your understanding, and feel free to reach out with any more questions! 🚀
hariouat
Hello everyone,
Please, how to generate heatmaps for classification model with yolov11?
Thanks in advance for your reply.
1@hariouat Hi, thanks for reaching out! At the moment, we don’t support heatmaps for the classification model. However, you can explore our heatmap implementation and adapt it to fit your specific requirements: https://github.com/ultralytics/ultralytics/blob/main/ultralytics/solutions/heatmap.py
Thank you!
- Glenn JocherUltralytics
Thank you for your question! Currently, heatmap generation in Ultralytics YOLO11 is supported for object detection tasks and not directly for classification models. If you're specifically looking to visualize classification results, you might need to adapt custom visualization techniques using libraries like Matplotlib or OpenCV. For more details on heatmap usage, visit the documentation.
hnyll
tips pls on how to generate heatmaps for single images with yolo11 model?
1also is it possible to choose what "class" or thing i want to create a heatmap of?
- Glenn JocherUltralytics(editado)
@hnyll to generate a heatmap for a single image with a YOLO model, create the
Heatmapsolution with your model and call it on the image, then use the annotated result:import cv2 from ultralytics import solutions heatmap = solutions.Heatmap(model="yolo26n.pt", show=False) results = heatmap(cv2.imread("path/to/image.jpg")) cv2.imwrite("heatmap_result.jpg", results.plot_im)Heatmaps build up intensity over time, so a single image gives only a snapshot of the detected objects. To restrict it to specific classes, pass
classes=[...]when creatingHeatmap. For more details, please refer to the Ultralytics heatmap guide. thanks for the reply. i found out how to do heatmap on single images. i just wasnt looking carefully enough. do you happen to know where i can find more information about what the classes represent? im not sure that i could find it on the Ultralytics heatmap guide. for example what classes 12 and 18 when i do
heatmap = solutions.Heatmap( show=True, model="yolo11n.pt", colormap=cv2.COLORMAP_PARULA, classes=[12,18] )also is there any way that i can add a class by training a model or something? i wanted to create heatmaps on something that probably isnt in the list of classes in the pretrained yolo model.
- Glenn JocherUltralytics
For class information, you can refer to the dataset's YAML file used during training, which lists all class names. To add a new class, you'll need to retrain the model with a dataset that includes the new class.
Jaykhokhara
Have you ever tried tracking short video segments (for example, 10-minute chunks) from the same camera based on timestamps, and then combining the heatmaps using those timestamps — such as merging 6 chunks (10 minutes each) to create a 1-hour heatmap? I tried saving the heatmap data in JSON, but the file becomes very large and slow to load. Storing the data in .npy works, but using it at scale or in a larger platform isn’t very practical. Do we have any recommended approach or solution for this in Ultralytics?
- Glenn JocherUltralytics
Yes—rather than JSON, the scalable approach is to persist the underlying accumulated raster (
heatmap.heatmap, a NumPy array) and merge by summing arrays (same camera/resolution), then normalize/visualize once at the end; you can either keep a singlesolutions.Heatmapinstance alive across your 10‑minute chunks, or save/load the array between runs (see the Heatmaps guide and the Heatmap solution reference).import numpy as np import cv2 from ultralytics import solutions heatmap = solutions.Heatmap(model="yolo26n.pt", show=False, colormap=cv2.COLORMAP_PARULA) # ...process a 10-min chunk... # results = heatmap(im0) # call per-frame # save compactly (much smaller than JSON) np.savez_compressed("cam1_2026-01-18T1200Z.npz", heatmap=heatmap.heatmap.astype(np.float32)) # later: merge multiple chunks (1-hour heatmap) merged = None for f in ["cam1_2026-01-18T1200Z.npz", "cam1_2026-01-18T1210Z.npz", "cam1_2026-01-18T1220Z.npz"]: h = np.load(f)["heatmap"] merged = h if merged is None else (merged + h)If you share what “at scale” means for your platform (e.g., cloud object storage, DB constraints, expected camera count), reply here in this discussion with a bit more detail and we can suggest the best storage format (e.g., chunked
zarr/HDF5 vs compressednpz).
wisrovi
tendrias el video de ejemplo que has usado?
- Glenn JocherUltralytics
Los videos de ejemplo específicos mostrados en la documentación no están disponibles para descarga directa. Sin embargo, puedes usar cualquier video para probar la funcionalidad de heatmaps con YOLO11:
# Usar tu propio video
yolo solutions heatmap source="path/to/tu_video.mp4" show=True

# O usar videos de ejemplo disponibles públicamente
# Prueba con videos de tráfico, multitudes, o cualquier escena con movimiento
También puedes encontrar videos de prueba gratuitos en sitios como Pixabay o usar tu cámara web con
source=0para testing en tiempo real.
haiyuou
Is there a heatmap module compatible with YOLO v11 for image detection?
I am a beginner from China. If you are willing to answer my questions, please contact me via email. Thank you very much. 1636705028@qq.com
- Glenn JocherUltralytics
@haiyuou thanks for your interest in YOLO11! The current heatmap implementation is designed for video tracking applications, but you can adapt it for single image detection by using the same Heatmap solution with static images. Please continue the discussion here on GitHub rather than via email so the entire community can benefit from the solutions.
reigngers15
how to generate the heatmap visualization just for a specific image?
- Glenn JocherUltralytics(editado)
@reigngers15 To generate a heatmap visualization for a specific image, you can adapt the solutions approach with a few modifications:
import cv2

from ultralytics import solutions

# Load your image
image = cv2.imread("path/to/your/image.jpg")

# Initialize heatmap object
heatmap = solutions.Heatmap(
    show=True,
    model="yolo26n.pt",
    colormap=cv2.COLORMAP_PARULA,
    # classes=[0, 2],  # Optional: specify classes for heatmap
)

# Process the image with the heatmap (runs the model internally)
results = heatmap(image)

# Display or save the result
cv2.imshow("Heatmap", results.plot_im)
cv2.waitKey(0)
cv2.imwrite("heatmap_result.jpg", results.plot_im)
Since heatmaps typically build up intensity over time across video frames, for a single image you'll get a snapshot visualization of detected objects. If you need more visualization control, you can find additional information in our heatmaps documentation.
how about in this code, can i add or change the size of heatmap?
Initialize heatmap object
heatmap = solutions.Heatmap( show=True, model=model, # Pass the model directly colormap=cv2.COLORMAP_PARULA, # classes=[0, 2], # Optional: specify classes for heatmap size=15 (if px) )
or is it possible to change it square instead of circle?
- Glenn JocherUltralytics
@reigngers15 Currently, the
Heatmapclass in YOLO11 doesn't have direct parameters for changing the size or shape of the heatmap points from circles to squares. The heatmap implementation uses a radius-based approach to create circular effects around detected objects.If you need to customize the size or shape of the heatmap, you would likely need to modify the
heatmap_effectmethod in the source code. This method is responsible for calculating the area of effect for each detection.Here's what you could potentially do:
-
For changing the size: You might need to fork the repository and modify the calculation in the
heatmap_effectmethod to adjust the radius used. -
For changing to a square shape: You would need to replace the circular distance calculation with a square boundary check.
For advanced customizations like these, I recommend checking out the source code in the ultralytics/solutions/heatmap.py file and making your own modified version.
If you need further guidance on specific implementation details, feel free to ask!
1 -
fangyuZ1025
That just track task , if i want do some detect, classify,segement task? how can i modify the code?
- Glenn JocherUltralytics(editado)
@fangyuZ1025 the
Heatmapsolution accumulates the locations of tracked objects, so it needs a model that outputs bounding boxes: a detection model (for exampleyolo26n.pt) or a segmentation model (for exampleyolo26n-seg.pt), which you pass asmodel=when you createsolutions.Heatmap(...). Classification models (-cls) produce no object locations, so a heatmap can't be built from them. Refer to the Heatmaps guide for detailed examples and configurations. Let me know if you need further clarification! Sorry, I think I didn't express what I meant. I am working on the heat map of yolov8 to explain the interpretability of the model. This code is doing the heat map of the video tracking task, and I want to implement my image heat map feature detection based on it. I wonder if there is any relevant code. Thanks again for your reply
- Glenn JocherUltralytics(editado)
Thank you for clarifying! To produce a heatmap for static images, you can use the same
Heatmapsolution and call it on an image:results = heatmap(image)returns a results object with the overlay inresults.plot_im. Note thatgenerate_heatmapno longer exists. For further guidance, refer to theheatmap.pyimplementation. Let us know if you need further assistance!
Halibo01
Hello, I'm trying to apply a heatmap using a classification model in YOLOv8, but I'm encountering an issue. The error message I receive is: 'AttributeError: 'NoneType' object has no attribute 'cpu'. Is there a known solution to this?
- Glenn JocherUltralytics
@Halibo01 it seems like the error might be due to an issue with the tracking results. Please ensure you are using the latest version of the Ultralytics package. If the issue persists, double-check that the model and input data are correctly loaded and processed. For more detailed guidance, refer to the Heatmaps Guide.
- Glenn JocherUltralytics
@Halibo01 it looks like you're encountering an issue with the classification model in YOLOv8. The error 'AttributeError: 'NoneType' object has no attribute 'cpu'' typically indicates that a variable expected to hold a tensor is actually
None. Please ensure that your model's output is correctly assigned and notNonebefore calling.cpu(). Additionally, verify that you are using the latest version of the Ultralytics package. For further details on heatmaps, you can refer to the Ultralytics Heatmaps Guide.