Heatmap theo dõi đối tượng bằng Ultralytics YOLO26

Giải pháp Heatmap trong Ultralytics YOLO26 theo dõi các đối tượng qua nhiều khung hình video và phủ cường độ chuyển động tích lũy lên từng khung hình, khiến khu vực đông đúc hiển thị bằng màu nóng còn khu vực yên tĩnh hiển thị bằng màu lạnh. Được xây dựng trên nền tảng theo dõi đối tượng của YOLO26, giải pháp này biến mọi video thành bản đồ hoạt động không gian, cho thấy luồng giao thông, chuyển động của đám đông và các khu vực lưu lại chỉ bằng một lệnh gọi Python hoặc lệnh CLI.
Xem: Cách tạo heatmap bằng Ultralytics YOLO26 | Trực quan hóa hoạt động của đối tượng | VisionAI trong bán lẻ 🚀
Vì sao nên dùng heatmap để phân tích video?#
- Nhận biết nhanh các kiểu hoạt động: Cường độ tích lũy tại những nơi đối tượng được theo dõi lưu lại, giúp dễ dàng nhận ra làn đường đông đúc, kệ hàng được ưa chuộng hoặc điểm ùn tắc của đám đông mà không cần xem lại từng khung hình.
- Tích hợp sẵn tracking: Giải pháp tự chạy quá trình phát hiện và tracking bằng YOLO26, vì vậy không cần kết nối riêng một pipeline tracking.
- Đếm trong cùng một lượt xử lý: Truyền
regionđể đếm các đối tượng đi vào và đi ra khỏi một vùng trong khi heatmap được tạo, kết hợp hai tác vụ phân tích trong một lần chạy.
Ứng dụng thực tế#
| Giao thông vận tải | Bán lẻ |
|---|---|
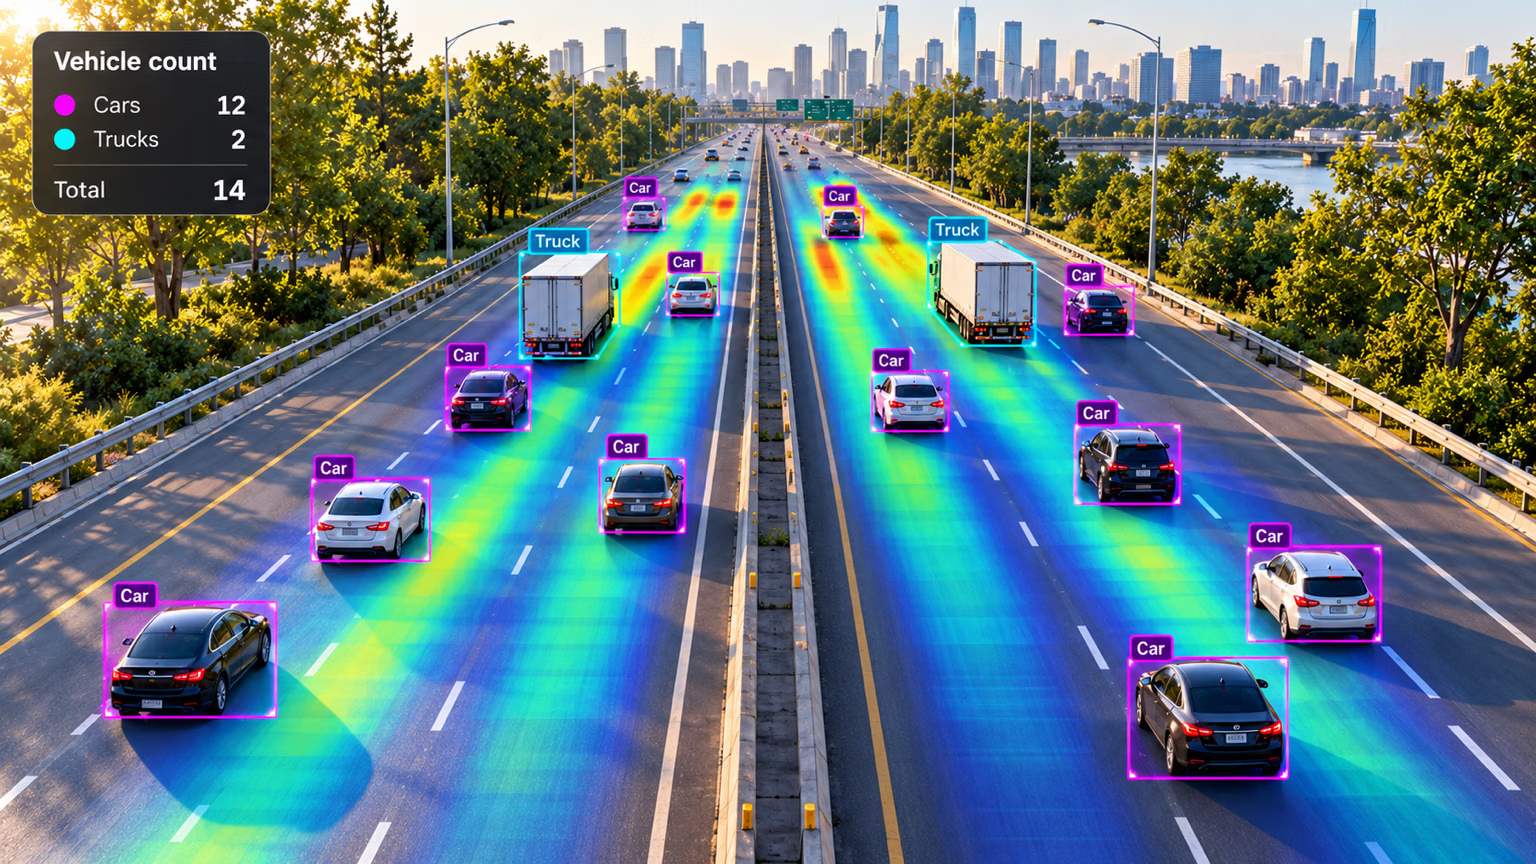 | 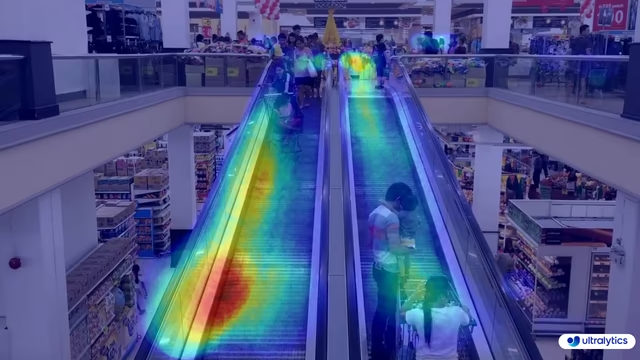 |
| Heatmap giao thông bằng Ultralytics YOLO | Heatmap bán lẻ bằng Ultralytics YOLO |
Cách tạo heatmap bằng Ultralytics YOLO#
Chạy giải pháp Heatmap trên nguồn video bằng CLI hoặc Python. Ví dụ Python ghi các khung hình đã xử lý vào tệp video đầu ra:
# Run a heatmap example
yolo solutions heatmap show=True

# Pass a source video
yolo solutions heatmap source="path/to/video.mp4"

# Pass a custom colormap
yolo solutions heatmap colormap=cv2.COLORMAP_INFERNO

# Heatmaps + object counting
yolo solutions heatmap region="[(20, 400), (1080, 400), (1080, 360), (20, 360)]"
Các đối số của Heatmap()#
Dưới đây là bảng các đối số của Heatmap:
| Đối số | Kiểu | Mặc định | Mô tả |
|---|---|---|---|
model | str | None | Đường dẫn đến tệp model Ultralytics YOLO. |
colormap | int | cv2.COLORMAP_DEEPGREEN | Bảng màu dùng cho heatmap. |
show_in | bool | True | Flag điều khiển việc hiển thị số lượt đi vào trên luồng video. |
show_out | bool | True | Flag điều khiển việc hiển thị số lượt đi ra trên luồng video. |
region | list hoặc dict | None | Các điểm xác định vùng quan tâm, dưới dạng danh sách tuple (x, y) hoặc từ điển ánh xạ tên vùng với danh sách điểm cho nhiều vùng (chỉ dùng RegionCounter). Khi là None, các giải pháp cần vùng sẽ dùng vùng mặc định được xác định trước. |
line_width | int | 2 | Độ dày đường viền của box, keypoint và số đếm mà giải pháp vẽ. |
verbose | bool | True | Bật nhật ký theo từng frame của giải pháp, gồm shape đầu vào, số lượng class và tốc độ xử lý. Bản thân lệnh gọi tracking luôn không ghi nhật ký. |
Bạn cũng có thể áp dụng các đối số track khác nhau trong giải pháp Heatmap.
| Đối số | Kiểu | Mặc định | Mô tả |
|---|---|---|---|
tracker | str | 'tracktrack.yaml' | Chỉ định thuật toán theo dõi cần sử dụng. Các tùy chọn tích hợp sẵn: botsort.yaml, bytetrack.yaml, ocsort.yaml, deepocsort.yaml, fasttrack.yaml, tracktrack.yaml. |
conf | float | 0.25 | Đặt ngưỡng confidence cho các đối tượng được phát hiện; giá trị thấp hơn cho phép theo dõi nhiều đối tượng hơn nhưng có thể bao gồm cả kết quả dương tính giả. |
iou | float | 0.5 | Đặt ngưỡng Intersection over Union (IoU) để lọc các đối tượng phát hiện bị chồng lấn. |
classes | list | None | Lọc kết quả theo chỉ mục class. Ví dụ: classes=[0, 2, 3] chỉ theo dõi các class được chỉ định. |
device | str | None | Chỉ định thiết bị dùng để suy luận (ví dụ: cpu, cuda:0 hoặc 0). Cho phép người dùng chọn CPU, một GPU cụ thể hoặc thiết bị tính toán khác để chạy model. |
imgsz | int or tuple | 640 | Kích thước ảnh suy luận mục tiêu: số nguyên cho ảnh vuông hoặc cặp (height, width). Kích thước sẽ được điều chỉnh theo stride của model. |
max_det | int | 300 | Số lượng đối tượng phát hiện tối đa được giữ lại trong mỗi khung hình trước khi theo dõi, giới hạn số đối tượng mà một giải pháp xử lý trong các cảnh dày đặc. |
quantize | int or str | None | Độ chính xác suy luận: 16 (FP16) hoặc 32/unset (FP32) cho model PyTorch và TorchScript khi chạy ngoài CPU; các định dạng khác sử dụng độ chính xác do artifact và runtime của chúng lựa chọn. Thay thế đối số half đã lỗi thời. |
Ngoài ra, các đối số trực quan hóa được hỗ trợ được liệt kê bên dưới:
| Đối số | Kiểu | Mặc định | Mô tả |
|---|---|---|---|
show | bool | False | Nếu True, hiển thị ảnh hoặc video đã được chú thích trong một cửa sổ. Hữu ích để nhận phản hồi trực quan ngay lập tức trong quá trình phát triển hoặc kiểm thử. |
show_conf | bool | True | Hiển thị điểm confidence bên cạnh nhãn của mỗi detection. Cho biết mức độ chắc chắn của model đối với từng detection. |
show_labels | bool | True | Hiển thị nhãn cho mỗi detection trong đầu ra trực quan. Giúp nhận biết ngay các đối tượng được phát hiện. |
Bảng màu heatmap#
Đối số colormap chấp nhận mọi bảng màu OpenCV. Truyền hằng số từ module cv2, chẳng hạn như colormap=cv2.COLORMAP_INFERNO:
| Tên bảng màu | Mô tả |
|---|---|
cv2.COLORMAP_AUTUMN | Bảng màu mùa thu |
cv2.COLORMAP_BONE | Bảng màu xương |
cv2.COLORMAP_JET | Bản đồ màu Jet |
cv2.COLORMAP_WINTER | Bản đồ màu Winter |
cv2.COLORMAP_RAINBOW | Bản đồ màu Rainbow |
cv2.COLORMAP_OCEAN | Bản đồ màu Ocean |
cv2.COLORMAP_SUMMER | Bản đồ màu Summer |
cv2.COLORMAP_SPRING | Bản đồ màu Spring |
cv2.COLORMAP_COOL | Bản đồ màu Cool |
cv2.COLORMAP_HSV | Bản đồ màu HSV (Sắc độ, Độ bão hòa, Giá trị) |
cv2.COLORMAP_PINK | Bản đồ màu Pink |
cv2.COLORMAP_HOT | Bản đồ màu Hot |
cv2.COLORMAP_PARULA | Bản đồ màu Parula |
cv2.COLORMAP_MAGMA | Bản đồ màu Magma |
cv2.COLORMAP_INFERNO | Bản đồ màu Inferno |
cv2.COLORMAP_PLASMA | Bản đồ màu Plasma |
cv2.COLORMAP_VIRIDIS | Bản đồ màu Viridis |
cv2.COLORMAP_CIVIDIS | Bản đồ màu Cividis |
cv2.COLORMAP_TWILIGHT | Bản đồ màu Twilight |
cv2.COLORMAP_TWILIGHT_SHIFTED | Bản đồ màu Twilight dịch chuyển |
cv2.COLORMAP_TURBO | Bản đồ màu Turbo |
cv2.COLORMAP_DEEPGREEN | Bản đồ màu Deep Green |
Cách hoạt động của heatmap#
Giải pháp Heatmap mở rộng lớp ObjectCounter. Ở khung hình được xử lý đầu tiên, giải pháp tạo một lớp cường độ trống có kích thước khớp với khung hình và bắt đầu một lớp mới mỗi khi kích thước khung hình thay đổi, thay vì thay đổi tỷ lệ hoạt động đã tích lũy cho đến thời điểm đó. Sau đó, mỗi khung hình được xử lý qua hai bước:
- YOLO26 tracking phát hiện và theo dõi mọi đối tượng trong khung hình
- Với mỗi đối tượng được theo dõi, cường độ heatmap tăng lên trong một vùng tròn có tâm tại bounding box của đối tượng đó
Mỗi khung hình một lần, lớp cường độ tích lũy được chuẩn hóa, tô màu bằng color map đã chọn rồi trộn với khung hình gốc. Lớp phủ chỉ xuất hiện sau khi ít nhất một đối tượng được theo dõi; trước đó, các khung hình được hiển thị mà không có lớp phủ heatmap.
Kết quả là một hình ảnh trực quan động được tích lũy theo thời gian, cho thấy các mô hình giao thông, chuyển động của đám đông hoặc những hành vi không gian khác trong dữ liệu video. Khi đặt region, giải pháp cũng đếm đối tượng đi vào và đi ra khỏi vùng đó trong khi heatmap được tích lũy.
Kết luận#
Giải pháp Heatmap Ultralytics YOLO26 chuyển kết quả tracking đối tượng thành lớp phủ hoạt động trực quan chỉ với vài dòng code. Để mở rộng thêm, hãy kết hợp giải pháp với đếm đối tượng, khám phá các Ultralytics Solutions khác hoặc tìm hiểu về chế độ tracking nền tảng.
Câu hỏi thường gặp#
Ultralytics YOLO26 tạo heatmap bằng cách theo dõi đối tượng qua các khung hình video và tích lũy giá trị cường độ tại vị trí của từng đối tượng được theo dõi, sau đó tô màu kết quả và trộn với khung hình gốc. Những vùng có đối tượng xuất hiện thường xuyên hoặc lưu lại lâu sẽ tích lũy cường độ cao hơn và hiển thị bằng màu ấm hơn. Để xem các tùy chọn cấu hình, hãy tham khảo phần
Heatmap()Arguments.Dùng
cv2.VideoWritercủa OpenCV và ghiresults.plot_imcho mọi khung hình đã xử lý, như minh họa trong ví dụ chính. Thuộc tínhplot_imchứa khung hình đã được áp dụng lớp phủ heatmap.Có. Truyền đối số
regionvàoHeatmap()cùng các điểm xác định đường thẳng, hình chữ nhật hoặc đa giác; giải pháp sẽ đếm đối tượng đi vào và đi ra khỏi vùng đó trong khi heatmap được tích lũy. Kết quả trả về bao gồmin_count,out_countvà số lượng theo từng lớp. Xem hướng dẫn đếm đối tượng để biết chi tiết cấu hình vùng.Truyền đối số
classesvàoHeatmap()cùng các chỉ số lớp bạn muốn giữ lại. Ví dụ:classes=[0, 2]chỉ tạo heatmap từ người và ô tô (chỉ số lớp COCO là 0 và 2):import cv2 from ultralytics import solutions cap = cv2.VideoCapture("path/to/video.mp4") heatmap = solutions.Heatmap(show=True, model="yolo26n.pt", classes=[0, 2]) while cap.isOpened(): success, im0 = cap.read() if not success: break results = heatmap(im0) cap.release() cv2.destroyAllWindows()Heatmap của Ultralytics YOLO26 tích hợp phát hiện đối tượng, tracking, tích lũy cường độ và kết xuất lớp phủ trong một lần gọi, trong khi các công cụ đa dụng như OpenCV hoặc Matplotlib yêu cầu bạn tự xây dựng pipeline đó. Giải pháp xử lý luồng video theo thời gian thực và hỗ trợ sẵn tracking liên tục cùng colormap có thể tùy chỉnh.
 glenn-jocher24
 RizwanMunawar20
 raimbekovm4
 MatthewNoyce2DNDevulapalli Naga Sri Vaishnavi1
 pderrenger1
 IvorZhu3311
 AyushExel1
 WangQvQ1
Bình luận65
Đặt câu hỏi, chia sẻ kết quả hoặc giúp đỡ người khác.
RizwanMunawar
🎉 Big News Alert! 🚀 Ultralytics Solutions CLI is here from ultralytics>=8.3.28! Now, you can easily harness the power of advanced YOLO solutions straight from the command line. Simplify your workflow, and streamline object detection, tracking, counting, and more—all with just a few commands! Get ready to experience a whole new level of efficiency! 💥
CLI Usage Overview
yolo SOLUTIONS SOLUTION_NAME ARGS- SOLUTIONS is a mandatory keyword.
- SOLUTION_NAME (optional): Choose from ['count', 'heatmap', 'queue', 'speed', 'workout', 'analytics'].
- ARGS (optional): Use custom
arg=valuepairs, likeshow_in=True, to customize settings.
Examples
yolo solutions heatmap show=True  # For object counting

yolo solutions heatmap source="path/to/video/file.mp4"  # Specify a video file path
Start exploring now and let Ultralytics Solutions CLI power up your projects!
4Arjunpixel28
Has any one applied heatmap on instance segmentation ?
2 Glenn JocherUltralytics(đã chỉnh sửa)
Yes, applying heatmaps to instance segmentation is feasible and offers a vivid way to visualize the density and distribution of detected objects across video frames 🌈. The
Heatmapsolution runs tracking itself with whatever model you give it, including a segmentation model, and accumulates intensity around each tracked object's bounding box (the masks themselves are not used). Here's a simplified example:import cv2 from ultralytics import solutions cap = cv2.VideoCapture("path/to/video.mp4") assert cap.isOpened(), "Failed to open video file or stream!" w, h, fps = (int(cap.get(x)) for x in (cv2.CAP_PROP_FRAME_WIDTH, cv2.CAP_PROP_FRAME_HEIGHT, cv2.CAP_PROP_FPS)) video_writer = cv2.VideoWriter("heatmap_output.avi", cv2.VideoWriter_fourcc(*"mp4v"), fps, (w, h)) # Initialize your heatmap object with a segmentation model heatmap = solutions.Heatmap(show=True, model="yolo26n-seg.pt", colormap=cv2.COLORMAP_PARULA) # Process video frames while cap.isOpened(): success, frame = cap.read() if not success: break # Exit loop if no more frames results = heatmap(frame) video_writer.write(results.plot_im) cap.release() video_writer.release() cv2.destroyAllWindows()This snippet performs tracking with an instance segmentation model on video frames and overlays the accumulated heatmap. Remember, the success of applying heatmaps heavily relies on the quality of your model, so ensure it has been adequately trained or fine-tuned for your instance segmentation task. Happy visualizing! 🚀
 Paula DerrengerUltralytics(đã chỉnh sửa)
Yes, applying heatmaps to instance segmentation is feasible and offers a vivid way to visualize the density and distribution of detected objects across video frames 🌈. The
Heatmapsolution tracks objects with the model you provide, including a segmentation model, and overlays the accumulated activity on each frame. It builds the heatmap from the tracked objects' bounding boxes rather than the masks.Here's a simplified example:
import cv2

from ultralytics import solutions

# Initialize video capture
cap = cv2.VideoCapture("path/to/your/video.mp4")
assert cap.isOpened(), "Error reading video file"

# Video writer setup
w, h, fps = (int(cap.get(x)) for x in (cv2.CAP_PROP_FRAME_WIDTH, cv2.CAP_PROP_FRAME_HEIGHT, cv2.CAP_PROP_FPS))
video_writer = cv2.VideoWriter("segmentation_heatmap.avi", cv2.VideoWriter_fourcc(*"mp4v"), fps, (w, h))

# Initialize heatmap with a segmentation model
heatmap = solutions.Heatmap(show=True, model="yolo26n-seg.pt", colormap=cv2.COLORMAP_JET)

while cap.isOpened():
    success, im0 = cap.read()
    if not success:
        break

    # Track objects and generate the heatmap overlay
    results = heatmap(im0)

    # Write heatmap output
    video_writer.write(results.plot_im)

# Cleanup
cap.release()
video_writer.release()
cv2.destroyAllWindows()
Feel free to experiment with different configurations, such as
colormap, to meet your specific visualization needs. Happy coding! 🚀Hi ,
heatmap_obj = heatmap.Heatmap(view_img=False, imw=w, imh=h, heatmap_alpha=0.5, colormap=cv2.COLORMAP_JET)
TypeError: Heatmap.__init__() got an unexpected keyword argument 'view_img'
when i tried to run this i got this error !
- Paula DerrengerUltralytics(đã chỉnh sửa)
Hey there! 👋 It looks like you encountered an unexpected
view_imgargument error. I'm here to help!This happens because the
view_imgargument no longer exists in theHeatmapsolution; it was replaced byshow. Update your Ultralytics library and use the current arguments:heatmap = solutions.Heatmap(show=True, model="yolo26n-seg.pt", colormap=cv2.COLORMAP_JET)To update the library, run:
pip install ultralytics --upgradeThat should do the trick! Keep us posted if you run into any more issues or need further assistance. Happy coding! 🚀
I Tried upgrading the ultralytics also its giving same attribute error heatmap_obj = heatmap.Heatmap(imw=w, imh=h, heatmap_alpha=0.5, colormap=cv2.COLORMAP_JET) TypeError: Heatmap.init() got an unexpected keyword argument 'imw'
- Paula DerrengerUltralytics(đã chỉnh sửa)
@Arjunpixel28 hi there! 👋 It seems there's a mix-up with the initialization arguments for the
Heatmapclass. You don't need to specifyimwandimh, because the frame size is taken from the frames you process. In current versions, initialize it like this:heatmap = solutions.Heatmap(model="yolo26n.pt", colormap=cv2.COLORMAP_JET, show=True) results = heatmap(frame) # annotated image is in results.plot_imSee the Heatmaps guide for the full list of arguments. This setup should work without errors. Should you face any more issues or have further questions, feel free to reach out! 🚀
Hi Paula Derrenger,
in the earlier response you had only given the parameters of imw and imh and now your saying it should not be used and even now its not working still have issue with that.
heatmap_obj = heatmap.Heatmap(colormap=cv2.COLORMAP_JET, heatmap_alpha=0.5) TypeError: Heatmap.init() got an unexpected keyword argument 'colormap'
I just asked a simple thing to apply heat map on instance segmentation since so many days you guys have not sloved that
- Paula DerrengerUltralytics(đã chỉnh sửa)
@Arjunpixel28 hey there! I understand your concern and appreciate your patience. The
Heatmapsettings are now passed when you create the object (there is no separateset_args()), and the object is called directly on each frame, running tracking itself:import cv2 from ultralytics import solutions cap = cv2.VideoCapture("path/to/video.mp4") assert cap.isOpened(), "Error reading video file" # Settings such as colormap are set at initialization heatmap = solutions.Heatmap(model="yolo26n.pt", colormap=cv2.COLORMAP_PARULA) while cap.isOpened(): success, frame = cap.read() if not success: break results = heatmap(frame) cv2.imshow("Heatmap", results.plot_im) if cv2.waitKey(1) & 0xFF == ord("q"): break cap.release() cv2.destroyAllWindows()See the Heatmaps guide for all available arguments. If you encounter other issues, please let us know! 🚀
frame_with_heatmap = heatmap_obj.generate_heatmap(frame, tracks) File "/usr/local/lib/python3.10/dist-packages/ultralytics/solutions/heatmap.py", line 163, in generate_heatmap self.heatmap *= self.decay_factor # decay factor TypeError: unsupported operand type(s) for *=: 'NoneType' and 'float' and again i got this error Type error
- Paula DerrengerUltralytics(đã chỉnh sửa)
@Arjunpixel28 hey there! 👋 It looks like you're encountering a TypeError related to the initialization of the
Heatmapobject. Sorry for the confusion caused by previous responses. TheHeatmapclass lives inultralytics.solutions(it is not importable fromultralyticsdirectly), and arguments such ascolormapandshoware passed when you create it. The object is then called on each frame:import cv2 from ultralytics import solutions cap = cv2.VideoCapture("path/to/your/video.mp4") assert cap.isOpened(), "Failed to open video." heatmap = solutions.Heatmap(model="yolo26n.pt", colormap=cv2.COLORMAP_JET) while True: ret, frame = cap.read() if not ret: break # Exit loop if no more frames results = heatmap(frame) # tracking and heatmap overlay in one call cv2.imshow("Heatmap Visual", results.plot_im) if cv2.waitKey(10) == ord("q"): break cap.release() cv2.destroyAllWindows()If you're still facing issues, check your Ultralytics version with
pip show ultralyticsand upgrade withpip install -U ultralytics. Thanks for your patience, and we're here to help get you through this! from ultralytics import YOLO, Heatmap ImportError: cannot import name 'Heatmap' from 'ultralytics' (/home/safepro/.local/lib/python3.10/site-packages/ultralytics/init.py)
- Paula DerrengerUltralytics(đã chỉnh sửa)
Hey there! 🌟 It looks like you've encountered an import error when trying to use
Heatmapfrom theultralyticspackage.The heatmap functionality is part of the
ultralytics.solutionsmodule. The current import is:from ultralytics import solutions heatmap = solutions.Heatmap(model="yolo26n.pt", show=True)If
solutionsis not recognized, your installed version is likely too old. Update to the latest version using pip:pip install ultralytics --upgradeSee the Heatmaps guide for a full example. Thanks for your understanding, and feel free to reach out with any more questions! 🚀
hariouat
Hello everyone,
Please, how to generate heatmaps for classification model with yolov11?
Thanks in advance for your reply.
1@hariouat Hi, thanks for reaching out! At the moment, we don’t support heatmaps for the classification model. However, you can explore our heatmap implementation and adapt it to fit your specific requirements: https://github.com/ultralytics/ultralytics/blob/main/ultralytics/solutions/heatmap.py
Thank you!
- Glenn JocherUltralytics
Thank you for your question! Currently, heatmap generation in Ultralytics YOLO11 is supported for object detection tasks and not directly for classification models. If you're specifically looking to visualize classification results, you might need to adapt custom visualization techniques using libraries like Matplotlib or OpenCV. For more details on heatmap usage, visit the documentation.
hnyll
tips pls on how to generate heatmaps for single images with yolo11 model?
1also is it possible to choose what "class" or thing i want to create a heatmap of?
- Glenn JocherUltralytics(đã chỉnh sửa)
@hnyll to generate a heatmap for a single image with a YOLO model, create the
Heatmapsolution with your model and call it on the image, then use the annotated result:import cv2 from ultralytics import solutions heatmap = solutions.Heatmap(model="yolo26n.pt", show=False) results = heatmap(cv2.imread("path/to/image.jpg")) cv2.imwrite("heatmap_result.jpg", results.plot_im)Heatmaps build up intensity over time, so a single image gives only a snapshot of the detected objects. To restrict it to specific classes, pass
classes=[...]when creatingHeatmap. For more details, please refer to the Ultralytics heatmap guide. thanks for the reply. i found out how to do heatmap on single images. i just wasnt looking carefully enough. do you happen to know where i can find more information about what the classes represent? im not sure that i could find it on the Ultralytics heatmap guide. for example what classes 12 and 18 when i do
heatmap = solutions.Heatmap( show=True, model="yolo11n.pt", colormap=cv2.COLORMAP_PARULA, classes=[12,18] )also is there any way that i can add a class by training a model or something? i wanted to create heatmaps on something that probably isnt in the list of classes in the pretrained yolo model.
- Glenn JocherUltralytics
For class information, you can refer to the dataset's YAML file used during training, which lists all class names. To add a new class, you'll need to retrain the model with a dataset that includes the new class.
Jaykhokhara
Have you ever tried tracking short video segments (for example, 10-minute chunks) from the same camera based on timestamps, and then combining the heatmaps using those timestamps — such as merging 6 chunks (10 minutes each) to create a 1-hour heatmap? I tried saving the heatmap data in JSON, but the file becomes very large and slow to load. Storing the data in .npy works, but using it at scale or in a larger platform isn’t very practical. Do we have any recommended approach or solution for this in Ultralytics?
- Glenn JocherUltralytics
Yes—rather than JSON, the scalable approach is to persist the underlying accumulated raster (
heatmap.heatmap, a NumPy array) and merge by summing arrays (same camera/resolution), then normalize/visualize once at the end; you can either keep a singlesolutions.Heatmapinstance alive across your 10‑minute chunks, or save/load the array between runs (see the Heatmaps guide and the Heatmap solution reference).import numpy as np import cv2 from ultralytics import solutions heatmap = solutions.Heatmap(model="yolo26n.pt", show=False, colormap=cv2.COLORMAP_PARULA) # ...process a 10-min chunk... # results = heatmap(im0) # call per-frame # save compactly (much smaller than JSON) np.savez_compressed("cam1_2026-01-18T1200Z.npz", heatmap=heatmap.heatmap.astype(np.float32)) # later: merge multiple chunks (1-hour heatmap) merged = None for f in ["cam1_2026-01-18T1200Z.npz", "cam1_2026-01-18T1210Z.npz", "cam1_2026-01-18T1220Z.npz"]: h = np.load(f)["heatmap"] merged = h if merged is None else (merged + h)If you share what “at scale” means for your platform (e.g., cloud object storage, DB constraints, expected camera count), reply here in this discussion with a bit more detail and we can suggest the best storage format (e.g., chunked
zarr/HDF5 vs compressednpz).
wisrovi
tendrias el video de ejemplo que has usado?
- Glenn JocherUltralytics
Los videos de ejemplo específicos mostrados en la documentación no están disponibles para descarga directa. Sin embargo, puedes usar cualquier video para probar la funcionalidad de heatmaps con YOLO11:
# Usar tu propio video
yolo solutions heatmap source="path/to/tu_video.mp4" show=True

# O usar videos de ejemplo disponibles públicamente
# Prueba con videos de tráfico, multitudes, o cualquier escena con movimiento
También puedes encontrar videos de prueba gratuitos en sitios como Pixabay o usar tu cámara web con
source=0para testing en tiempo real.
haiyuou
Is there a heatmap module compatible with YOLO v11 for image detection?
I am a beginner from China. If you are willing to answer my questions, please contact me via email. Thank you very much. 1636705028@qq.com
- Glenn JocherUltralytics
@haiyuou thanks for your interest in YOLO11! The current heatmap implementation is designed for video tracking applications, but you can adapt it for single image detection by using the same Heatmap solution with static images. Please continue the discussion here on GitHub rather than via email so the entire community can benefit from the solutions.
reigngers15
how to generate the heatmap visualization just for a specific image?
- Glenn JocherUltralytics(đã chỉnh sửa)
@reigngers15 To generate a heatmap visualization for a specific image, you can adapt the solutions approach with a few modifications:
import cv2

from ultralytics import solutions

# Load your image
image = cv2.imread("path/to/your/image.jpg")

# Initialize heatmap object
heatmap = solutions.Heatmap(
    show=True,
    model="yolo26n.pt",
    colormap=cv2.COLORMAP_PARULA,
    # classes=[0, 2],  # Optional: specify classes for heatmap
)

# Process the image with the heatmap (runs the model internally)
results = heatmap(image)

# Display or save the result
cv2.imshow("Heatmap", results.plot_im)
cv2.waitKey(0)
cv2.imwrite("heatmap_result.jpg", results.plot_im)
Since heatmaps typically build up intensity over time across video frames, for a single image you'll get a snapshot visualization of detected objects. If you need more visualization control, you can find additional information in our heatmaps documentation.
how about in this code, can i add or change the size of heatmap?
Initialize heatmap object
heatmap = solutions.Heatmap( show=True, model=model, # Pass the model directly colormap=cv2.COLORMAP_PARULA, # classes=[0, 2], # Optional: specify classes for heatmap size=15 (if px) )
or is it possible to change it square instead of circle?
- Glenn JocherUltralytics
@reigngers15 Currently, the
Heatmapclass in YOLO11 doesn't have direct parameters for changing the size or shape of the heatmap points from circles to squares. The heatmap implementation uses a radius-based approach to create circular effects around detected objects.If you need to customize the size or shape of the heatmap, you would likely need to modify the
heatmap_effectmethod in the source code. This method is responsible for calculating the area of effect for each detection.Here's what you could potentially do:
-
For changing the size: You might need to fork the repository and modify the calculation in the
heatmap_effectmethod to adjust the radius used. -
For changing to a square shape: You would need to replace the circular distance calculation with a square boundary check.
For advanced customizations like these, I recommend checking out the source code in the ultralytics/solutions/heatmap.py file and making your own modified version.
If you need further guidance on specific implementation details, feel free to ask!
1 -
fangyuZ1025
That just track task , if i want do some detect, classify,segement task? how can i modify the code?
- Glenn JocherUltralytics(đã chỉnh sửa)
@fangyuZ1025 the
Heatmapsolution accumulates the locations of tracked objects, so it needs a model that outputs bounding boxes: a detection model (for exampleyolo26n.pt) or a segmentation model (for exampleyolo26n-seg.pt), which you pass asmodel=when you createsolutions.Heatmap(...). Classification models (-cls) produce no object locations, so a heatmap can't be built from them. Refer to the Heatmaps guide for detailed examples and configurations. Let me know if you need further clarification! Sorry, I think I didn't express what I meant. I am working on the heat map of yolov8 to explain the interpretability of the model. This code is doing the heat map of the video tracking task, and I want to implement my image heat map feature detection based on it. I wonder if there is any relevant code. Thanks again for your reply
- Glenn JocherUltralytics(đã chỉnh sửa)
Thank you for clarifying! To produce a heatmap for static images, you can use the same
Heatmapsolution and call it on an image:results = heatmap(image)returns a results object with the overlay inresults.plot_im. Note thatgenerate_heatmapno longer exists. For further guidance, refer to theheatmap.pyimplementation. Let us know if you need further assistance!
Halibo01
Hello, I'm trying to apply a heatmap using a classification model in YOLOv8, but I'm encountering an issue. The error message I receive is: 'AttributeError: 'NoneType' object has no attribute 'cpu'. Is there a known solution to this?
- Glenn JocherUltralytics
@Halibo01 it seems like the error might be due to an issue with the tracking results. Please ensure you are using the latest version of the Ultralytics package. If the issue persists, double-check that the model and input data are correctly loaded and processed. For more detailed guidance, refer to the Heatmaps Guide.
- Glenn JocherUltralytics
@Halibo01 it looks like you're encountering an issue with the classification model in YOLOv8. The error 'AttributeError: 'NoneType' object has no attribute 'cpu'' typically indicates that a variable expected to hold a tensor is actually
None. Please ensure that your model's output is correctly assigned and notNonebefore calling.cpu(). Additionally, verify that you are using the latest version of the Ultralytics package. For further details on heatmaps, you can refer to the Ultralytics Heatmaps Guide.