MLflow Integration for Ultralytics YOLO
Introduction#
Experiment tracking is an essential part of machine learning workflows: it records metrics, parameters, and artifacts so you can reproduce results, debug issues, and improve model performance. Ultralytics YOLO, known for its real-time object detection capabilities, integrates with MLflow, an open-source platform for managing the complete machine learning lifecycle.
This guide shows how to set up and use MLflow logging in your Ultralytics YOLO project.
What is MLflow?#
MLflow is an open-source platform developed by Databricks for managing the end-to-end machine learning lifecycle. It includes tools for tracking experiments, packaging code into reproducible runs, and sharing and deploying models. MLflow is designed to work with any machine learning library and programming language.
Features#
- Metrics Logging: Logs learning rates, training losses, and validation metrics at the end of each epoch.
- Parameter Logging: Logs all the parameters used in the training.
- Artifacts Logging: Logs model artifacts, including weights and configuration files, at the end of the training.
Setup and Prerequisites#
Ensure MLflow is installed. If not, install it using pip:
pip install mlflowMLflow logging is enabled by default through the mlflow key in Ultralytics settings. If you turned it off, re-enable it:
Within the Python environment, call the update method on the settings object to change your settings:
from ultralytics import settings

# Update a setting
settings.update({"mlflow": True})

# Reset settings to default values
settings.reset()
How to Use#
Commands#
-
Set a Project Name: You can set the project name via an environment variable:
export MLFLOW_EXPERIMENT_NAME=YOUR_EXPERIMENT_NAMEOr use the
project=<project>argument when training a YOLO model, e.g.yolo train project=my_project. -
Set a Run Name: Similar to setting a project name, you can set the run name via an environment variable:
export MLFLOW_RUN=YOUR_RUN_NAMEOr use the
name=<name>argument when training a YOLO model, e.g.yolo train project=my_project name=my_name. -
Start Local MLflow Server: Without
MLFLOW_TRACKING_URI, runs are logged to MLflow's default local store in the directory where you train (mlflow.dbon MLflow 3.7 and later unless the directory already holds anmlruns/history,mlruns/on earlier versions). To view them, run this from the same directory:mlflow uiThis will start a local server at
http://127.0.0.1:5000by default. To point your training runs at a different tracking server, exportMLFLOW_TRACKING_URIbefore training:export MLFLOW_TRACKING_URI=http://127.0.0.1:5000 -
Keep the MLflow Run Active After Training: By default, Ultralytics ends the MLflow run it started when training finishes, with status
FAILEDif training raised an error before the run was closed. A run you started yourself before training is reused and left open. To keep the run open (for example, to log additional metrics or artifacts from the same notebook), setMLFLOW_KEEP_RUN_ACTIVEtoTruebefore training:export MLFLOW_KEEP_RUN_ACTIVE=TrueThe values
1,true,yes,on,y, andtenable this behavior (case-insensitive). Any other value, including an unset variable, keeps the default of closing the run. Remember to close it manually afterwards withmlflow.end_run().
Logging#
The logging is taken care of by the on_pretrain_routine_end, on_train_epoch_end, on_fit_epoch_end, and on_train_end callback functions. These functions are automatically called during the respective stages of the training process, and they handle the logging of parameters, metrics, and artifacts. The teardown callback ends a run that a failed training left open.
Examples#
-
Logging Custom Metrics: You can add custom metrics to be logged by modifying the
trainer.metricsdictionary beforeon_fit_epoch_endis called. -
View Experiment: To view your logs, navigate to your MLflow server (usually
http://127.0.0.1:5000) and select your experiment and run.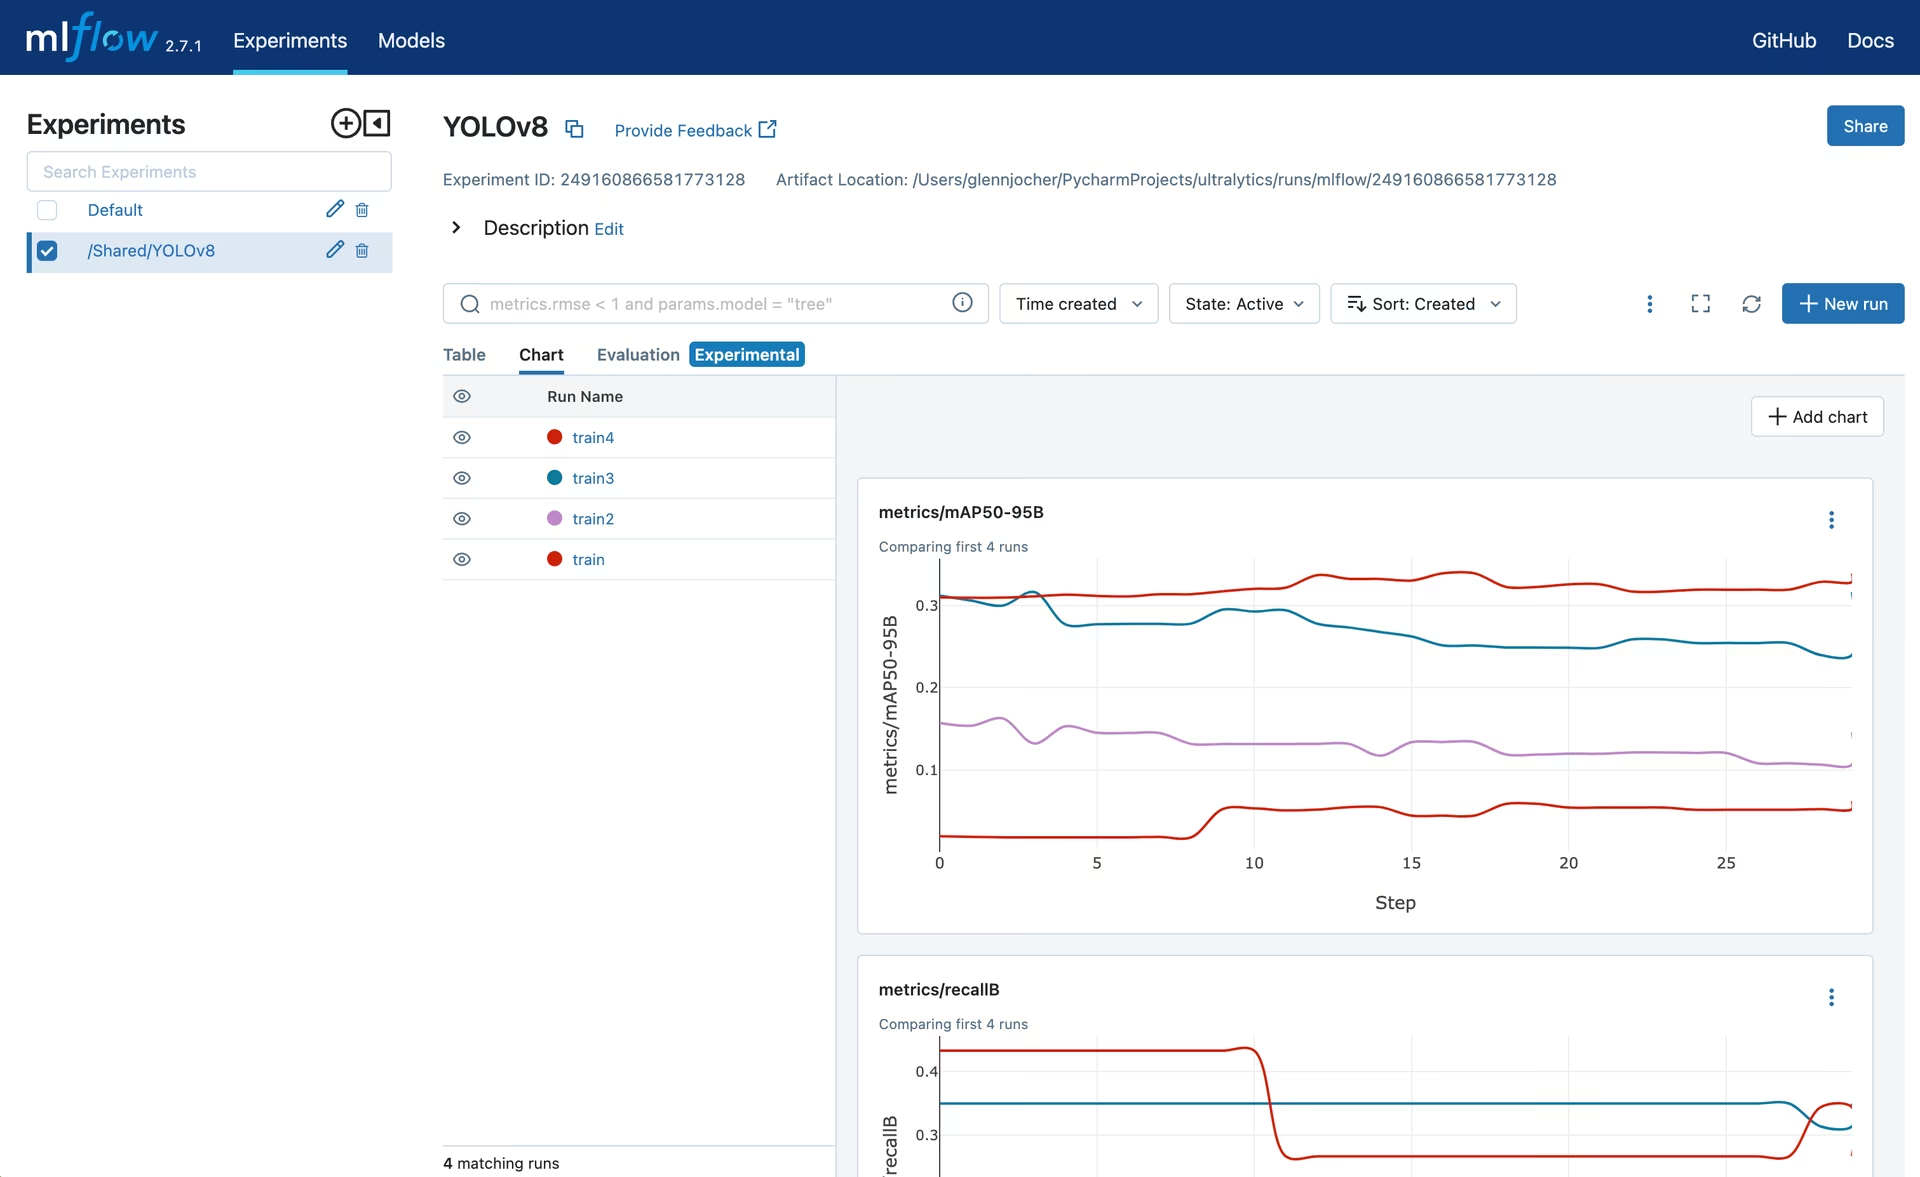
-
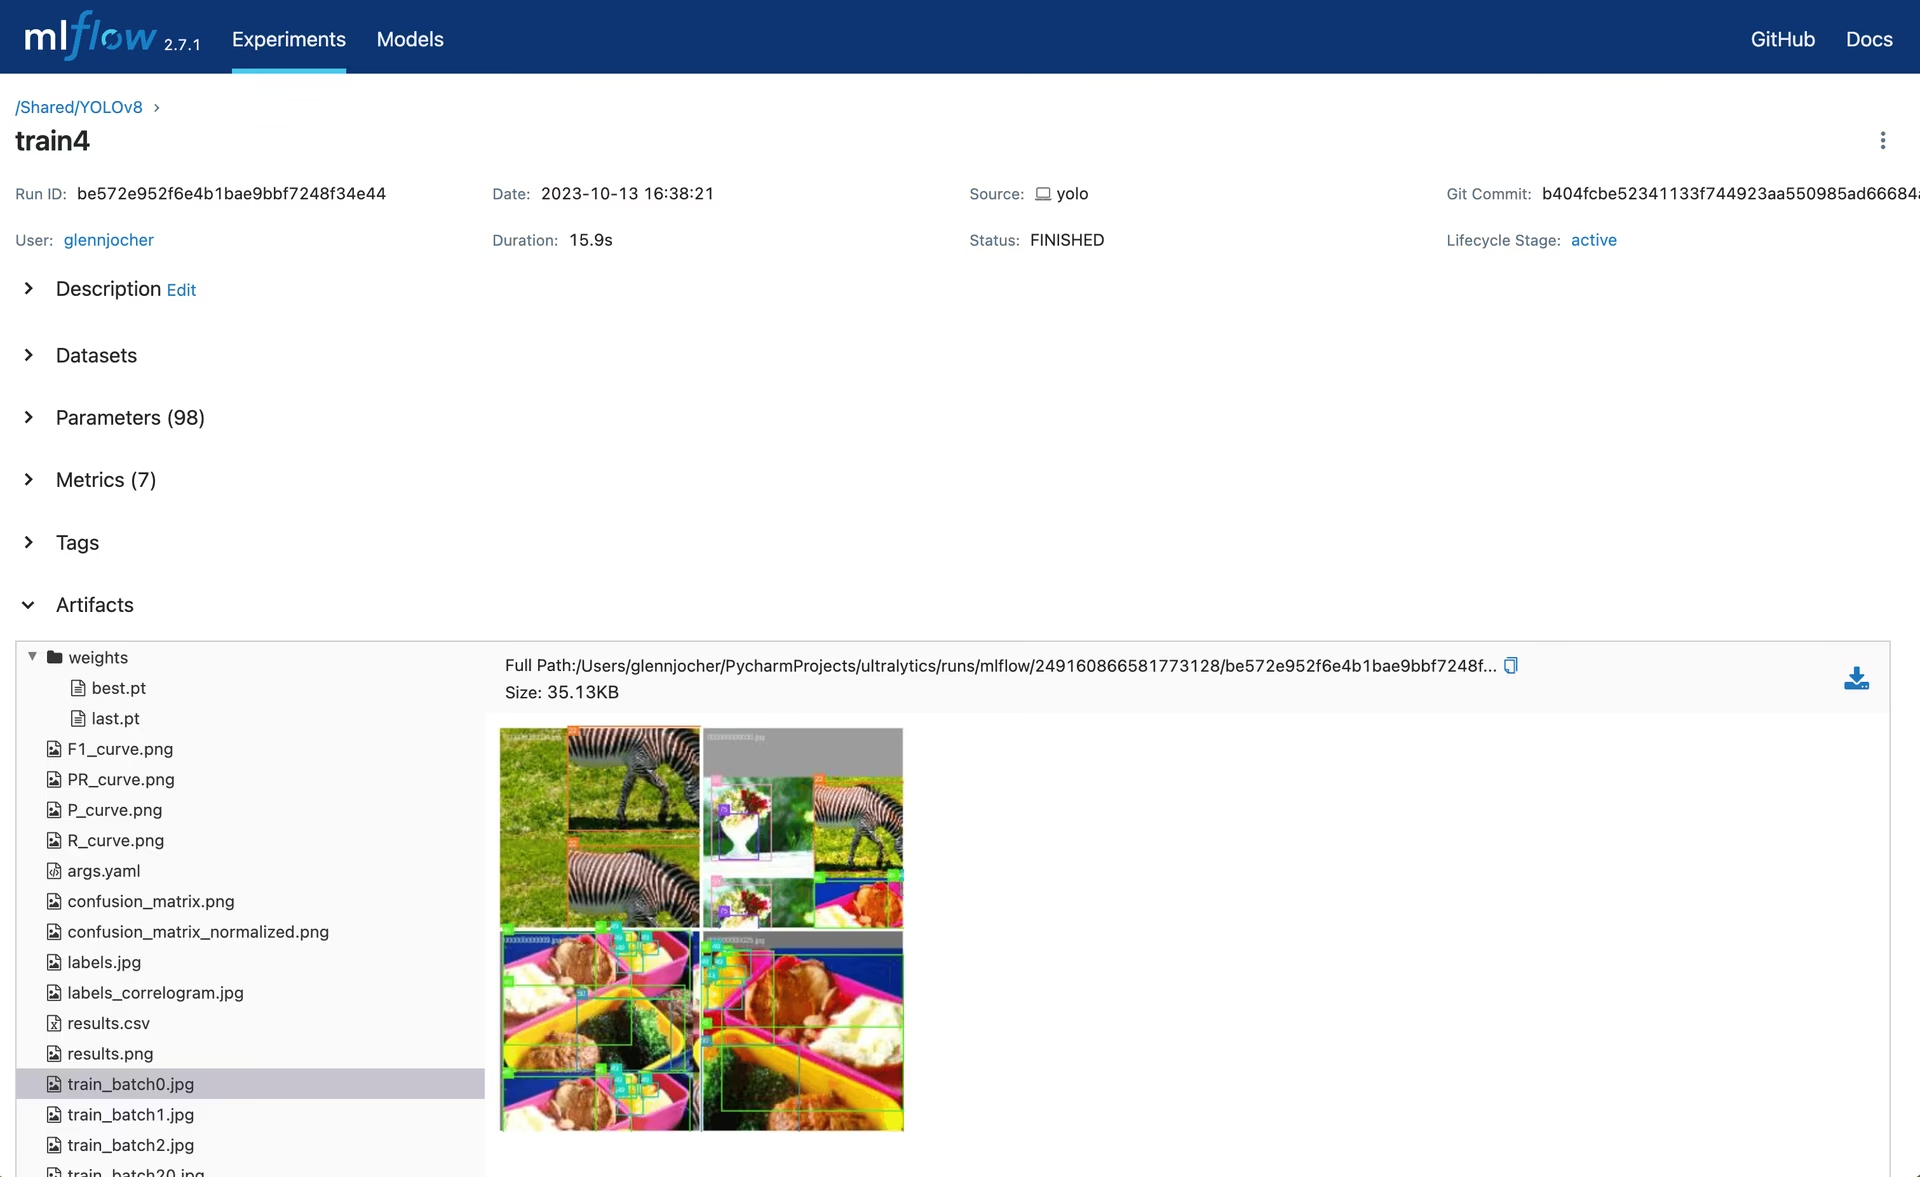
View Run: Runs are individual models inside an experiment. Click a run to see its details, including uploaded artifacts and model weights.
Disabling MLflow#
To turn off MLflow logging:
yolo settings mlflow=FalseConclusion#
MLflow logging integration with Ultralytics YOLO offers a simple way to keep track of your machine learning experiments. It lets you monitor performance metrics and manage artifacts throughout model development and deployment.
FAQ#
To set up MLflow logging with Ultralytics YOLO, you first need to ensure MLflow is installed. You can install it using pip:
pip install mlflowMLflow logging is enabled by default through the
mlflowkey in Ultralytics settings. If you turned it off, re-enable it:Update Ultralytics MLflow Settingsfrom ultralytics import settings # Update a setting settings.update({"mlflow": True}) # Reset settings to default values settings.reset()Finally, after training, view your runs by starting a local MLflow server from the directory where you trained:
mlflow uiUltralytics YOLO with MLflow supports logging various metrics, parameters, and artifacts throughout the training process:
- Metrics Logging: Tracks metrics at the end of each epoch and upon training completion.
- Parameter Logging: Logs all parameters used in the training process.
- Artifacts Logging: Saves model artifacts like weights and configuration files after training.
Yes, you can disable MLflow logging for Ultralytics YOLO by updating the settings. Here's how you can do it using the CLI:
yolo settings mlflow=FalseFor further customization and resetting settings, refer to the settings guide.
To view your Ultralytics YOLO experiments in a local MLflow server, run the following command from the directory where you trained:
mlflow uiThis command starts a local server at
http://127.0.0.1:5000by default. PressCtrl+Cin that terminal to stop it.Refer to the commands section for more command options.
Set the
MLFLOW_KEEP_RUN_ACTIVEenvironment variable toTruebefore training:export MLFLOW_KEEP_RUN_ACTIVE=TrueBy default this is
False, so Ultralytics callsmlflow.end_run()on the run it started once training completes. WithMLFLOW_KEEP_RUN_ACTIVE=Truethe run stays open so you can log extra metrics, parameters, or artifacts from the same Python session — close it yourself withmlflow.end_run()when finished. The values1,true,yes,on,y, andtenable this behavior (case-insensitive).Integrating MLflow with Ultralytics YOLO offers several benefits for managing your machine learning experiments:
- Enhanced Experiment Tracking: Track and compare different runs and their outcomes.
- Improved Model Reproducibility: Ensure that your experiments are reproducible by logging all parameters and artifacts.
- Performance Monitoring: Visualize performance metrics over time to make data-driven decisions for model improvements.
- Streamlined Workflow: Automate the logging process to focus more on model development rather than manual tracking.
- Collaborative Development: Share experiment results with team members for better collaboration and knowledge sharing.


Comments30
Ask a question, share your results, or help someone else.
UltralyticsAssistantUltralytics
👋 Bonjour, merci pour votre intérêt pour Ultralytics 🚀! Nous vous recommandons de consulter notre documentation complète sur les Intégrations MLflow pour découvrir comment configurer et utiliser MLflow avec Ultralytics YOLO afin d'améliorer le suivi des expériences et la reproductibilité des modèles.
Si ceci est un 🐛 Rapport de bug, veuillez fournir un exemple minimal reproductible pour nous aider à résoudre le problème.
Si vous avez une ❓ Question ou besoin d’aide avec la configuration MLflow, n'hésitez pas à partager plus de détails, tels que votre environnement d'exécution, les étapes effectuées et les éventuels messages d'erreur rencontrés.
Mise à jour
Assurez-vous que vous utilisez la version la plus récente d’
ultralyticsavec toutes les dépendances dans un environnement Python>=3.8 et PyTorch>=1.8. Vous pouvez mettre à jour avec la commande suivante :pip install -U ultralyticsEnvironnements
Vous pouvez exécuter YOLO dans les environnements suivants avec MLflow :
- Notebooks avec GPU gratuit :


- Cloud : Consultez nos guides rapides pour GCP et AWS.
- Docker Image : Consultez notre guide Docker
.
Communauté
Rejoignez la communauté Ultralytics où cela vous convient le mieux ! Pour des discussions en temps réel, rendez-vous sur notre Discord 🎧. Pour des discussions approfondies, visitez notre Discourse, ou échangez avec la communauté sur notre Subreddit.
Statut

Si ce badge est vert, tous les tests Ultralytics CI sont actuellement réussis, garantissant le bon fonctionnement de toutes les Modes et Tâches sur macOS, Windows et Ubuntu.
Ceci est une réponse automatisée 🤖. Un ingénieur Ultralytics examinera également votre discussion prochainement. 😊
 Glenn JocherUltralytics
Bonjour! Cette discussion est dédiée à l'intégration de MLflow avec Ultralytics YOLO. MLflow est un excellent outil pour suivre vos expériences, mesurer les performances et gérer les artefacts de vos modèles YOLO.
N'hésitez pas à poser vos questions sur cette intégration dans les commentaires ci-dessous. Notre équipe Ultralytics sera ravie de vous aider avec la configuration, le suivi des expériences ou tout problème que vous pourriez rencontrer.
Si vous utilisez déjà MLflow avec Ultralytics, nous serions également intéressés par vos retours d'expérience et vos cas d'utilisation.
- Notebooks avec GPU gratuit :
BlitzBricksterYY-db
For multiple GPU training a YOLO model, with autolog enabled and also I manually logged a few items by using mlflow.log_xxx() and I also logged the customized PyFunc model, it turns out to be multiple runs are generated per training.
I want to only have 1 run and it better have all the logged artifacts.
- Can you give a best practice advice?
- which GPU rank in a multiple GPU training is used for autologging purpose? I suppose is it the highest rank GPU?
Thanks Best, Yang
my code example:
from pyspark.ml.torch.distributor import TorchDistributor settings.update({"mlflow":True}) # if you do want to autolog. mlflow.autolog(disable = False) def train_fn(): from ultralytics import YOLO import torch import mlflow import torch.distributed as dist from ultralytics import settings from mlflow.types.schema import Schema, ColSpec from mlflow.models.signature import ModelSignature model = YOLO(f"{project_location}/raw_model/yolov8n.pt") model.train( batch=8, device=[0, 1], data="./coco8.yaml", # ref: https://github.com/ultralytics/ultralytics/blob/main/ultralytics/cfg/datasets/coco8.yaml epochs=5, project=f'{tmp_project_location}', exist_ok=True, fliplr=1, flipud=1, perspective=0.001, degrees=.45 ) # after training is done. if not dist.is_initialized(): # import torch.distributed as dist dist.init_process_group("nccl") rank = dist.get_rank() # we divert all other manual logging to the last GPU with max rank. if rank == torch.cuda.device_count() - 1: mlflow.log_params({"rank":rank}) yolo_wrapper = YOLOC(model.trainer.best) mlflow.pyfunc.log_model( artifact_path="model", artifacts={'model_path': str(model.trainer.save_dir), "best_point": str(model.trainer.best)}, python_model=yolo_wrapper, signature=signature ) mlflow.end_run() experiment_name = "/Users/yang.yang@databricks.com/ConvaTec Workshop Computer Vision/Experiments_YOLO_CoCo" mlflow.set_experiment(experiment_name) experiment_id = mlflow.get_experiment_by_name(experiment_name).experiment_id # os.environ['MLFLOW_EXPERIMENT_NAME'] = experiment_name os.environ['MLFLOW_EXPERIMENT_ID'] = experiment_id os.environ['MLFLOW_ENABLE_SYSTEM_METRICS_LOGGING'] = "true" with mlflow.start_run(experiment_id = experiment_id) as run: print("Active run_id: {}".format(run.info.run_id)) os.environ['MLFLOW_RUN_ID'] = run.info.run_id # try to register under the same run distributor = TorchDistributor(num_processes=2, local_mode=True, use_gpu=True ) distributor.run(train_fn)Also, is it possible to enable multi-GPU training to use the project folder on Databricks Unity Catalog Volume directory?
e.g.,
project=f'{tmp_project_location}',from above code in themodel.train()args.- Glenn JocherUltralytics
To achieve a single MLflow run during multi-GPU training, ensure manual logging is executed only once, typically on the main GPU (rank 0). For project directories, you can specify the Unity Catalog Volume directory by setting the
projectparameter to your desired path. This should work as expected on Databricks. If you encounter issues, verify the permissions and path configurations for the Unity Catalog Volume. I have tested, in multi-GPU settings,
- dbfs path wont work in
project= - Unity Catalog path wont work in
project= - VM path such as
project='/tmp/project/'works.
I have included in the
train_fn()the os.environ() for both databricks_host and databricks_pat (token). This doesn't help.In a single GPU setting, these all work.
I suspect the credential env vars are not passed correctly to worker GPUs or threads. Could you verify?
- dbfs path wont work in
2nd Issue: for autologging system metrics, there are confusions of logging each node, each GPU's system metrics into the MLflow run.
What is the best practice if I have two nodes and each node has two GPUs? for each node, it has GPU 0 and GPU 1 as local rank.
-
Plan A I tried: Logging all into the same MLflow run will yield 2 GPUs. Looks like overwritten issues happened between two nodes.
-
Logging into 4 different mlflow runs (each GPU created a run), then each run has its own GPU 0 and GPU 1, in total, I have 2*4 = 8 GPU system metrics, there must be duplications there.
What is the right way to do that?
-
- Glenn JocherUltralytics
@BlitzBricksterYY-db to avoid overwriting issues during multi-GPU and multi-node training with MLflow autologging, the best practice is usually to log system metrics from only the primary GPU (rank 0) on each node. This ensures unique entries and avoids duplication or conflicts. Configure logging in your script such that only rank 0 GPUs per node execute the logging logic. Let us know if further clarification is needed!
For system metrics like memory and network bandwidth usage, it is automatically done in the .train() function. I have the need to monitor each GPU on each node, i.e., [[0,1],[0,1]], what is the best way to achieve that? Automatically logging system metrics will overwritten each other cause only record GPU_0 and GPU_1, no matter it is node_0 or node_1.
I know for now single node with multiGPU is a clear solution as it is [0,1,2,3], logged perfectly by your auto logging within .train()
- Glenn JocherUltralytics
@BlitzBricksterYY-db to monitor system metrics for each GPU on each node in a multi-node, multi-GPU setup, the best approach is to disable automatic MLflow autologging for system metrics and implement custom logging. You can use GPU-specific identifiers (e.g., node rank and GPU local rank) to avoid overwriting and ensure distinct logs for each GPU. For assistance with custom implementations, refer to the MLflow documentation. Let us know if further clarification is needed!
1
vini-c-costa
Hey
I'm facing a strange situation between yolov8 and mlflow. I created a local container to run a postgres environment, and then I tried the following script:
import pandas as pd
from ultralytics import YOLO, settings
import os
import json
import mlflow


settings.reset()

settings.update({
    'mlflow': True,
    'clearml': False,
    'comet': False,
    'dvc': False,
    'hub': False,
    'neptune': False,
    'raytune': False,
    'tensorboard': False,
    'wandb': False
})

mlflow.set_experiment("Teste 01")
mlflow.set_tracking_uri("postgresql://user:senha@localhost:5432/postgres")

model_name = "yolov8n-cls.pt"
model = YOLO(model_name)
epochs = 3
image_size = 128

with mlflow.start_run(run_name=f'{model_name}-{epochs}-{image_size}'):
    model.train(name=f'{model_name}-{epochs}-{image_size}', data='dataset', epochs=epochs, imgsz=image_size, hsv_h=1, hsv_s=1, hsv_v=1)
The reason I maintained some mlflow configs out of with statement is because I would like to preserve all parameters, metrics and artifacts generated automatically by yolo-mlflow settings.
And the error I found was during the db creation: the experiment_id generated by yolo is bigger than serial4 type, which is the type used as postgres-mlflow default (a bigint type would solve I suppose). So, due to that, I'm facing the following error:
Traceback (most recent call last):
  File "/home/viniciusconti/miniconda3/envs/carbigdata_py310/lib/python3.10/site-packages/sqlalchemy/engine/base.py", line 1969, in _exec_single_context
    self.dialect.do_execute(
  File "/home/viniciusconti/miniconda3/envs/carbigdata_py310/lib/python3.10/site-packages/sqlalchemy/engine/default.py", line 922, in do_execute
    cursor.execute(statement, parameters)
psycopg2.errors.NumericValueOutOfRange: value "653626019723855191" is out of range for type integer
LINE 3: WHERE experiments.experiment_id = '653626019723855191' AND e...
                                          ^


The above exception was the direct cause of the following exception:

Traceback (most recent call last):
  File "/home/viniciusconti/miniconda3/envs/carbigdata_py310/lib/python3.10/site-packages/mlflow/store/db/utils.py", line 141, in make_managed_session
    yield session
  File "/home/viniciusconti/miniconda3/envs/carbigdata_py310/lib/python3.10/site-packages/mlflow/store/tracking/sqlalchemy_store.py", line 386, in get_experiment
    return self._get_experiment(
  File "/home/viniciusconti/miniconda3/envs/carbigdata_py310/lib/python3.10/site-packages/mlflow/store/tracking/sqlalchemy_store.py", line 360, in _get_experiment
    .one_or_none()
  File "/home/viniciusconti/miniconda3/envs/carbigdata_py310/lib/python3.10/site-packages/sqlalchemy/orm/query.py", line 2774, in one_or_none
    return self._iter().one_or_none()  # type: ignore
  File "/home/viniciusconti/miniconda3/envs/carbigdata_py310/lib/python3.10/site-packages/sqlalchemy/orm/query.py", line 2847, in _iter
    result: Union[ScalarResult[_T], Result[_T]] = self.session.execute(
  File "/home/viniciusconti/miniconda3/envs/carbigdata_py310/lib/python3.10/site-packages/sqlalchemy/orm/session.py", line 2308, in execute
    return self._execute_internal(
  File "/home/viniciusconti/miniconda3/envs/carbigdata_py310/lib/python3.10/site-packages/sqlalchemy/orm/session.py", line 2190, in _execute_internal
    result: Result[Any] = compile_state_cls.orm_execute_statement(
  File "/home/viniciusconti/miniconda3/envs/carbigdata_py310/lib/python3.10/site-packages/sqlalchemy/orm/context.py", line 293, in orm_execute_statement
    result = conn.execute(
  File "/home/viniciusconti/miniconda3/envs/carbigdata_py310/lib/python3.10/site-packages/sqlalchemy/engine/base.py", line 1416, in execute
    return meth(
  File "/home/viniciusconti/miniconda3/envs/carbigdata_py310/lib/python3.10/site-packages/sqlalchemy/sql/elements.py", line 517, in _execute_on_connection
    return connection._execute_clauseelement(
  File "/home/viniciusconti/miniconda3/envs/carbigdata_py310/lib/python3.10/site-packages/sqlalchemy/engine/base.py", line 1639, in _execute_clauseelement
    ret = self._execute_context(
  File "/home/viniciusconti/miniconda3/envs/carbigdata_py310/lib/python3.10/site-packages/sqlalchemy/engine/base.py", line 1848, in _execute_context
    return self._exec_single_context(
  File "/home/viniciusconti/miniconda3/envs/carbigdata_py310/lib/python3.10/site-packages/sqlalchemy/engine/base.py", line 1988, in _exec_single_context
    self._handle_dbapi_exception(
  File "/home/viniciusconti/miniconda3/envs/carbigdata_py310/lib/python3.10/site-packages/sqlalchemy/engine/base.py", line 2344, in _handle_dbapi_exception
    raise sqlalchemy_exception.with_traceback(exc_info[2]) from e
  File "/home/viniciusconti/miniconda3/envs/carbigdata_py310/lib/python3.10/site-packages/sqlalchemy/engine/base.py", line 1969, in _exec_single_context
    self.dialect.do_execute(
  File "/home/viniciusconti/miniconda3/envs/carbigdata_py310/lib/python3.10/site-packages/sqlalchemy/engine/default.py", line 922, in do_execute
    cursor.execute(statement, parameters)
sqlalchemy.exc.DataError: (psycopg2.errors.NumericValueOutOfRange) value "653626019723855191" is out of range for type integer
LINE 3: WHERE experiments.experiment_id = '653626019723855191' AND e...
                                          ^

[SQL: SELECT experiments.experiment_id AS experiments_experiment_id, experiments.name AS experiments_name, experiments.artifact_location AS experiments_artifact_location, experiments.lifecycle_stage AS experiments_lifecycle_stage, experiments.creation_time AS experiments_creation_time, experiments.last_update_time AS experiments_last_update_time
FROM experiments
WHERE experiments.experiment_id = %(experiment_id_1)s AND experiments.lifecycle_stage IN (%(lifecycle_stage_1_1)s, %(lifecycle_stage_1_2)s)]
[parameters: {'experiment_id_1': '653626019723855191', 'lifecycle_stage_1_1': 'active', 'lifecycle_stage_1_2': 'deleted'}]
(Background on this error at: https://sqlalche.me/e/20/9h9h)

During handling of the above exception, another exception occurred:

Traceback (most recent call last):
  File "/home/viniciusconti/carbigdata/repos/color-ml/yolo-test/yolo_impl.py", line 32, in <module>
    with mlflow.start_run(run_name=f'{model_name}-3-128'):
  File "/home/viniciusconti/miniconda3/envs/carbigdata_py310/lib/python3.10/site-packages/mlflow/tracking/fluent.py", line 377, in start_run
    active_run_obj = client.create_run(
  File "/home/viniciusconti/miniconda3/envs/carbigdata_py310/lib/python3.10/site-packages/mlflow/tracking/client.py", line 339, in create_run
    return self._tracking_client.create_run(experiment_id, start_time, tags, run_name)
  File "/home/viniciusconti/miniconda3/envs/carbigdata_py310/lib/python3.10/site-packages/mlflow/tracking/_tracking_service/client.py", line 132, in create_run
    return self.store.create_run(
  File "/home/viniciusconti/miniconda3/envs/carbigdata_py310/lib/python3.10/site-packages/mlflow/store/tracking/sqlalchemy_store.py", line 462, in create_run
    experiment = self.get_experiment(experiment_id)
  File "/home/viniciusconti/miniconda3/envs/carbigdata_py310/lib/python3.10/site-packages/mlflow/store/tracking/sqlalchemy_store.py", line 385, in get_experiment
    with self.ManagedSessionMaker() as session:
  File "/home/viniciusconti/miniconda3/envs/carbigdata_py310/lib/python3.10/contextlib.py", line 153, in __exit__
    self.gen.throw(typ, value, traceback)
  File "/home/viniciusconti/miniconda3/envs/carbigdata_py310/lib/python3.10/site-packages/mlflow/store/db/utils.py", line 155, in make_managed_session
    raise MlflowException(message=e, error_code=BAD_REQUEST)
mlflow.exceptions.MlflowException: (psycopg2.errors.NumericValueOutOfRange) value "653626019723855191" is out of range for type integer
LINE 3: WHERE experiments.experiment_id = '653626019723855191' AND e...
                                          ^

[SQL: SELECT experiments.experiment_id AS experiments_experiment_id, experiments.name AS experiments_name, experiments.artifact_location AS experiments_artifact_location, experiments.lifecycle_stage AS experiments_lifecycle_stage, experiments.creation_time AS experiments_creation_time, experiments.last_update_time AS experiments_last_update_time
FROM experiments
WHERE experiments.experiment_id = %(experiment_id_1)s AND experiments.lifecycle_stage IN (%(lifecycle_stage_1_1)s, %(lifecycle_stage_1_2)s)]
[parameters: {'experiment_id_1': '653626019723855191', 'lifecycle_stage_1_1': 'active', 'lifecycle_stage_1_2': 'deleted'}]
(Background on this error at: https://sqlalche.me/e/20/9h9h)
I was wondering if I could just define the experiment_id as a serial4, maintaining it in MLFlow patterns (numerical order e.g 1, 2, 3, 4...). I thought about fix it manually by changing the type directly on my database, but I believe that there's a smarter way to fix it.
Does anyone know how to solve it?
- Glenn JocherUltralytics
@vini-c-costa it seems the issue is related to the experiment_id exceeding the integer range in PostgreSQL. You might consider altering the database schema to use a
bigintfor the experiment_id. This should resolve the out-of-range error. For further details on MLflow integration, please visit the Ultralytics documentation.
MoAbbasid
@pderrenger Ive set the tracking uri correctly to point to the sqlite database but the db itself created after the Yolo training run is empty and has experiments or run, this is automatically generated by Ultralytics right? so this is an issue on Ultralytics side?
 Paula DerrengerUltralytics
Hi @MoAbbasid,
Thanks for reaching out! The creation and management of the SQLite database for MLflow is generally handled by MLflow itself rather than directly by Ultralytics. If the database is empty after a training run, it's possible that the MLflow tracking URI might not be set correctly, or the logging calls are not being executed as expected.
Here are a few things you can check:
- Ensure that MLflow is correctly installed and that the MLflow server is running during your training sessions.
- Verify that the
MLFLOW_TRACKING_URIis correctly pointing to your SQLite database. - Confirm that MLflow logging is enabled in your Ultralytics settings and that the logging functions (
on_pretrain_routine_end,on_fit_epoch_end, andon_train_end) are being triggered.
If these steps don't resolve the issue, it might be helpful to check the MLflow logs for any errors or warnings that could provide more insight.
Let us know how it goes or if you need further assistance!
how to set mlflow to true using CLI?
Im trying to log YOLO experiments using mlflow on a remote server, any idea how to do that?
do I have to use python and with mlflow.start run()? or can I do something similar from the command line?
- Paula DerrengerUltralytics
You can enable MLflow logging directly from the command line without needing to use
mlflow.start_run(). Simply update the settings using the CLI:yolo settings mlflow=TrueThen, you can set the project and run names when training your model:
yolo train project=my_project name=my_runThis will handle the logging of metrics, parameters, and artifacts automatically. For more detailed guidance, please refer to the documentation. Happy logging! 🚀
@pderranger, when I run this and check my mlflow server running locally I dont see the experiment results, only when I specify it in python mlflow.start run() do I see the run
and mlflow.autolog doesnt work, could you provide a working example of all segmentation results logged to mlflow?
- Paula DerrengerUltralytics(edited)
Thank you for your feedback! To ensure all segmentation results are logged to MLflow, you can follow these steps:
-
Enable MLflow Logging:
yolo settings mlflow=True -
Set Project and Run Names:
export MLFLOW_EXPERIMENT_NAME=my_experiment export MLFLOW_RUN=my_run -
Train Your Model:
yolo segment train project=my_project name=my_run
If
mlflow.autologisn't working as expected, you can manually log metrics and artifacts using themlflowlibrary within your training script. Here’s a basic example:import mlflow from ultralytics import YOLO # Start an MLflow run with mlflow.start_run(): # Load and train your model model = YOLO('yolov8n-seg.pt') results = model.train(data='coco128-seg.yaml', epochs=100, imgsz=640) # Log metrics and artifacts mlflow.log_metrics({'mAP50_95': results.box.map}) mlflow.log_artifacts(str(model.trainer.save_dir))This approach ensures all relevant data is logged to your MLflow server. For more detailed guidance, please refer to the MLflow Integration Documentation. If you have any further questions, feel free to ask! 😊
-
@pderranger, hi thanks I managed to get it to run for training with your code, but my val runs dont show up, any idea how I can log val mode in mlflow?
@pderranger, also it is reading from "runs/mlflow" directory fine but when I try to set up a sqlite db it fails to read the logged files
@pderranger, hi when setting mlflow=True, Yolov8 logs it under runs/mlflow, which includes the experiments, runs, and artifacts and there is an mlflow.db file, if I want these logs to be an sqlite format and have mlflow read them, what can I do? USING CLI
even tho --backend-store-uri runs the logged experiments correctly, the "runs/mlflow.db" database folder has empty experiments and runs, this means it an Ultralytics logging issue not an mlflow issue, please advise
@pderranger, how do I get yolov8 to automatically log to sqlite database?
- Paula DerrengerUltralytics(edited)
Hello @MoAbbasid,
For logging validation runs in MLflow, you can manually log the metrics after validation. Here's a basic example:
import mlflow
from ultralytics import YOLO

model = YOLO('yolov8n-seg.pt')
results = model.val(data='coco128-seg.yaml')

# Log the validation metrics you need, for example mAP50-95
mlflow.log_metrics({'mAP50_95': results.box.map})
Regarding your issue with setting up a SQLite database for MLflow, ensure that your MLflow server is correctly configured to use the SQLite backend. You might need to specify the SQLite URI when starting the MLflow server:
mlflow server --backend-store-uri sqlite:///mlflow.db --default-artifact-root ./artifactsMake sure the path to the SQLite database (
mlflow.db) is correct and accessible. If you continue to face issues, checking the MLflow server logs for any error messages could provide more insights.If you need further assistance, feel free to ask!
@pderranger, I initiated the server using your code: "mlflow server --backend-store-uri sqlite:///mlflow.db --default-artifact-root ./artifacts", and I have set mlflow=True in yolo settings but after I train the results are still logged to directory runs/mlflow and not the sqlite database, I also tried setting "export SET_TRACKING_URI=/runs/mlflow.db" but that threw an error. any advise about how to have the logs stored in an sql database in the CLI automatically?
- Paula DerrengerUltralytics
Hello @MoAbbasid,
It seems like there might be a misunderstanding in setting the MLflow tracking URI. The
SET_TRACKING_URIenvironment variable you tried setting is not recognized by MLflow. Instead, you should set theMLFLOW_TRACKING_URIenvironment variable to point to your SQLite database. Here’s how you can do it:-
Set the MLflow Tracking URI:
export MLFLOW_TRACKING_URI=sqlite:///mlflow.db -
Start the MLflow Server: Ensure you start the MLflow server with the correct backend store URI if you are using a server:
mlflow server --backend-store-uri sqlite:///mlflow.db --default-artifact-root ./artifacts -
Run Your Training: With the environment variable set, start your training as usual. MLflow should now log directly to the SQLite database specified.
If you continue to face issues, please ensure that the path to the SQLite database is correct and accessible, and that there are no permission issues. Also, verify that the MLflow version you are using supports the features and configurations you are trying to use.
Let me know if this helps or if you need further assistance!
-